| Param | Original file | Final file |
|---|---|---|
| Filename | modeM0/AS1A12_025T10_9000005384_38399cztM0_level2.fits | modeM0/AS1A12_025T10_9000005384_38399cztM0_level2_quad_clean.evt |
| Size (bytes) | 303,863,040 | 65,211,840 |
| Size | 289.8 MB | 62.2 MB |
| Events in quadrant A | 2,080,477 | 434,910 |
| Events in quadrant B | 1,891,871 | 447,281 |
| Events in quadrant C | 1,836,307 | 430,165 |
| Events in quadrant D | 5,135,733 | 386,853 |
| Mode SS | |||
|---|---|---|---|
| Quadrant | BADHDUFLAG | Total packets | Discarded packets |
| A | 0 | 80 | 0 |
| B | 0 | 80 | 0 |
| C | 0 | 80 | 0 |
| D | 0 | 80 | 0 |
| Mode M0 | |||
|---|---|---|---|
| Quadrant | BADHDUFLAG | Total packets | Discarded packets |
| A | 0 | 8543 | 1 |
| B | 0 | 8182 | 1 |
| C | 0 | 7894 | 1 |
| D | 0 | 18011 | 1 |
| Mode M9 | |||
|---|---|---|---|
| Quadrant | BADHDUFLAG | Total packets | Discarded packets |
| A | 0 | 15 | 0 |
| B | 0 | 15 | 0 |
| C | 0 | 15 | 0 |
| D | 0 | 15 | 0 |
| Quadrant | Total seconds | Saturated seconds | Saturation percentage |
|---|---|---|---|
| A | 3899 | 30 | 0.769428% |
| B | 3899 | 33 | 0.846371% |
| C | 3899 | 1 | 0.025648% |
| D | 3899 | 200 | 5.129520% |
Noise dominated data is calculated using 1-second bins in cleaned event files. If a bin has >2000 counts, and if more than 50% of those come from <1% of pixels, then it is considered to be noise-dominated and hence unusable.
| Quadrant | # 1 sec bins | Bins with >0 counts | Bins with >2000 counts | High rate bins dominated by noise | Noise dominated (total time) | Noise dominated (detector-on time) | Marked lightcurve |
|---|---|---|---|---|---|---|---|
| A | 5422 | 3900 | 14 | 14 | 0.26% | 0.36% | 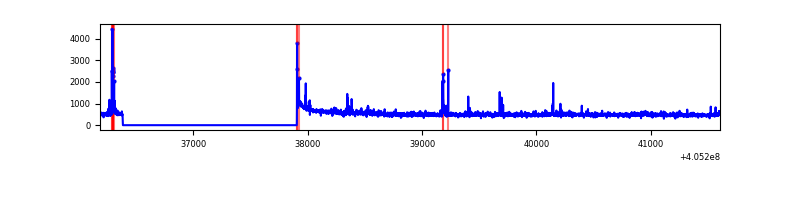 |
| B | 5422 | 3900 | 22 | 22 | 0.41% | 0.56% | 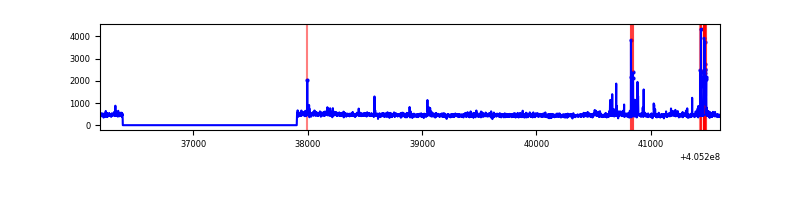 |
| C | 5422 | 3900 | 0 | 0 | 0.00% | 0.00% | 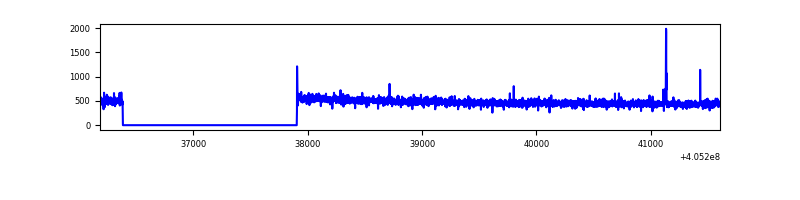 |
| D | 5422 | 3900 | 244 | 244 | 4.50% | 6.26% | 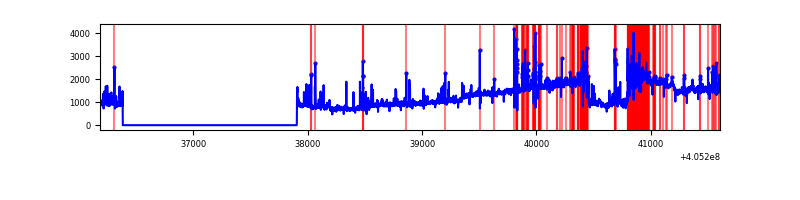 |
Top three noisy pixels from each quadrant. If the there are fewer than three noisy pixels in the level2.evt file, extra rows are filled as -1
| Pixel properties | Quadrant properties | ||||||
|---|---|---|---|---|---|---|---|
| Quadrant | DetID | PixID | Counts | Sigma | Mean | Median | Sigma |
| A | 10 | 83 | 247132 | 2738.68 | 437 | 428 | 90.1 |
| A | 9 | 143 | 63435 | 699.44 | 437 | 428 | 90.1 |
| A | 13 | 248 | 28744 | 314.34 | 437 | 428 | 90.1 |
| B | 0 | 183 | 76917 | 903.13 | 433 | 421 | 84.7 |
| B | 4 | 232 | 71957 | 844.57 | 433 | 421 | 84.7 |
| B | 0 | 213 | 13516 | 154.6 | 433 | 421 | 84.7 |
| C | 15 | 214 | 163189 | 1639.06 | 424 | 427 | 99.3 |
| C | 14 | 254 | 11329 | 109.79 | 424 | 427 | 99.3 |
| C | 15 | 159 | 3321 | 29.14 | 424 | 427 | 99.3 |
| D | 10 | 203 | 2956011 | 28212.51 | 418 | 405 | 104.8 |
| D | 2 | 153 | 153897 | 1465.15 | 418 | 405 | 104.8 |
| D | 12 | 235 | 127261 | 1210.89 | 418 | 405 | 104.8 |
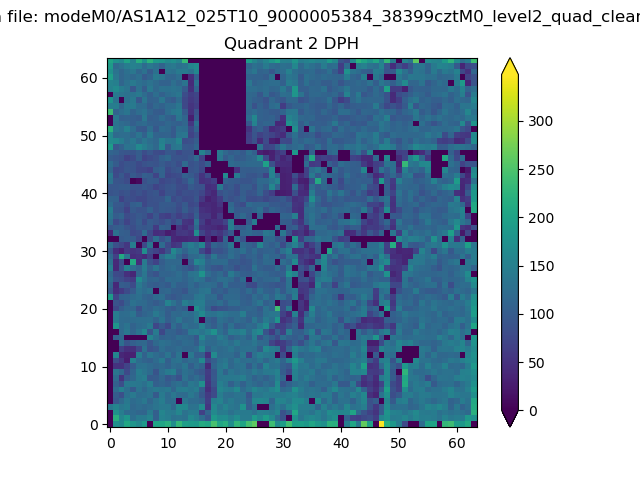
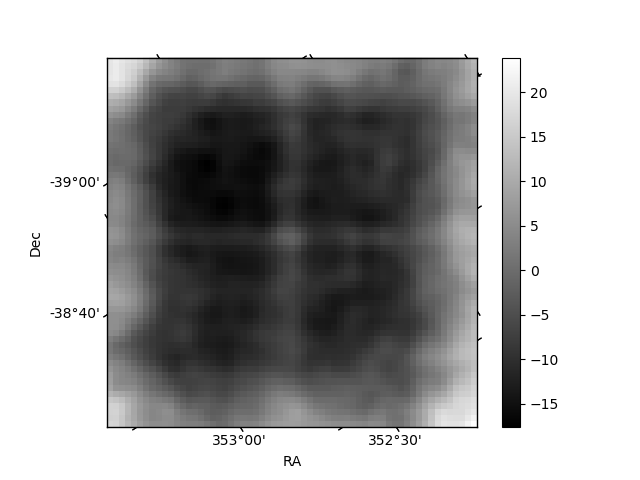
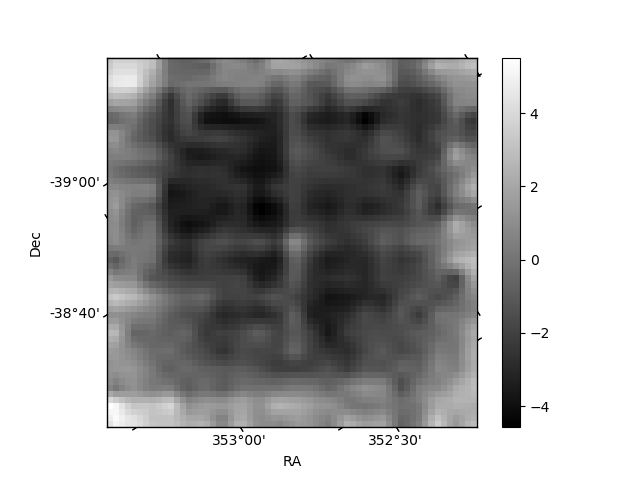
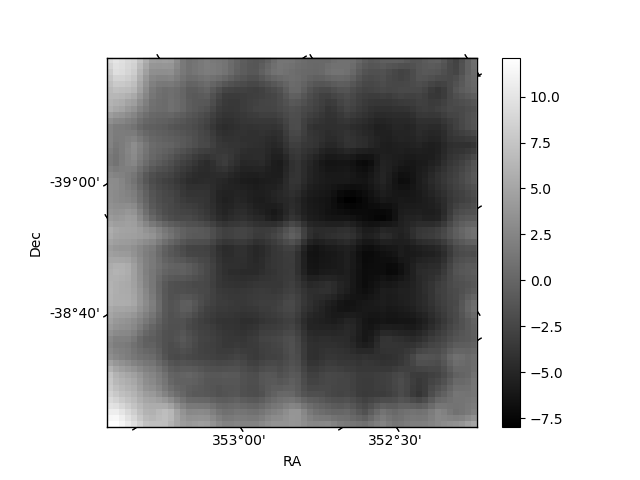
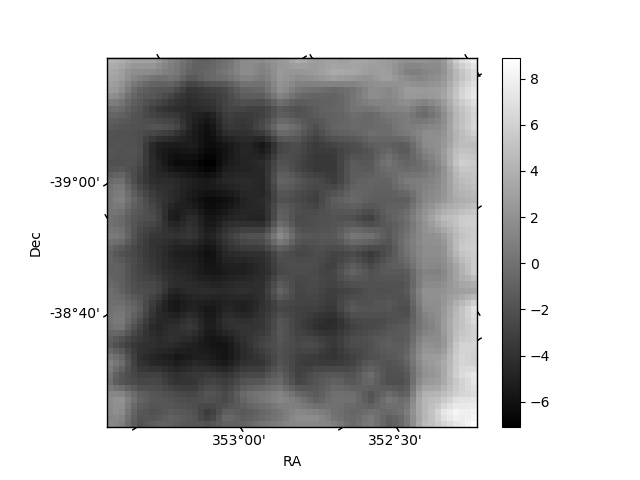
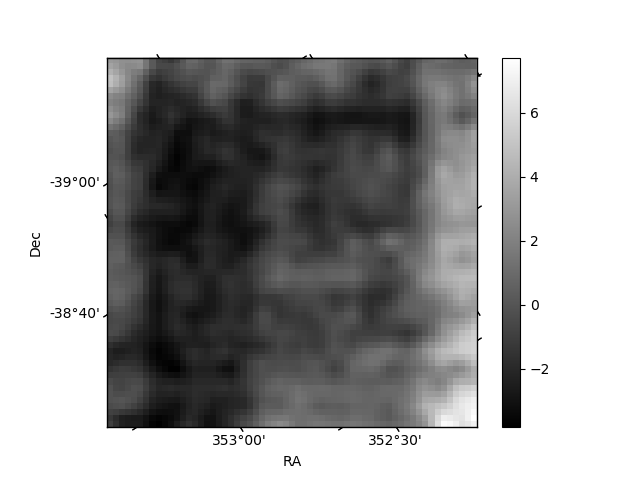
Histogram calculated using DETX and DETY for each event in the final _common_clean file
| Quadrant A | 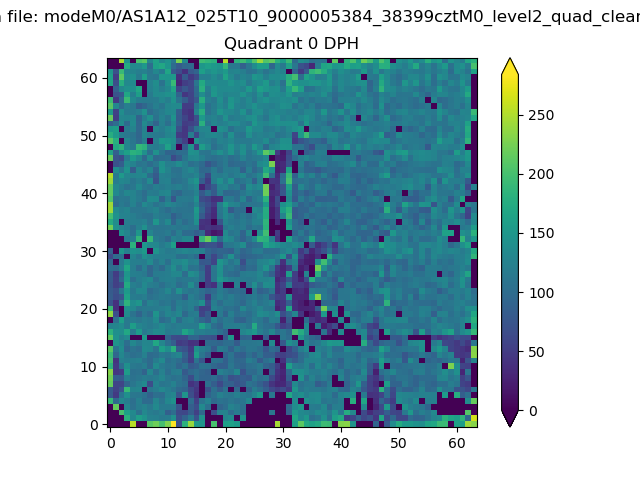 |
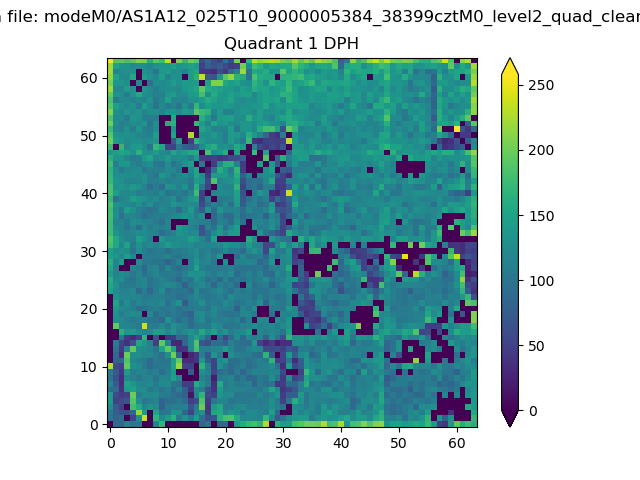 |
Quadrant B |
|---|---|---|---|
| Quadrant D | 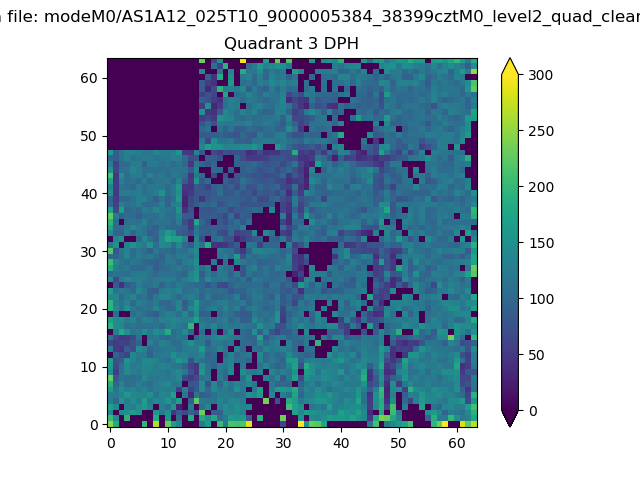 |
 |
Quadrant C |
| Plot type | Count rate plots | Images |
|---|---|---|
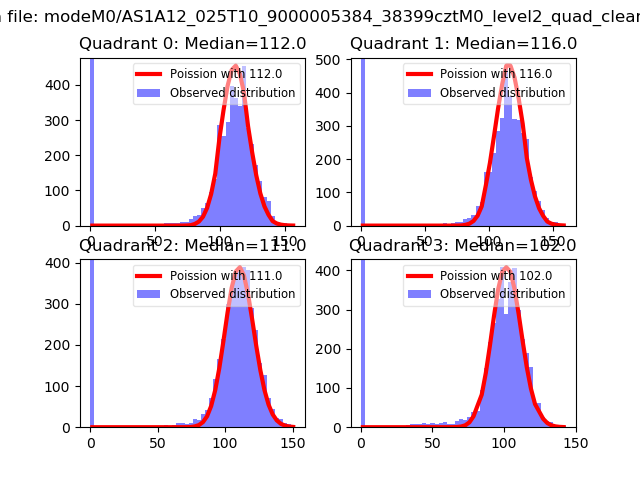
| Comparison with Poisson distribution Blue bars denote a histogram of data divided into 1 sec bins. Red curve is a Poisson curve with rate = median count rate of data. |
 |
 |
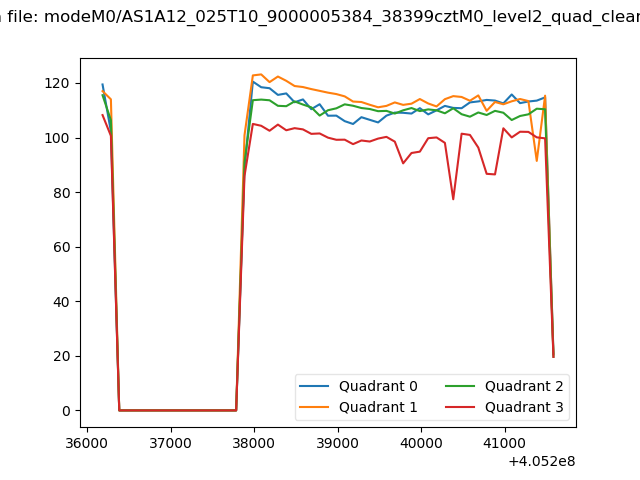
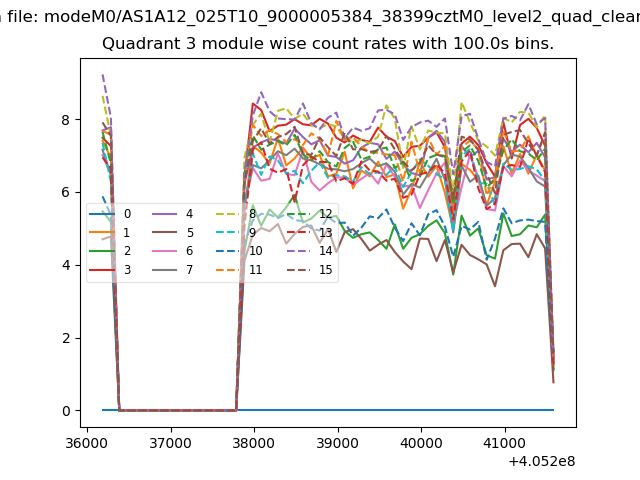
| Quadrant-wise count rates Data is divided into 100 sec bins |
 |
|
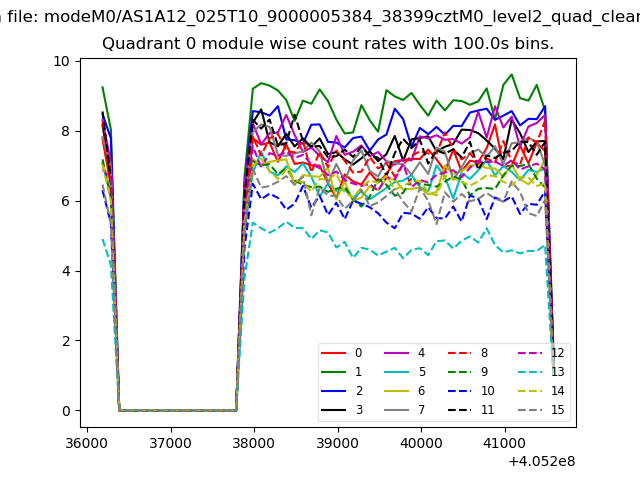
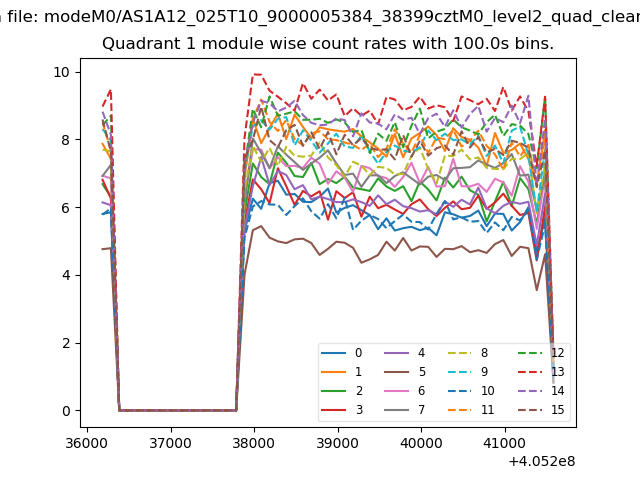
| Module-wise count rates for Quadrant A Data is divided into 100 sec bins |
 |
 |
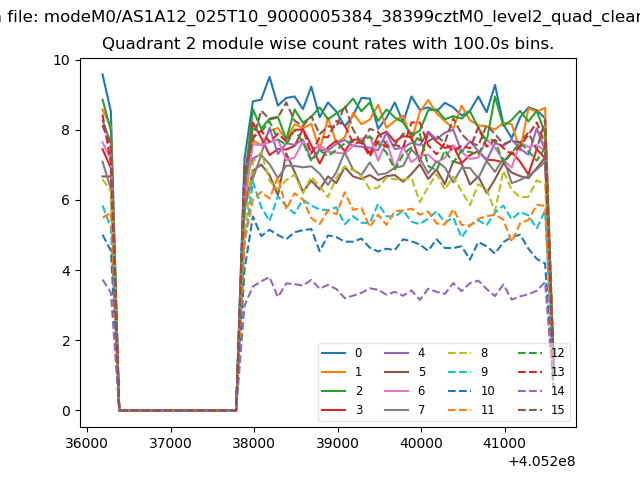
| Module-wise count rates for Quadrant B Data is divided into 100 sec bins |
 |
 |
| Module-wise count rates for Quadrant C Data is divided into 100 sec bins |
 |
 |
| Module-wise count rates for Quadrant D Data is divided into 100 sec bins |
 |
 |
| Parameter | Plot |
|---|---|
| CZT HV Monitor | 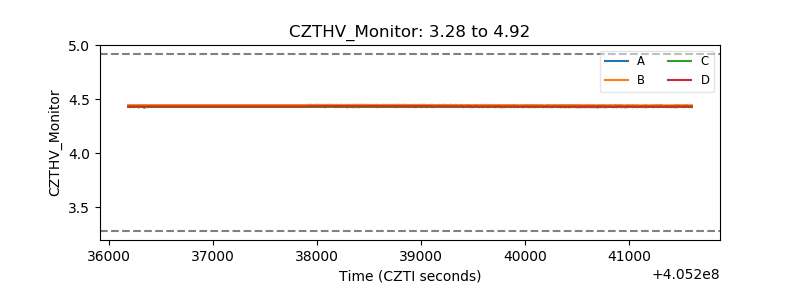 |
| D_VDD | 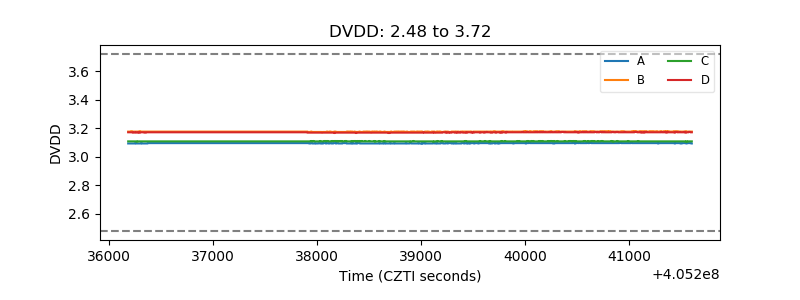 |
| Temperature 1 | 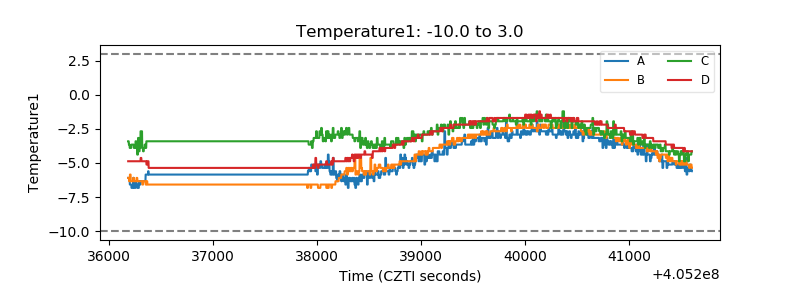 |
| Veto HV Monitor | 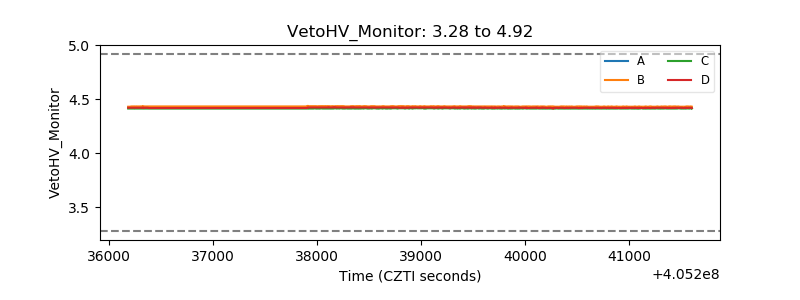 |
| Veto LLD | 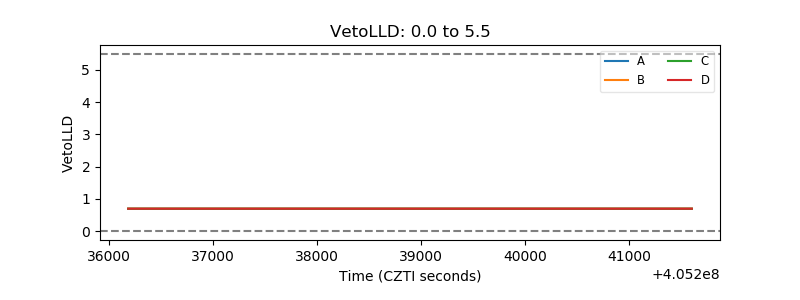 |
| Alpha Counter | 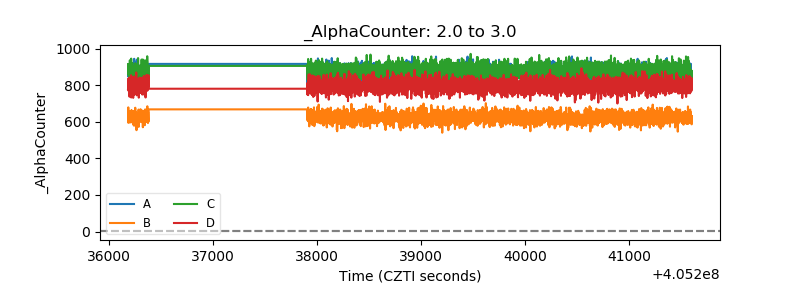 |
| _CPM_Rate | 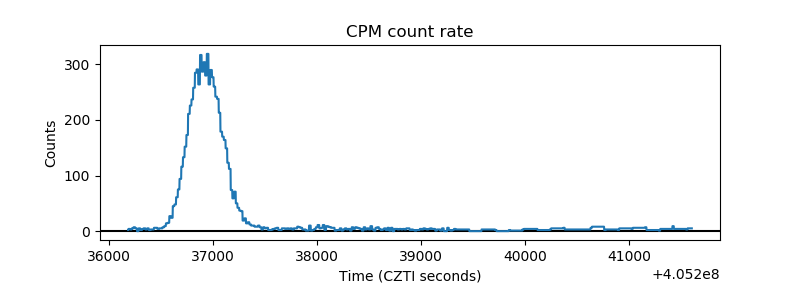 |
| CZT Counter | 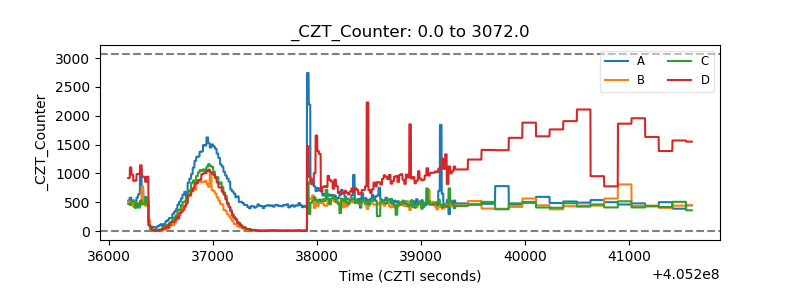 |
| +2.5 Volts monitor |  |
| +5 Volts monitor | 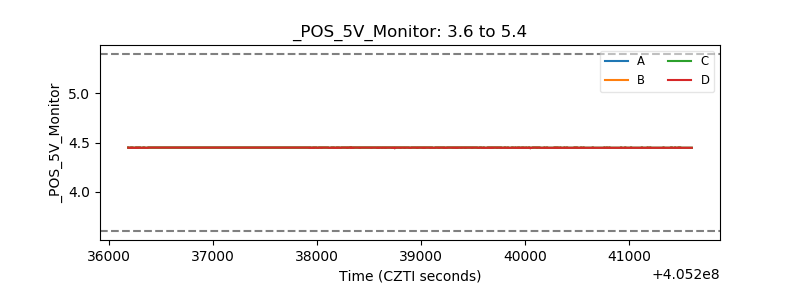 |
| _ROLL_ROT | 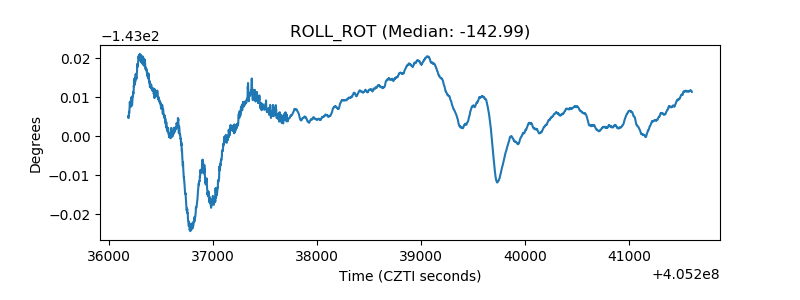 |
| _Roll_DEC | 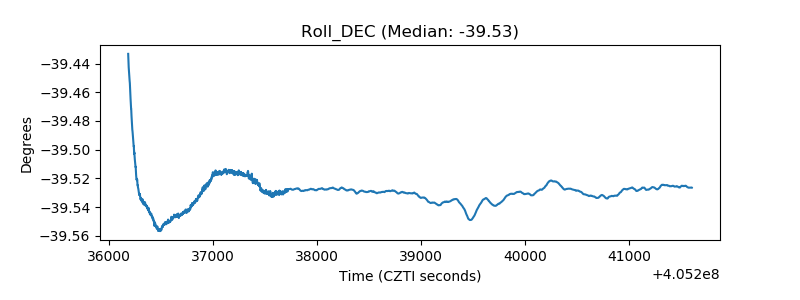 |
| _Roll_RA | 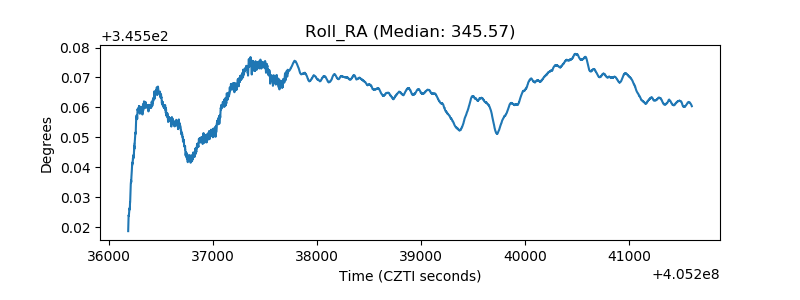 |
| Veto Counter | 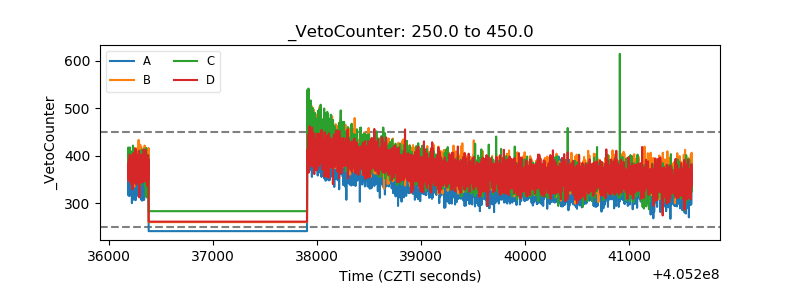 |