| Param | Original file | Final file |
|---|---|---|
| Filename | modeM0/AS1A12_018T01_9000005386_38399cztM0_level2.fits | modeM0/AS1A12_018T01_9000005386_38399cztM0_level2_quad_clean.evt |
| Size (bytes) | 67,628,160 | 16,557,120 |
| Size | 64.5 MB | 15.8 MB |
| Events in quadrant A | 572,190 | 112,635 |
| Events in quadrant B | 449,219 | 116,736 |
| Events in quadrant C | 464,110 | 108,321 |
| Events in quadrant D | 942,968 | 92,577 |
| Mode SS | |||
|---|---|---|---|
| Quadrant | BADHDUFLAG | Total packets | Discarded packets |
| A | 0 | 18 | 0 |
| B | 0 | 18 | 0 |
| C | 0 | 18 | 0 |
| D | 0 | 18 | 0 |
| Mode M9 | |||
|---|---|---|---|
| Quadrant | BADHDUFLAG | Total packets | Discarded packets |
| A | 0 | 13 | 0 |
| B | 0 | 13 | 0 |
| C | 0 | 13 | 0 |
| D | 0 | 13 | 0 |
| Mode M0 | |||
|---|---|---|---|
| Quadrant | BADHDUFLAG | Total packets | Discarded packets |
| A | 0 | 2308 | 2 |
| B | 0 | 1901 | 1 |
| C | 0 | 1923 | 1 |
| D | 0 | 3436 | 1 |
| Quadrant | Total seconds | Saturated seconds | Saturation percentage |
|---|---|---|---|
| A | 933 | 5 | 0.535906% |
| B | 933 | 4 | 0.428725% |
| C | 933 | 3 | 0.321543% |
| D | 885 | 45 | 5.084746% |
Noise dominated data is calculated using 1-second bins in cleaned event files. If a bin has >2000 counts, and if more than 50% of those come from <1% of pixels, then it is considered to be noise-dominated and hence unusable.
| Quadrant | # 1 sec bins | Bins with >0 counts | Bins with >2000 counts | High rate bins dominated by noise | Noise dominated (total time) | Noise dominated (detector-on time) | Marked lightcurve |
|---|---|---|---|---|---|---|---|
| A | 933 | 933 | 2 | 2 | 0.21% | 0.21% | 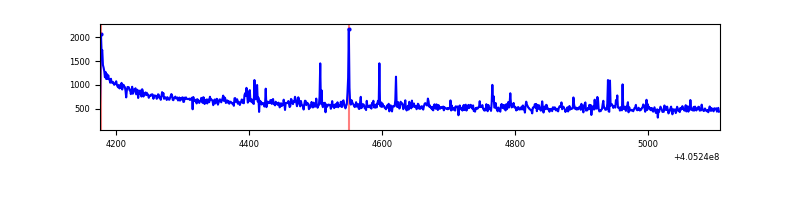 |
| B | 933 | 933 | 0 | 0 | 0.00% | 0.00% | 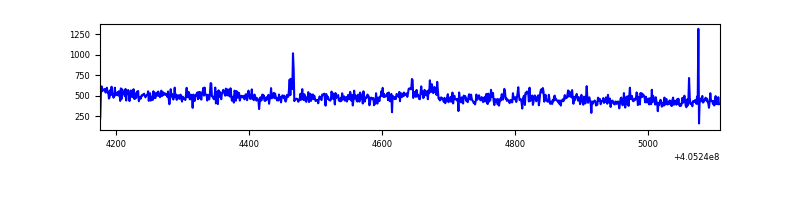 |
| C | 933 | 933 | 1 | 1 | 0.11% | 0.11% | 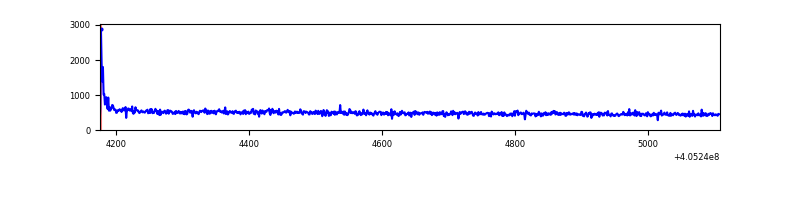 |
| D | 885 | 885 | 35 | 35 | 3.95% | 3.95% | 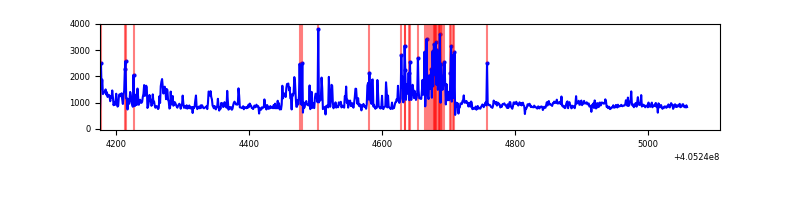 |
Top three noisy pixels from each quadrant. If the there are fewer than three noisy pixels in the level2.evt file, extra rows are filled as -1
| Pixel properties | Quadrant properties | ||||||
|---|---|---|---|---|---|---|---|
| Quadrant | DetID | PixID | Counts | Sigma | Mean | Median | Sigma |
| A | 10 | 83 | 116213 | 4778.79 | 111 | 109 | 24.3 |
| A | 9 | 143 | 17109 | 699.71 | 111 | 109 | 24.3 |
| A | 13 | 248 | 3801 | 151.96 | 111 | 109 | 24.3 |
| B | 0 | 189 | 11636 | 495.48 | 110 | 107 | 23.3 |
| B | 12 | 111 | 2737 | 113.03 | 110 | 107 | 23.3 |
| B | 11 | 111 | 2478 | 101.9 | 110 | 107 | 23.3 |
| C | 15 | 214 | 45929 | 1756.62 | 104 | 104 | 26.1 |
| C | 0 | 10 | 11112 | 421.97 | 104 | 104 | 26.1 |
| C | 15 | 159 | 908 | 30.82 | 104 | 104 | 26.1 |
| D | 10 | 203 | 308202 | 12217.45 | 97 | 94 | 25.2 |
| D | 2 | 250 | 131407 | 5206.97 | 97 | 94 | 25.2 |
| D | 2 | 16 | 37598 | 1487.15 | 97 | 94 | 25.2 |
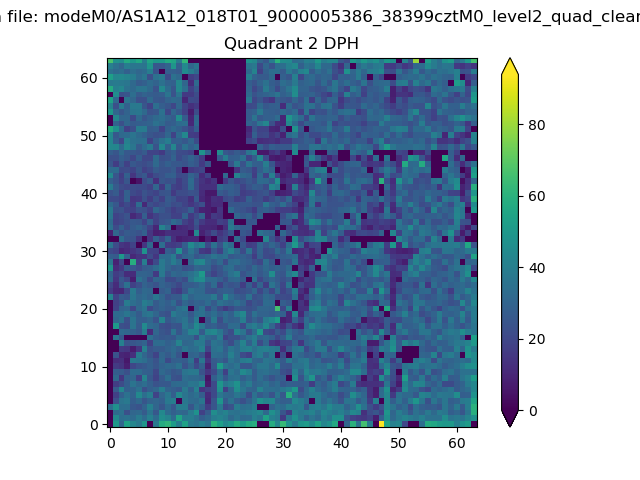
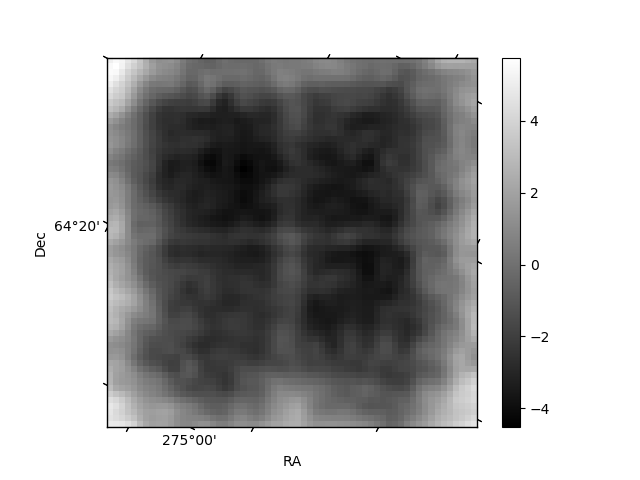
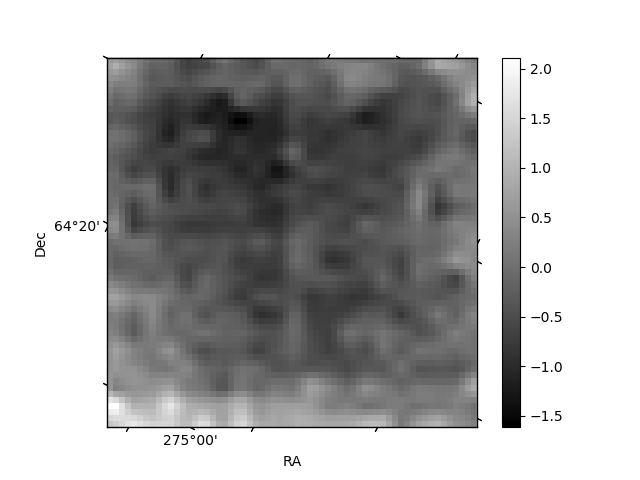
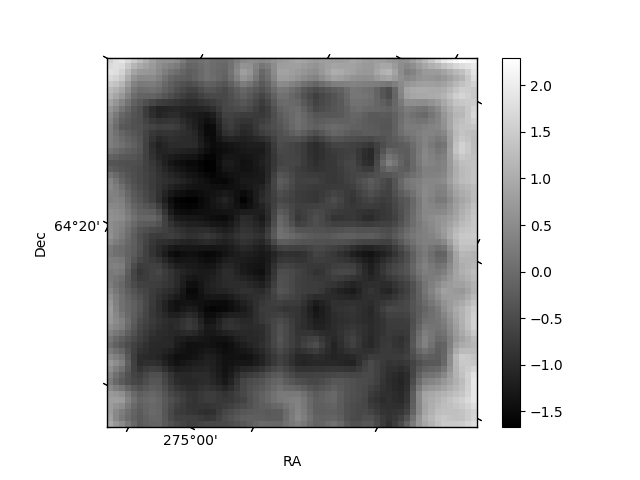
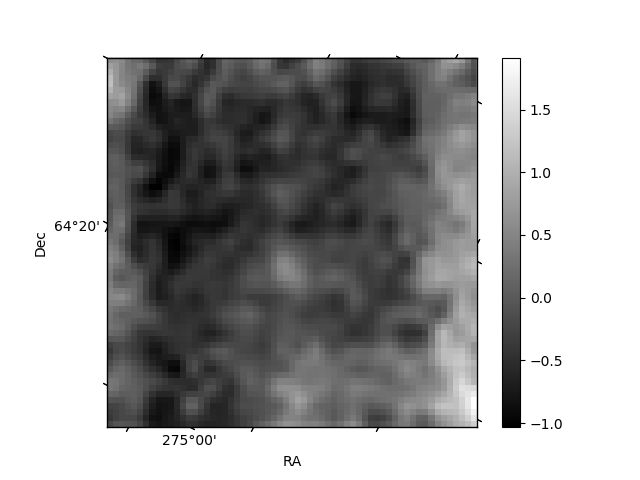
Histogram calculated using DETX and DETY for each event in the final _common_clean file
| Quadrant A | 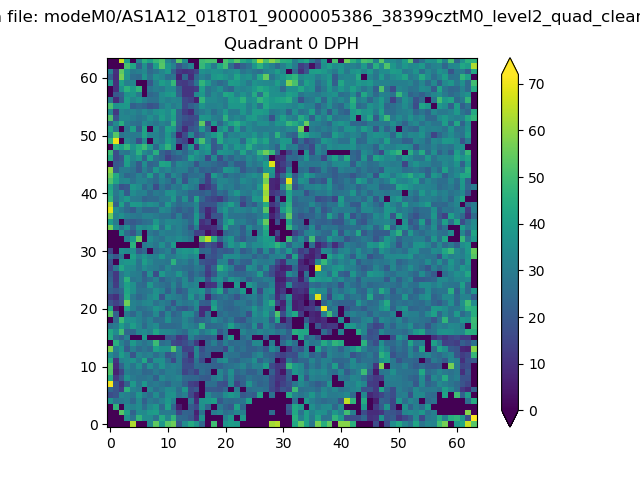 |
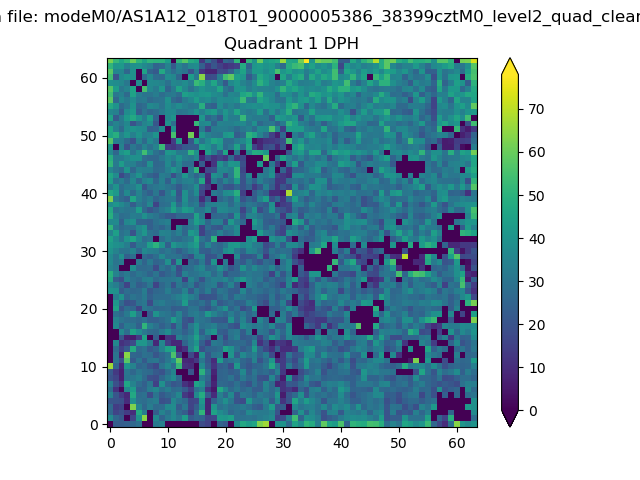 |
Quadrant B |
|---|---|---|---|
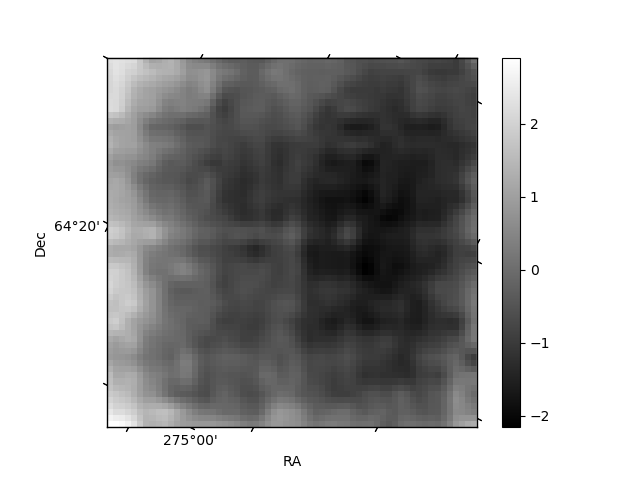
| Quadrant D | 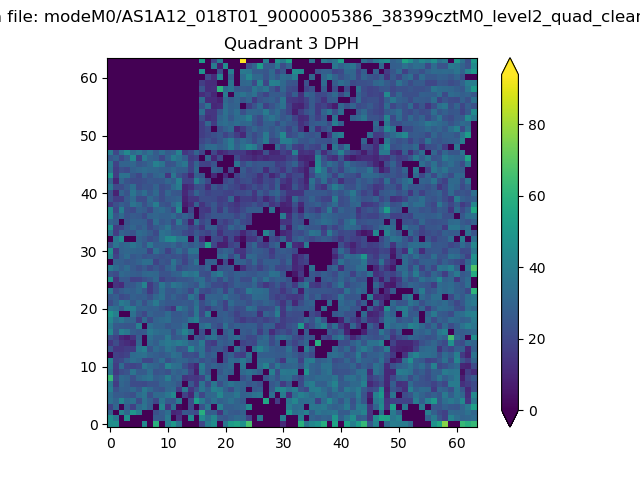 |
 |
Quadrant C |
| Plot type | Count rate plots | Images |
|---|---|---|
| Comparison with Poisson distribution Blue bars denote a histogram of data divided into 1 sec bins. Red curve is a Poisson curve with rate = median count rate of data. |
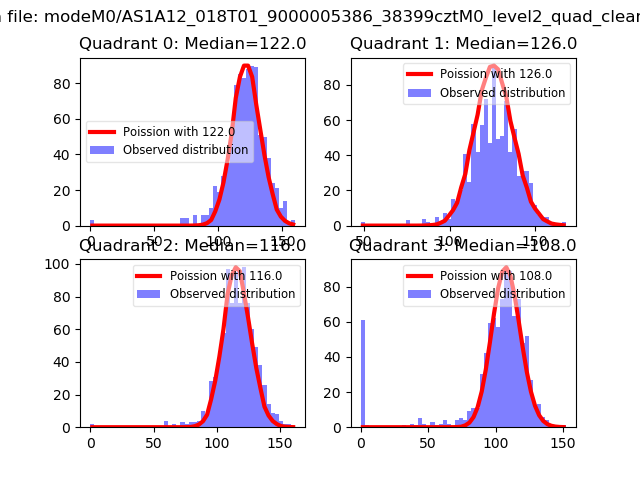 |
 |
| Quadrant-wise count rates Data is divided into 100 sec bins |
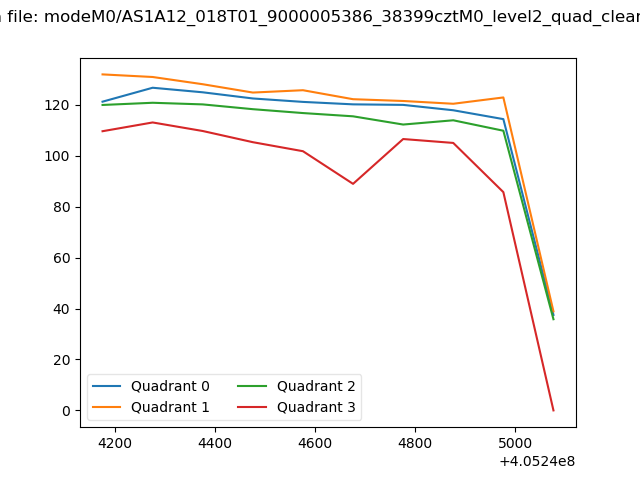 |
|
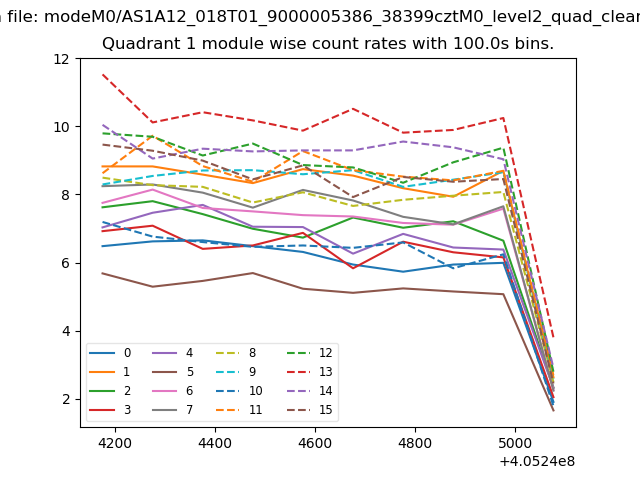
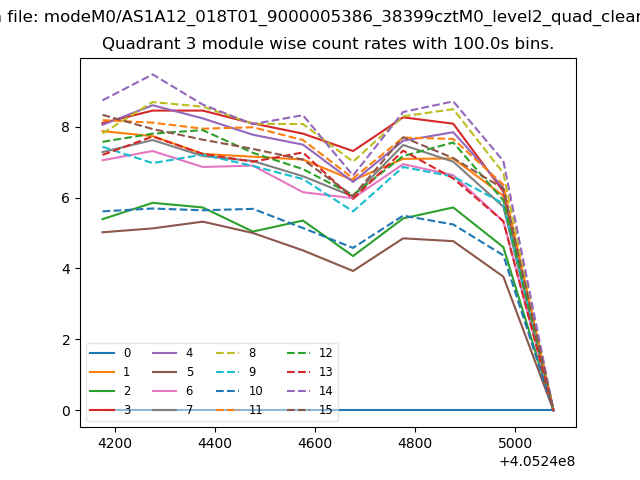
| Module-wise count rates for Quadrant A Data is divided into 100 sec bins |
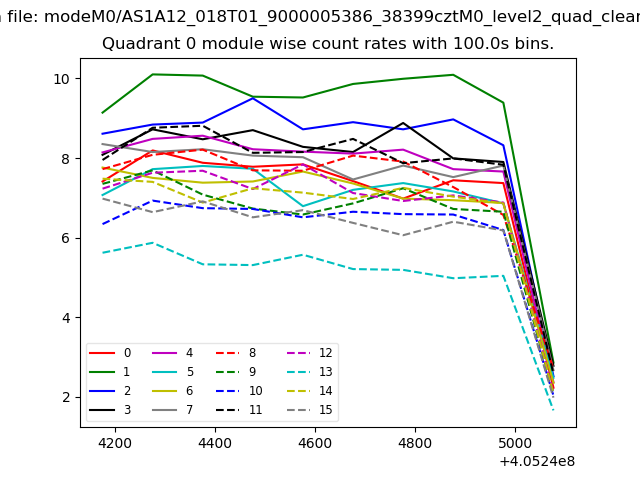 |
 |
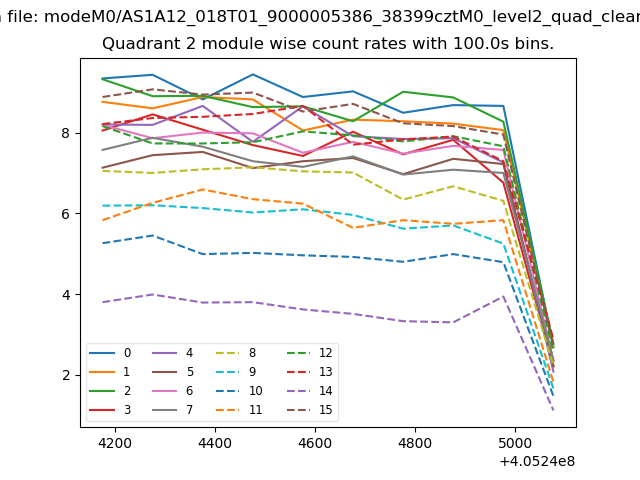
| Module-wise count rates for Quadrant B Data is divided into 100 sec bins |
 |
 |
| Module-wise count rates for Quadrant C Data is divided into 100 sec bins |
 |
 |
| Module-wise count rates for Quadrant D Data is divided into 100 sec bins |
 |
 |
| Parameter | Plot |
|---|---|
| CZT HV Monitor | 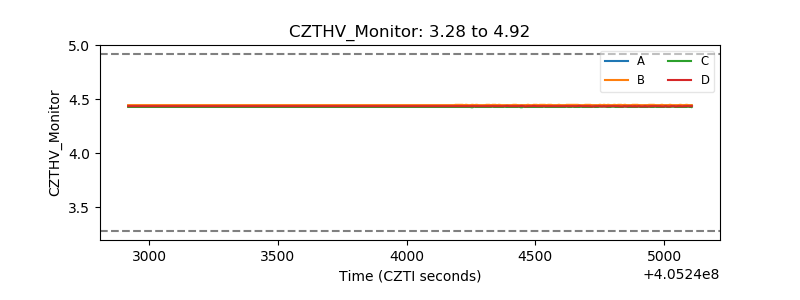 |
| D_VDD | 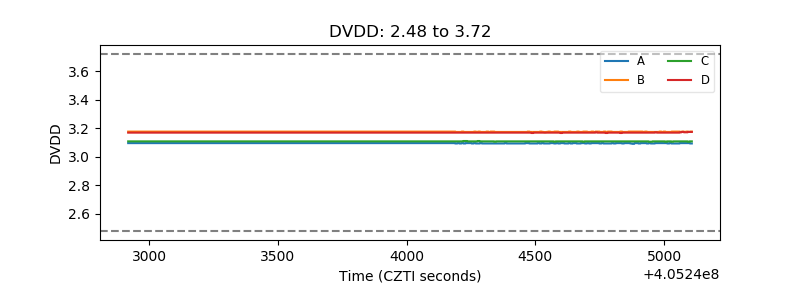 |
| Temperature 1 | 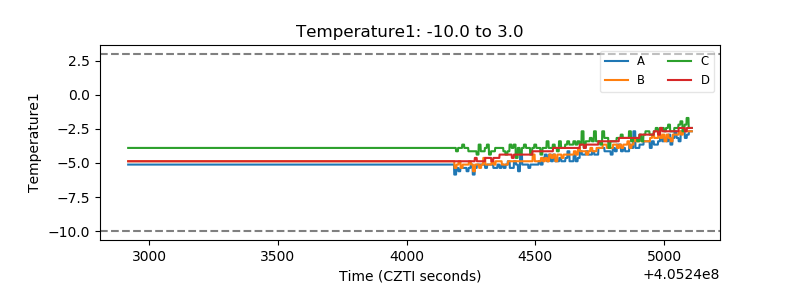 |
| Veto HV Monitor | 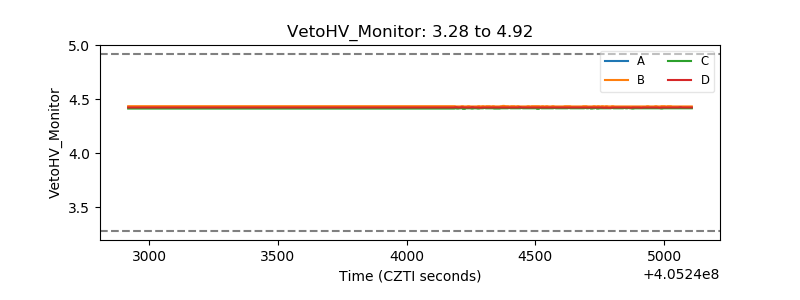 |
| Veto LLD | 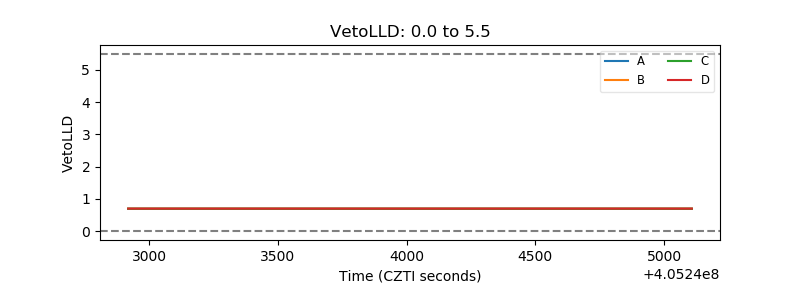 |
| Alpha Counter | 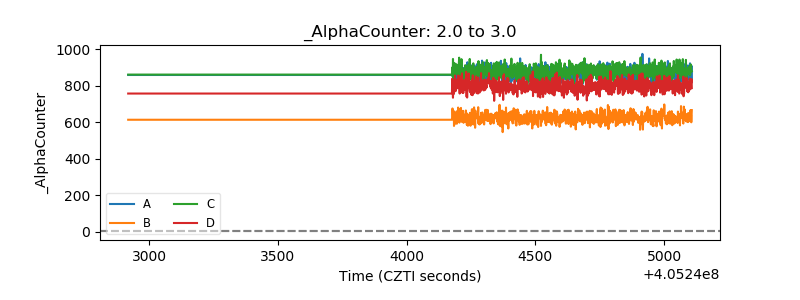 |
| _CPM_Rate |  |
| CZT Counter | 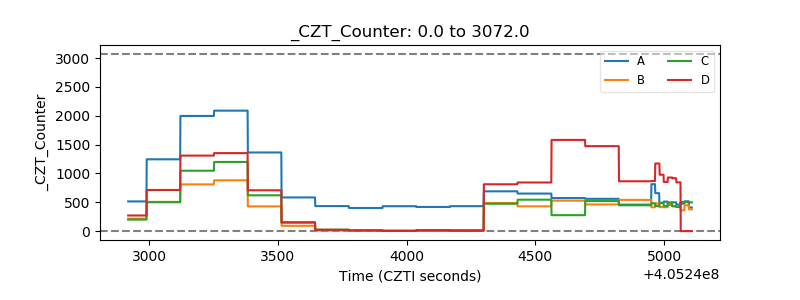 |
| +2.5 Volts monitor | 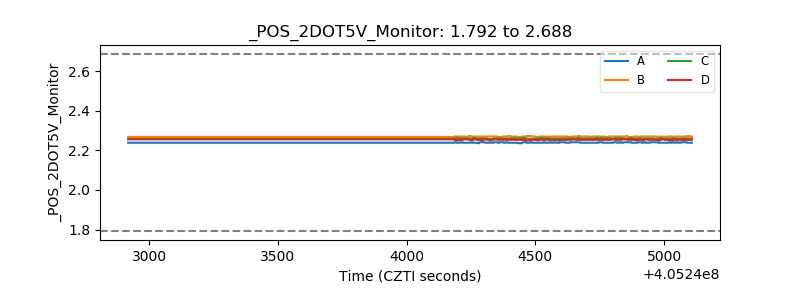 |
| +5 Volts monitor | 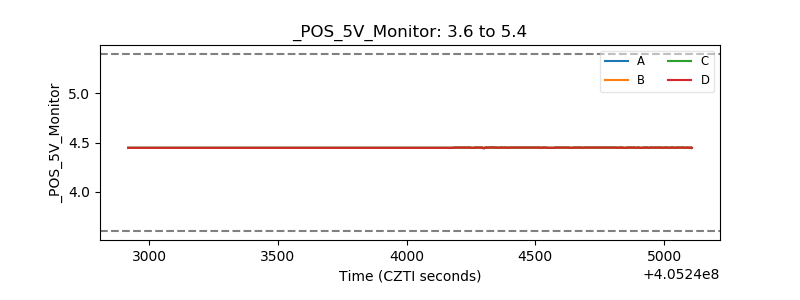 |
| _ROLL_ROT | 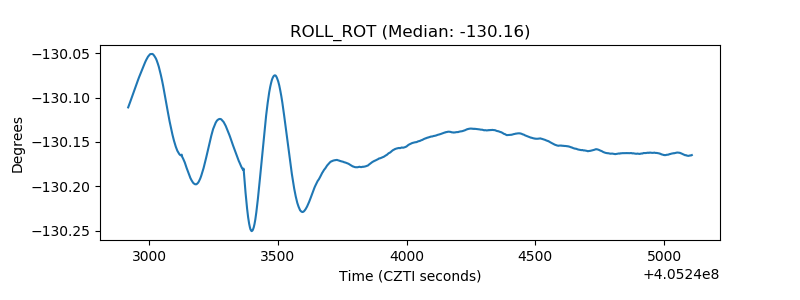 |
| _Roll_DEC | 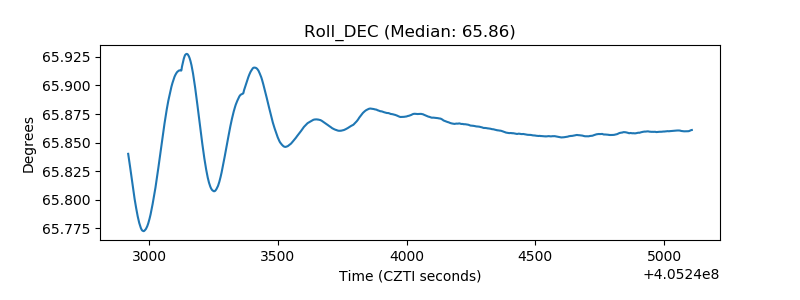 |
| _Roll_RA | 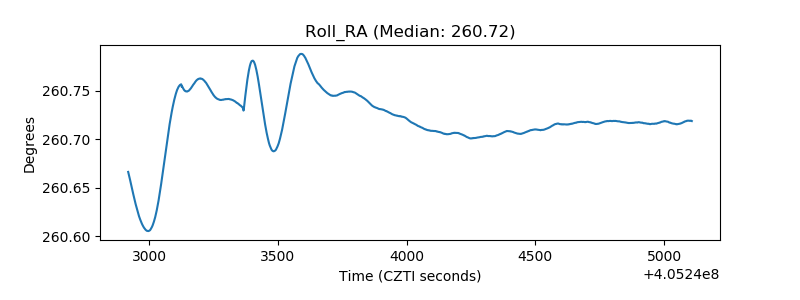 |
| Veto Counter | 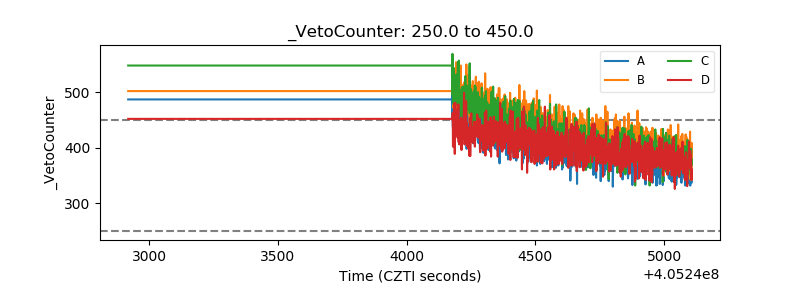 |