| Param | Original file | Final file |
|---|---|---|
| Filename | modeM0/AS1A12_018T01_9000005386_38401cztM0_level2.fits | modeM0/AS1A12_018T01_9000005386_38401cztM0_level2_quad_clean.evt |
| Size (bytes) | 328,645,440 | 93,150,720 |
| Size | 313.4 MB | 88.8 MB |
| Events in quadrant A | 2,874,001 | 639,829 |
| Events in quadrant B | 2,690,302 | 653,593 |
| Events in quadrant C | 2,562,537 | 606,758 |
| Events in quadrant D | 3,624,097 | 547,405 |
| Mode SS | |||
|---|---|---|---|
| Quadrant | BADHDUFLAG | Total packets | Discarded packets |
| A | 0 | 110 | 0 |
| B | 0 | 110 | 0 |
| C | 0 | 110 | 0 |
| D | 0 | 110 | 0 |
| Mode M9 | |||
|---|---|---|---|
| Quadrant | BADHDUFLAG | Total packets | Discarded packets |
| A | 0 | 22 | 0 |
| B | 0 | 22 | 0 |
| C | 0 | 22 | 0 |
| D | 0 | 23 | 0 |
| Mode M0 | |||
|---|---|---|---|
| Quadrant | BADHDUFLAG | Total packets | Discarded packets |
| A | 0 | 11843 | 3 |
| B | 0 | 11420 | 2 |
| C | 0 | 10909 | 2 |
| D | 0 | 14243 | 2 |
| Quadrant | Total seconds | Saturated seconds | Saturation percentage |
|---|---|---|---|
| A | 5347 | 15 | 0.280531% |
| B | 5347 | 19 | 0.355339% |
| C | 5347 | 6 | 0.112212% |
| D | 5249 | 104 | 1.981330% |
Noise dominated data is calculated using 1-second bins in cleaned event files. If a bin has >2000 counts, and if more than 50% of those come from <1% of pixels, then it is considered to be noise-dominated and hence unusable.
| Quadrant | # 1 sec bins | Bins with >0 counts | Bins with >2000 counts | High rate bins dominated by noise | Noise dominated (total time) | Noise dominated (detector-on time) | Marked lightcurve |
|---|---|---|---|---|---|---|---|
| A | 7110 | 5348 | 9 | 9 | 0.13% | 0.17% | 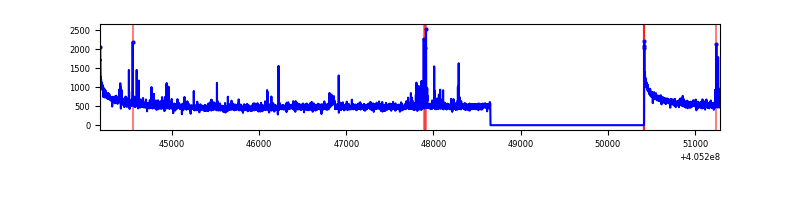 |
| B | 7110 | 5348 | 6 | 6 | 0.08% | 0.11% | 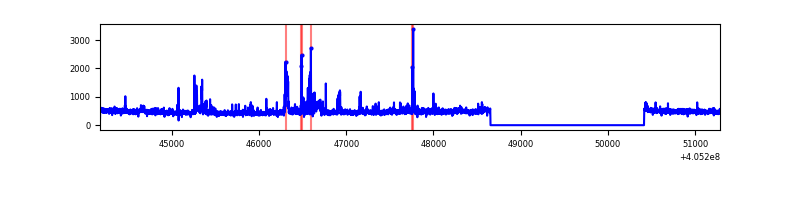 |
| C | 7110 | 5348 | 1 | 1 | 0.01% | 0.02% | 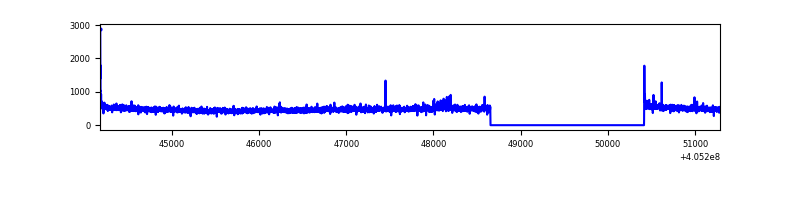 |
| D | 7110 | 5251 | 79 | 79 | 1.11% | 1.50% | 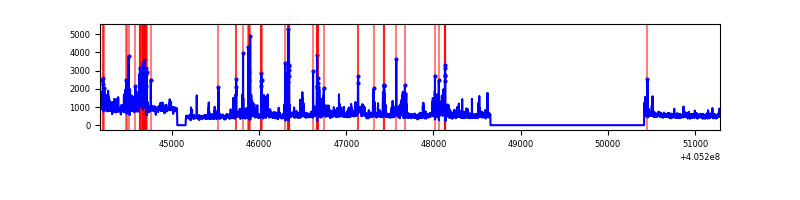 |
Top three noisy pixels from each quadrant. If the there are fewer than three noisy pixels in the level2.evt file, extra rows are filled as -1
| Pixel properties | Quadrant properties | ||||||
|---|---|---|---|---|---|---|---|
| Quadrant | DetID | PixID | Counts | Sigma | Mean | Median | Sigma |
| A | 10 | 83 | 403377 | 3330.7 | 609 | 599 | 120.9 |
| A | 9 | 143 | 54052 | 442.02 | 609 | 599 | 120.9 |
| A | 13 | 248 | 22022 | 177.15 | 609 | 599 | 120.9 |
| B | 0 | 183 | 234726 | 2033.16 | 603 | 587 | 115.2 |
| B | 0 | 155 | 30505 | 259.8 | 603 | 587 | 115.2 |
| B | 8 | 3 | 16769 | 140.52 | 603 | 587 | 115.2 |
| C | 15 | 214 | 229422 | 1677.78 | 585 | 588 | 136.4 |
| C | 8 | 79 | 18862 | 133.98 | 585 | 588 | 136.4 |
| C | 0 | 10 | 17683 | 125.34 | 585 | 588 | 136.4 |
| D | 2 | 250 | 327790 | 2368.01 | 574 | 558 | 138.2 |
| D | 10 | 203 | 308449 | 2228.05 | 574 | 558 | 138.2 |
| D | 2 | 153 | 231016 | 1667.71 | 574 | 558 | 138.2 |
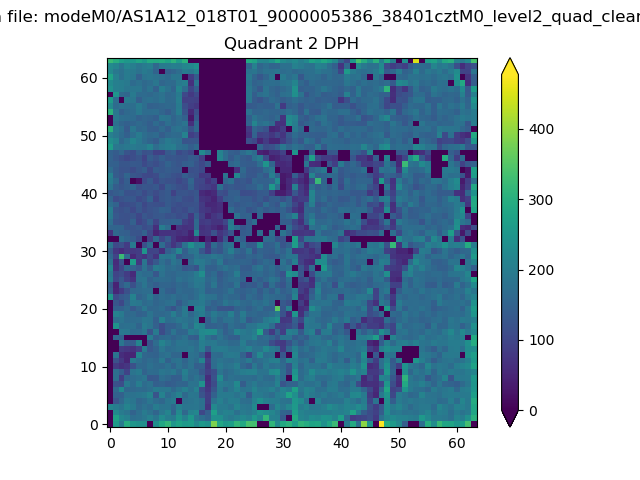
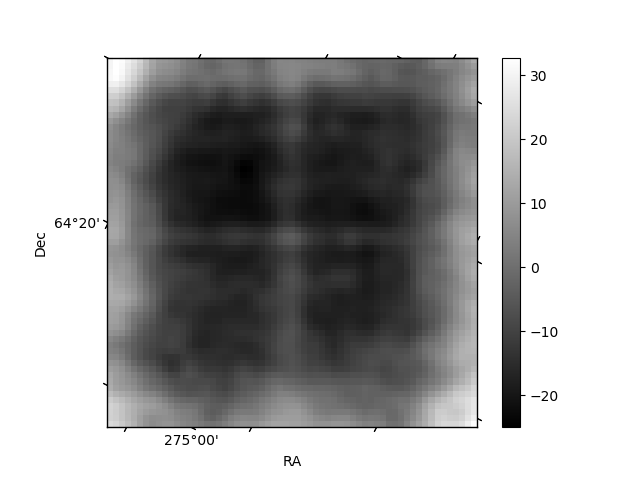
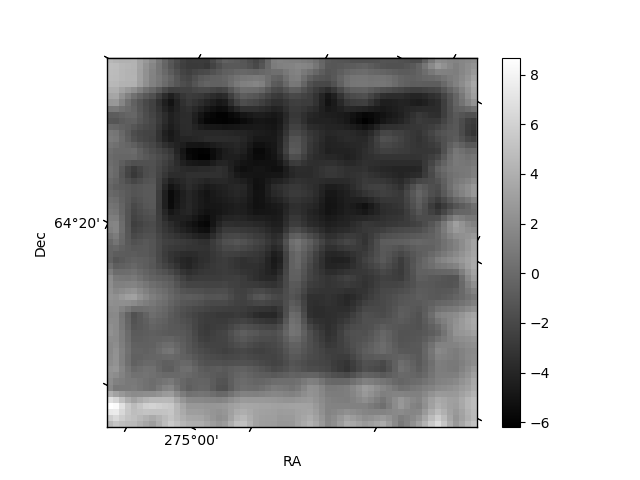
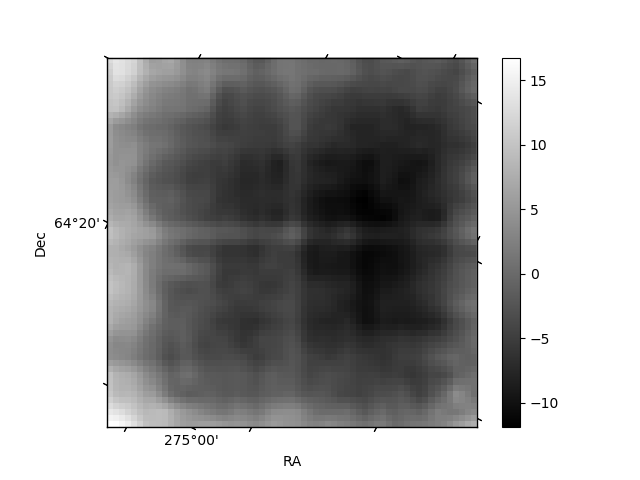
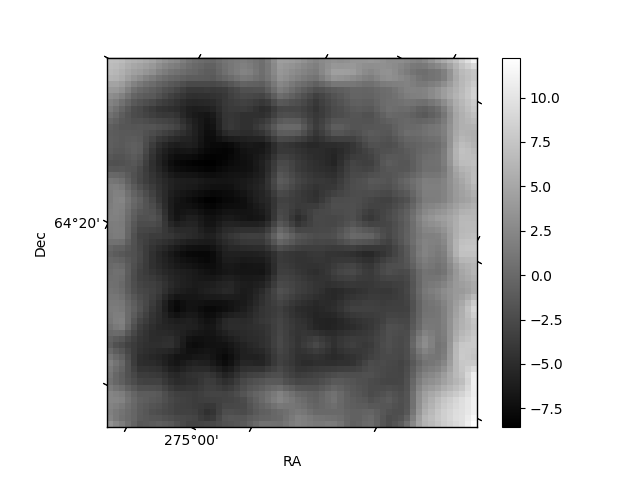
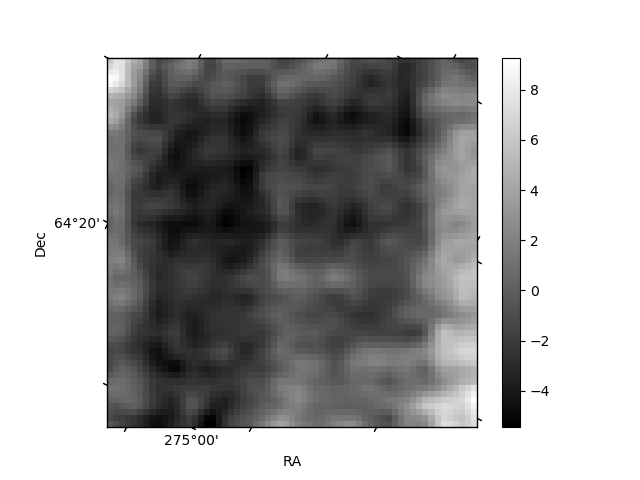
Histogram calculated using DETX and DETY for each event in the final _common_clean file
| Quadrant A | 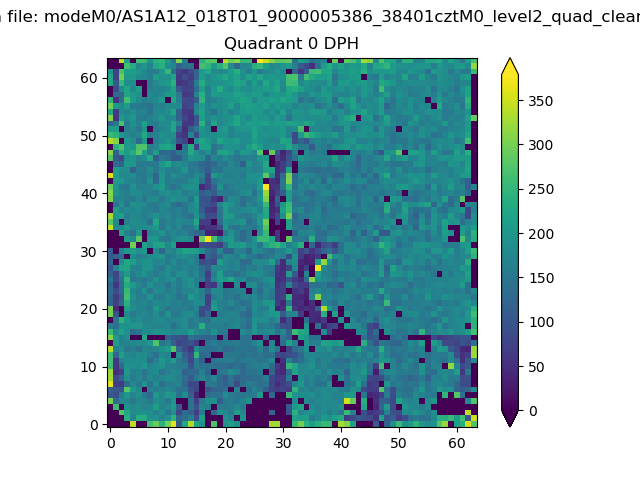 |
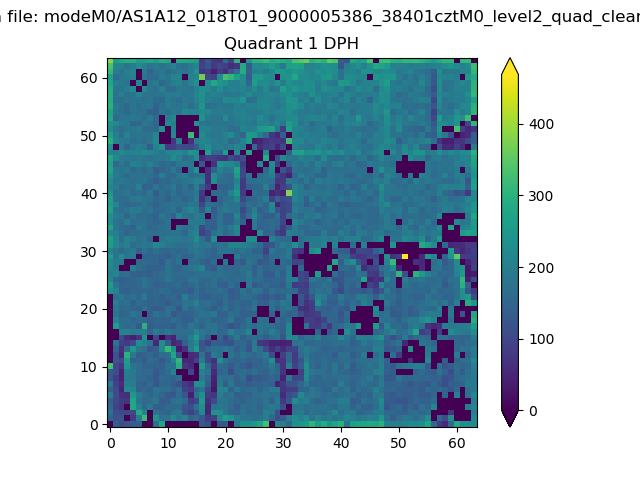 |
Quadrant B |
|---|---|---|---|
| Quadrant D | 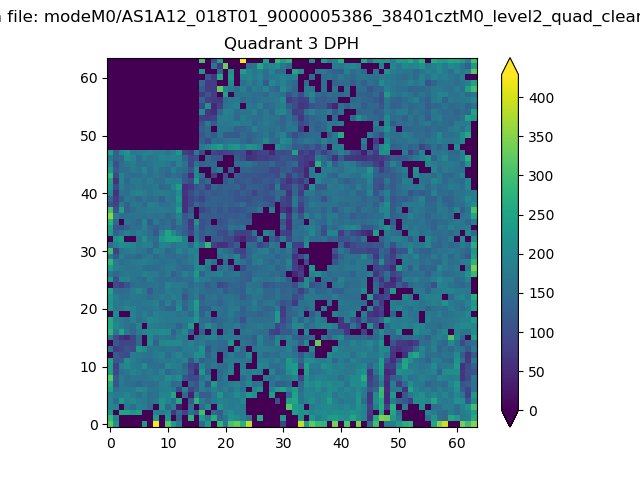 |
 |
Quadrant C |
| Plot type | Count rate plots | Images |
|---|---|---|
| Comparison with Poisson distribution Blue bars denote a histogram of data divided into 1 sec bins. Red curve is a Poisson curve with rate = median count rate of data. |
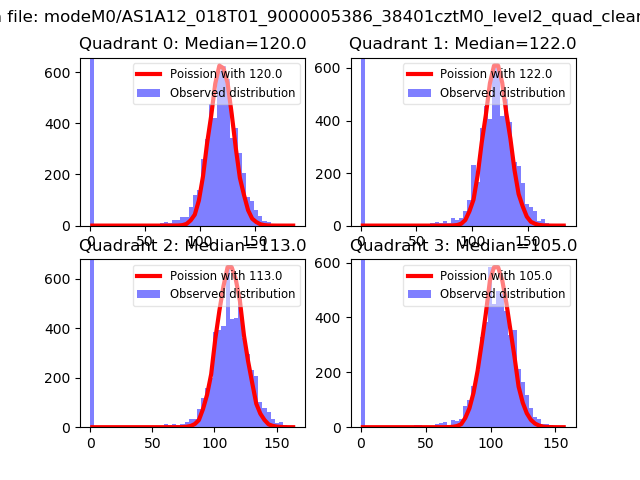 |
 |
| Quadrant-wise count rates Data is divided into 100 sec bins |
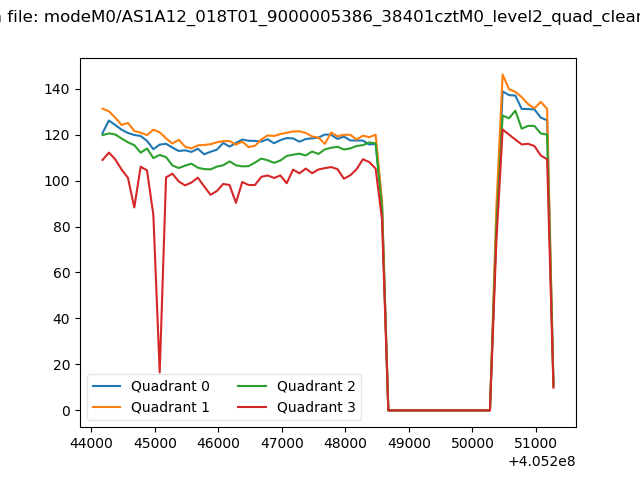 |
|
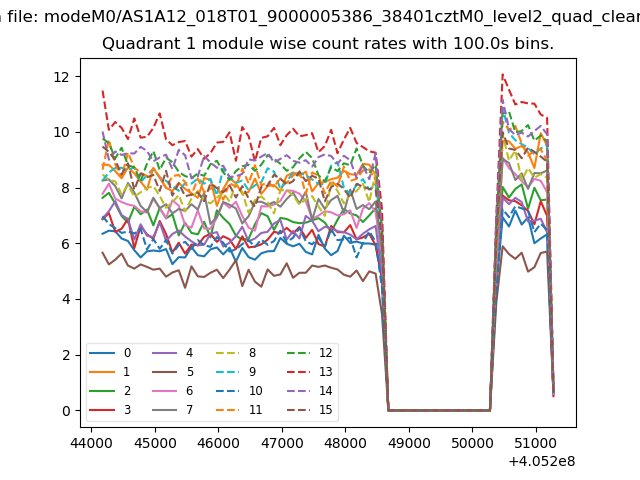
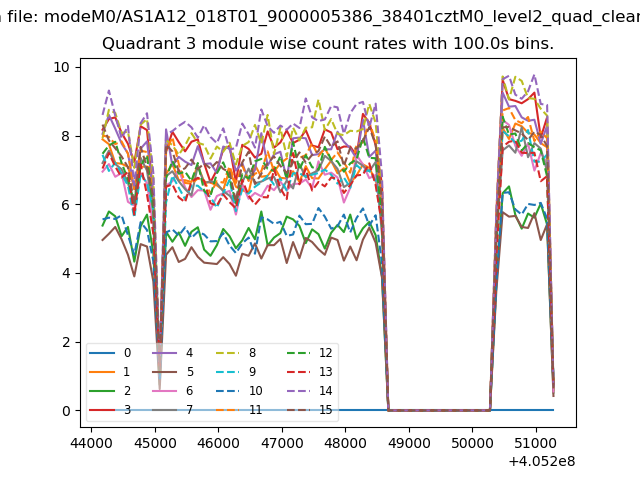
| Module-wise count rates for Quadrant A Data is divided into 100 sec bins |
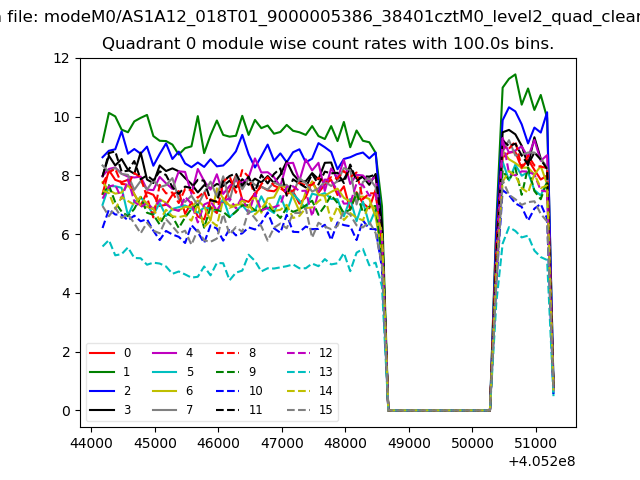 |
 |
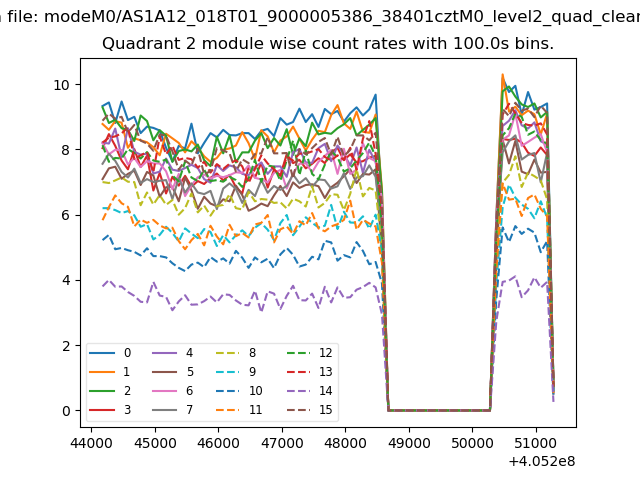
| Module-wise count rates for Quadrant B Data is divided into 100 sec bins |
 |
 |
| Module-wise count rates for Quadrant C Data is divided into 100 sec bins |
 |
 |
| Module-wise count rates for Quadrant D Data is divided into 100 sec bins |
 |
 |
| Parameter | Plot |
|---|---|
| CZT HV Monitor | 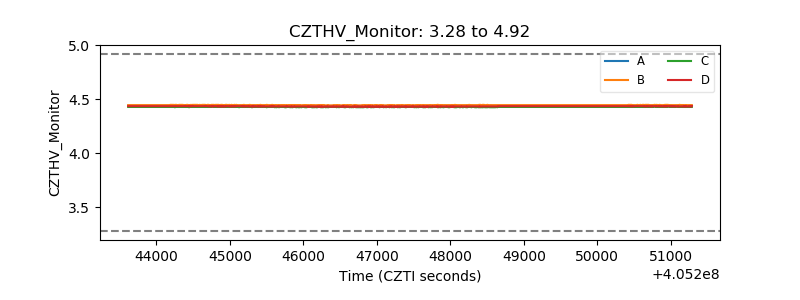 |
| D_VDD | 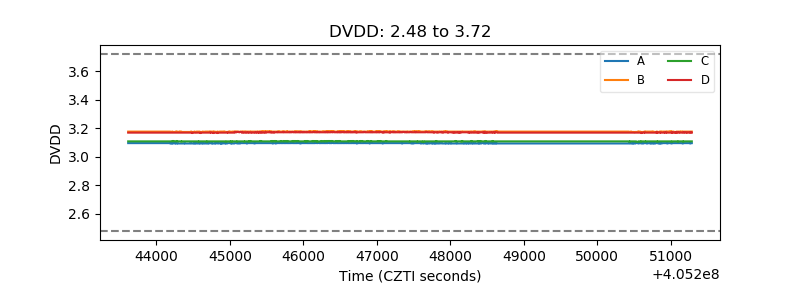 |
| Temperature 1 | 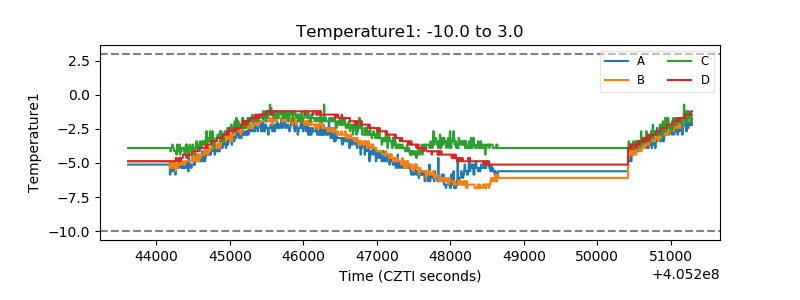 |
| Veto HV Monitor | 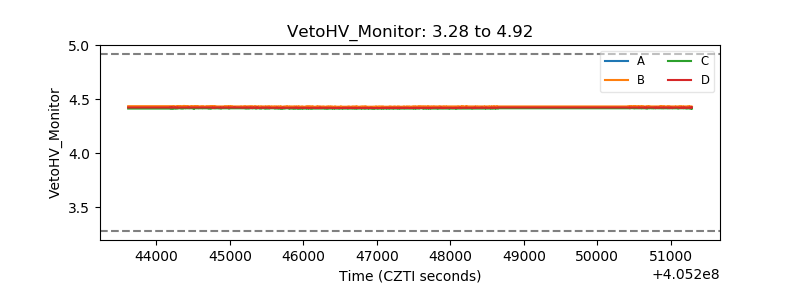 |
| Veto LLD | 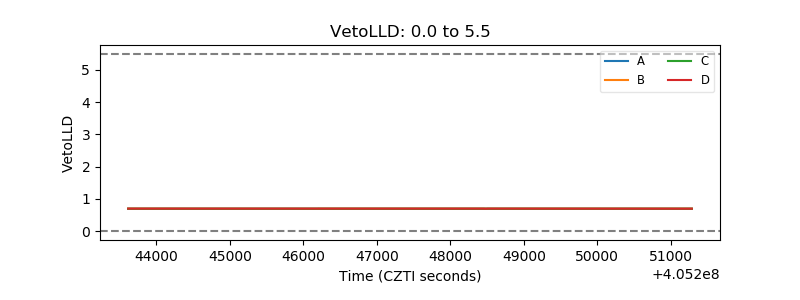 |
| Alpha Counter | 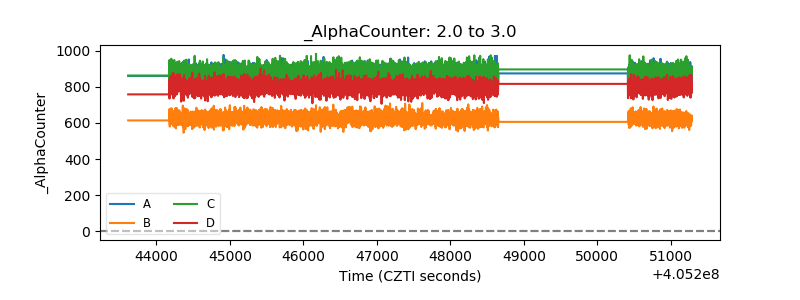 |
| _CPM_Rate | 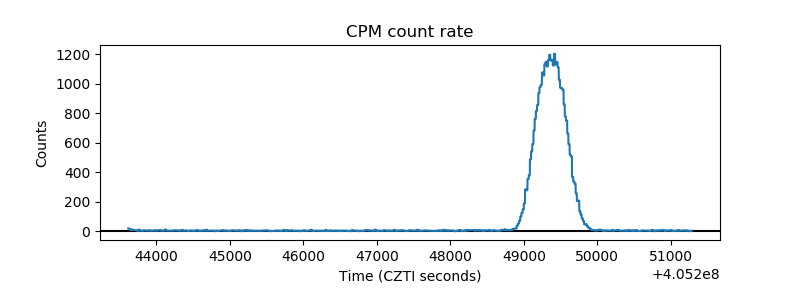 |
| CZT Counter | 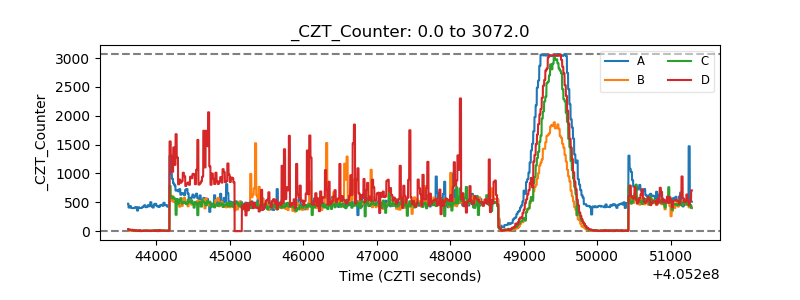 |
| +2.5 Volts monitor | 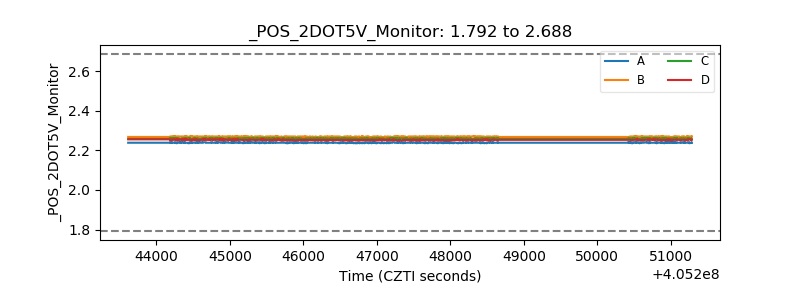 |
| +5 Volts monitor | 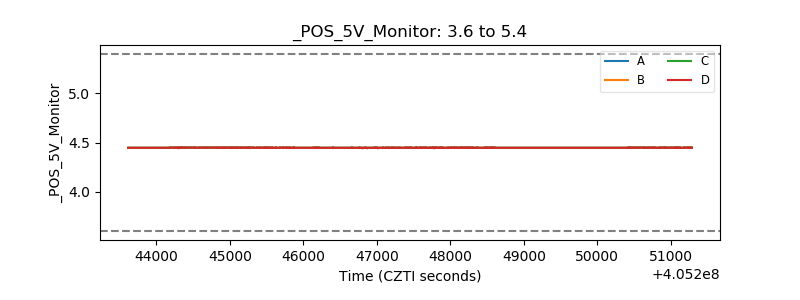 |
| _ROLL_ROT | 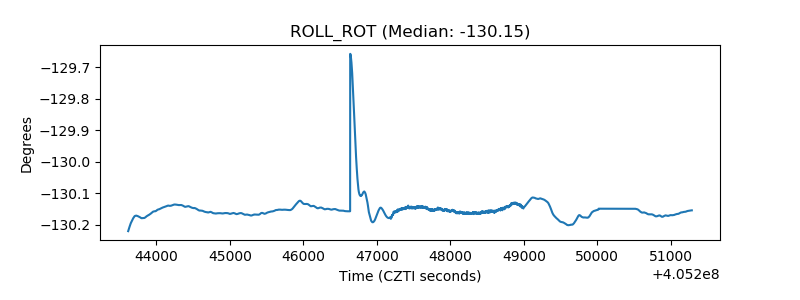 |
| _Roll_DEC | 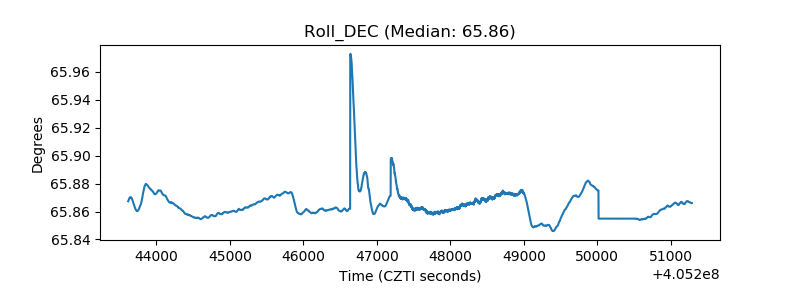 |
| _Roll_RA | 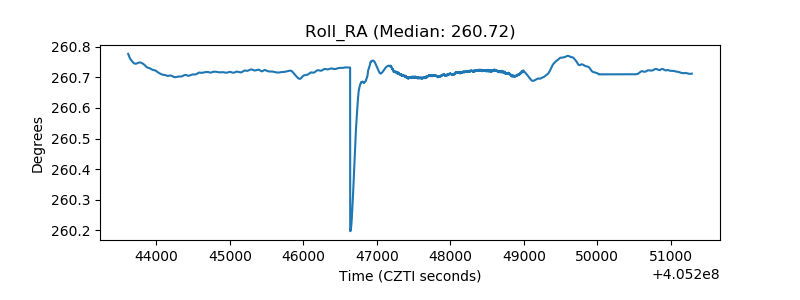 |
| Veto Counter | 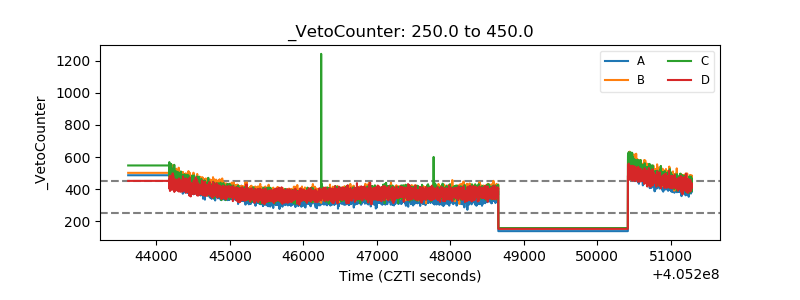 |