| Param | Original file | Final file |
|---|---|---|
| Filename | modeM0/AS1A12_018T01_9000005386_38402cztM0_level2.fits | modeM0/AS1A12_018T01_9000005386_38402cztM0_level2_quad_clean.evt |
| Size (bytes) | 336,504,960 | 91,681,920 |
| Size | 320.9 MB | 87.4 MB |
| Events in quadrant A | 3,044,584 | 633,652 |
| Events in quadrant B | 2,501,284 | 647,528 |
| Events in quadrant C | 2,473,475 | 604,136 |
| Events in quadrant D | 4,040,473 | 534,088 |
| Mode SS | |||
|---|---|---|---|
| Quadrant | BADHDUFLAG | Total packets | Discarded packets |
| A | 0 | 104 | 0 |
| B | 0 | 104 | 0 |
| C | 0 | 104 | 0 |
| D | 0 | 104 | 0 |
| Mode M9 | |||
|---|---|---|---|
| Quadrant | BADHDUFLAG | Total packets | Discarded packets |
| A | 0 | 19 | 0 |
| B | 0 | 19 | 0 |
| C | 0 | 19 | 0 |
| D | 0 | 19 | 0 |
| Mode M0 | |||
|---|---|---|---|
| Quadrant | BADHDUFLAG | Total packets | Discarded packets |
| A | 0 | 12153 | 2 |
| B | 0 | 10586 | 1 |
| C | 0 | 10326 | 1 |
| D | 0 | 15329 | 1 |
| Quadrant | Total seconds | Saturated seconds | Saturation percentage |
|---|---|---|---|
| A | 5091 | 72 | 1.414260% |
| B | 5091 | 15 | 0.294638% |
| C | 5091 | 3 | 0.058928% |
| D | 5091 | 337 | 6.619525% |
Noise dominated data is calculated using 1-second bins in cleaned event files. If a bin has >2000 counts, and if more than 50% of those come from <1% of pixels, then it is considered to be noise-dominated and hence unusable.
| Quadrant | # 1 sec bins | Bins with >0 counts | Bins with >2000 counts | High rate bins dominated by noise | Noise dominated (total time) | Noise dominated (detector-on time) | Marked lightcurve |
|---|---|---|---|---|---|---|---|
| A | 6973 | 5092 | 53 | 53 | 0.76% | 1.04% | 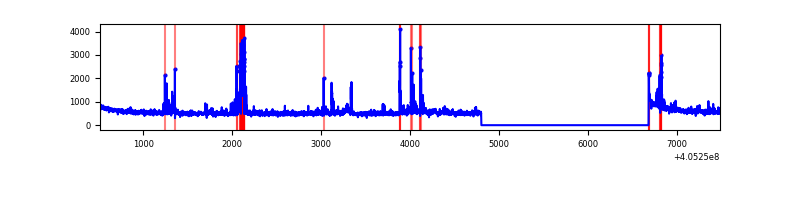 |
| B | 6973 | 5092 | 8 | 8 | 0.11% | 0.16% | 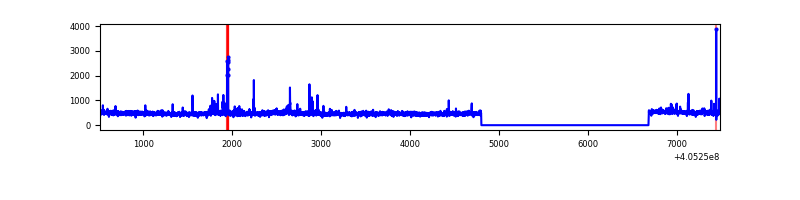 |
| C | 6973 | 5092 | 0 | 0 | 0.00% | 0.00% | 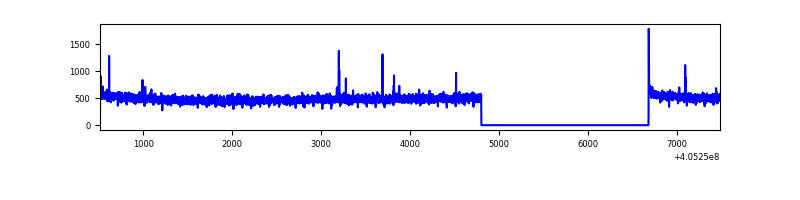 |
| D | 6973 | 5092 | 281 | 281 | 4.03% | 5.52% | 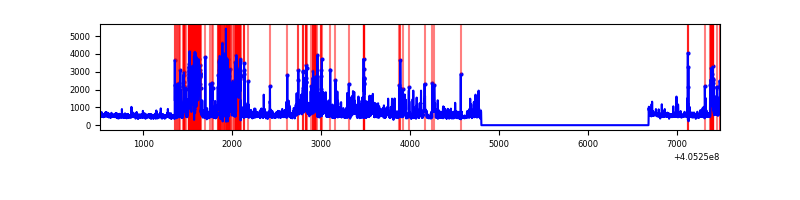 |
Top three noisy pixels from each quadrant. If the there are fewer than three noisy pixels in the level2.evt file, extra rows are filled as -1
| Pixel properties | Quadrant properties | ||||||
|---|---|---|---|---|---|---|---|
| Quadrant | DetID | PixID | Counts | Sigma | Mean | Median | Sigma |
| A | 10 | 83 | 364276 | 3072.21 | 591 | 581 | 118.4 |
| A | 13 | 248 | 159657 | 1343.75 | 591 | 581 | 118.4 |
| A | 9 | 143 | 122679 | 1031.39 | 591 | 581 | 118.4 |
| B | 0 | 183 | 67893 | 607.49 | 584 | 571 | 110.8 |
| B | 15 | 85 | 30238 | 267.7 | 584 | 571 | 110.8 |
| B | 0 | 230 | 26891 | 237.5 | 584 | 571 | 110.8 |
| C | 15 | 214 | 214991 | 1635.36 | 571 | 574 | 131.1 |
| C | 12 | 249 | 9427 | 67.52 | 571 | 574 | 131.1 |
| C | 0 | 10 | 6255 | 43.33 | 571 | 574 | 131.1 |
| D | 12 | 227 | 559288 | 4131.64 | 561 | 546 | 135.2 |
| D | 12 | 6 | 284544 | 2100.03 | 561 | 546 | 135.2 |
| D | 2 | 16 | 259927 | 1918.0 | 561 | 546 | 135.2 |
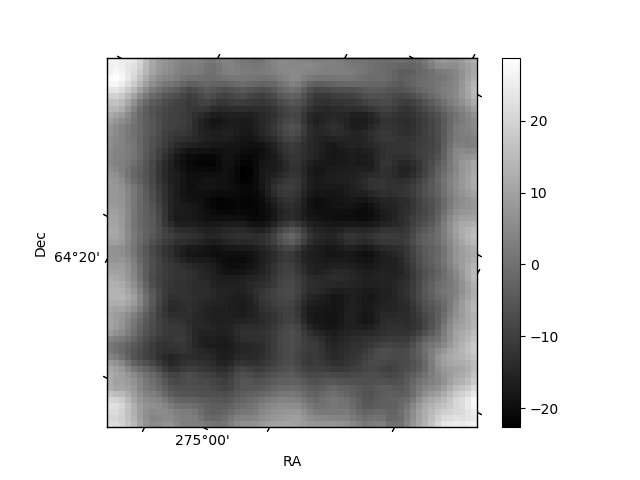
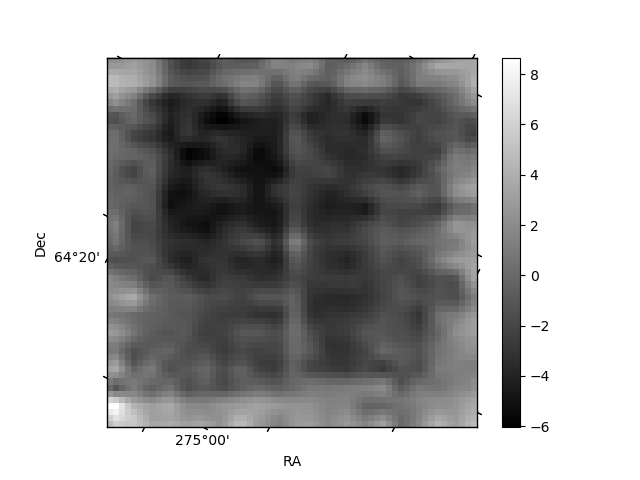
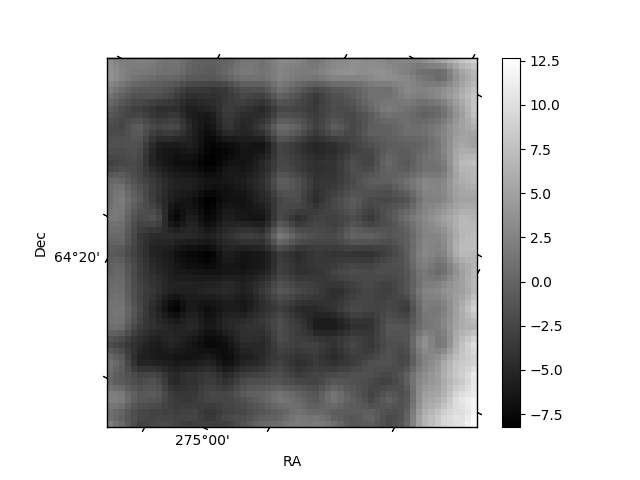
Histogram calculated using DETX and DETY for each event in the final _common_clean file
| Quadrant A | 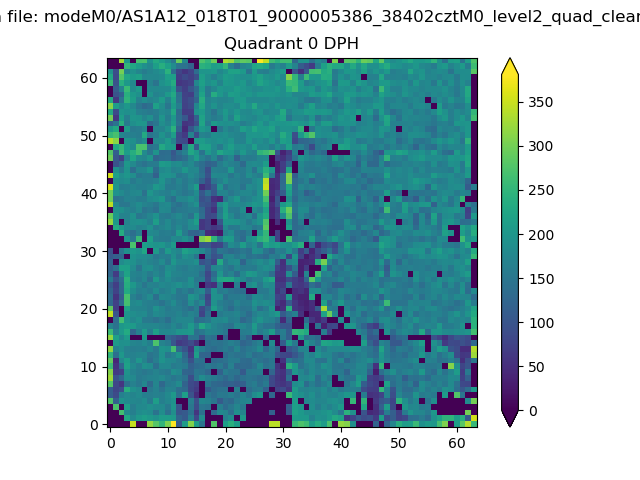 |
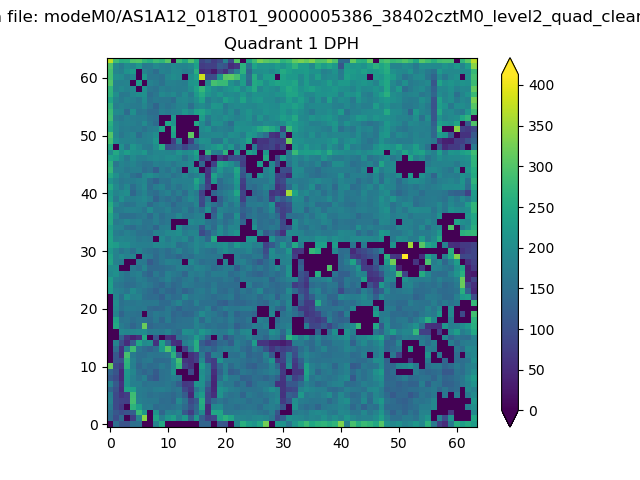 |
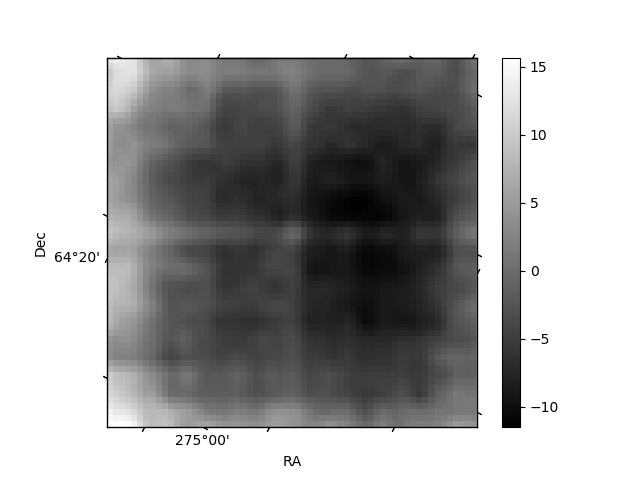
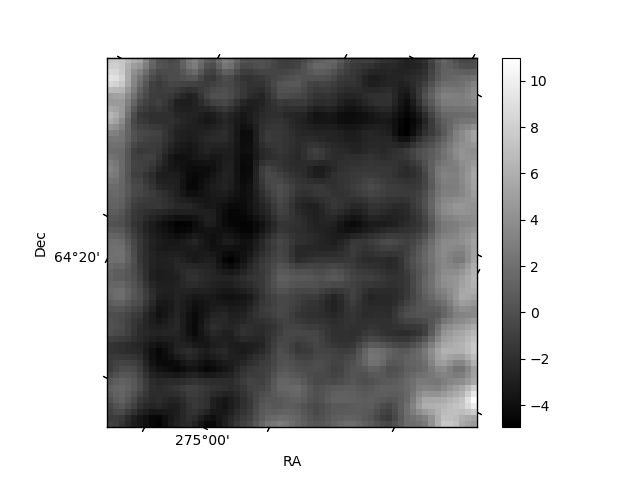
Quadrant B |
|---|---|---|---|
| Quadrant D | 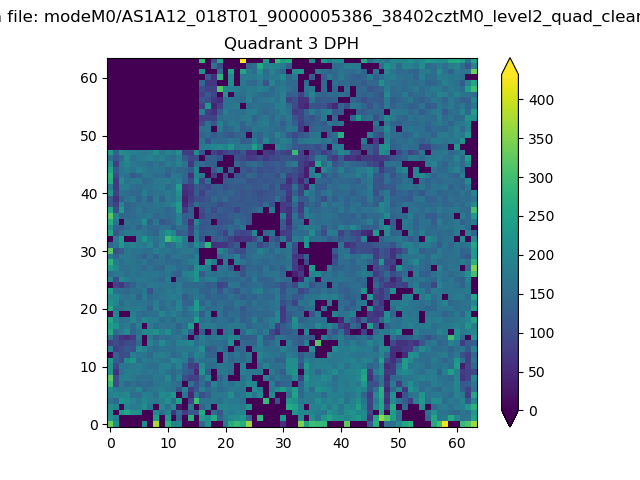 |
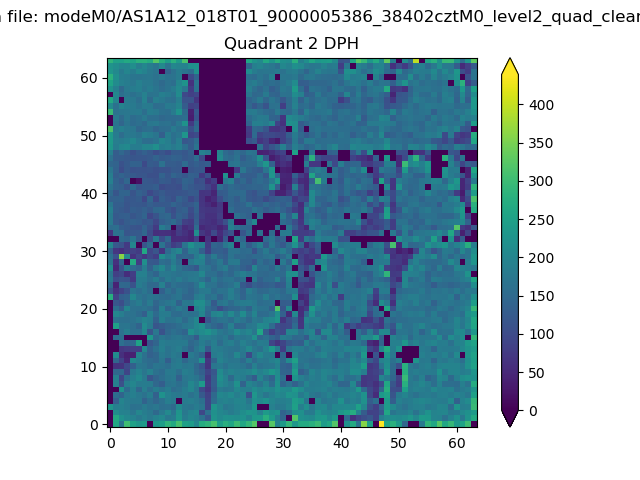 |
Quadrant C |
| Plot type | Count rate plots | Images |
|---|---|---|
| Comparison with Poisson distribution Blue bars denote a histogram of data divided into 1 sec bins. Red curve is a Poisson curve with rate = median count rate of data. |
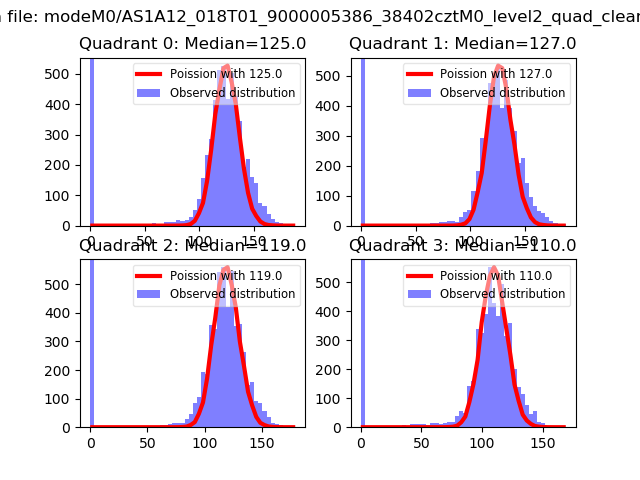 |
 |
| Quadrant-wise count rates Data is divided into 100 sec bins |
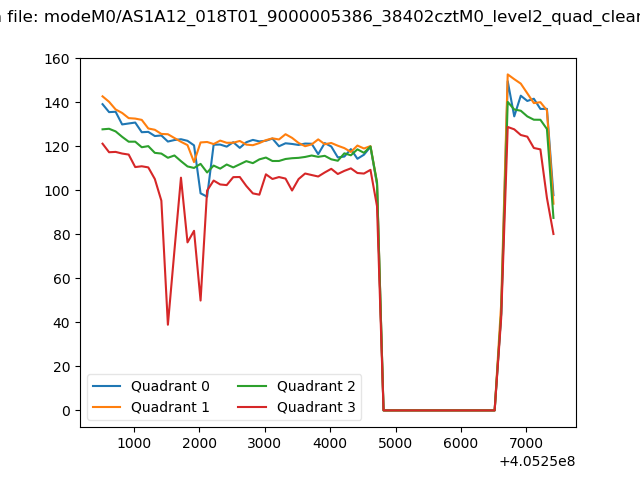 |
|
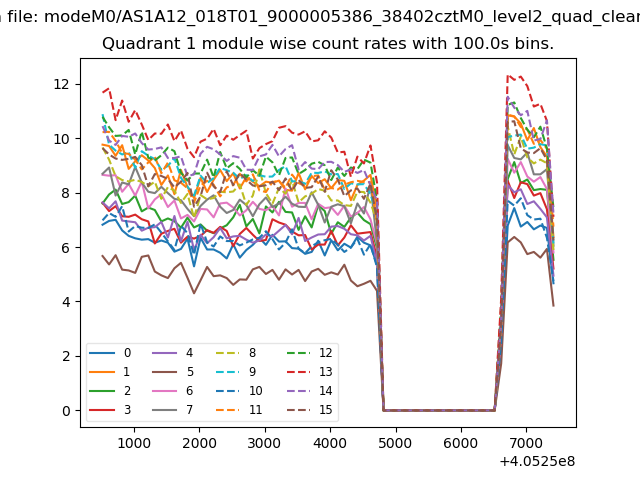
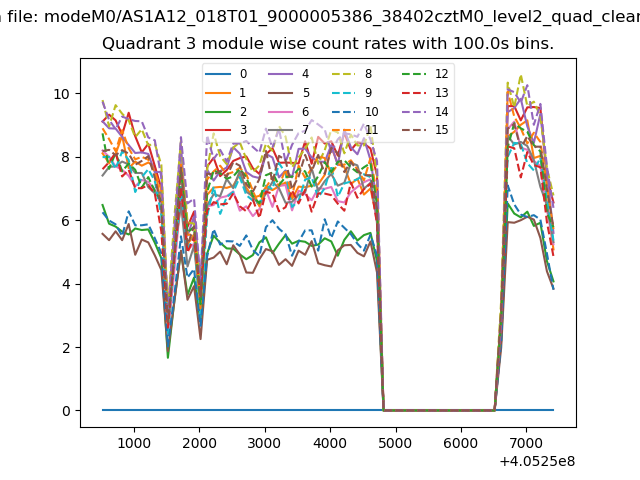
| Module-wise count rates for Quadrant A Data is divided into 100 sec bins |
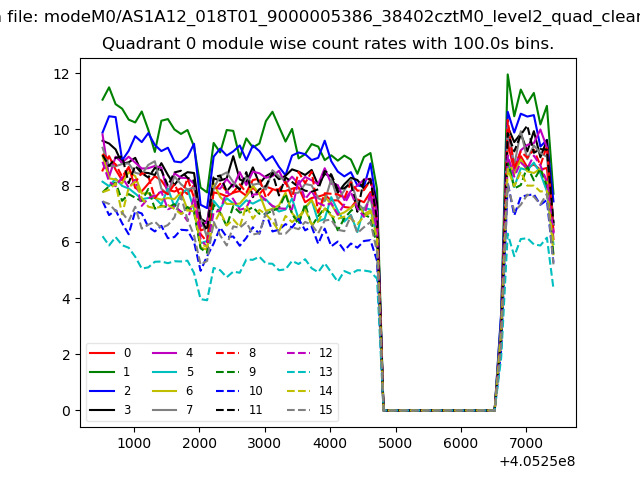 |
 |
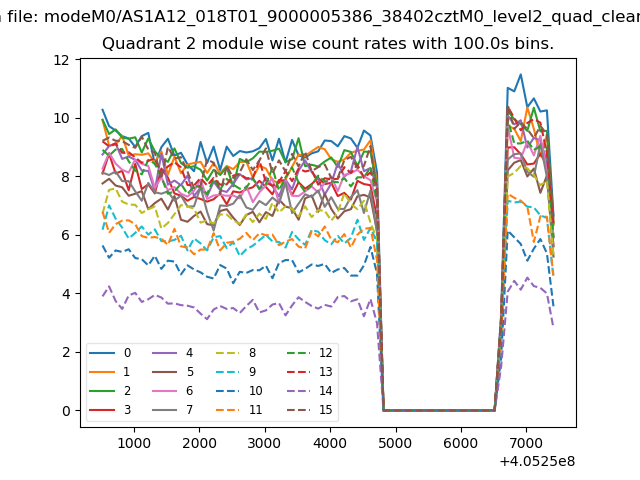
| Module-wise count rates for Quadrant B Data is divided into 100 sec bins |
 |
 |
| Module-wise count rates for Quadrant C Data is divided into 100 sec bins |
 |
 |
| Module-wise count rates for Quadrant D Data is divided into 100 sec bins |
 |
 |
| Parameter | Plot |
|---|---|
| CZT HV Monitor | 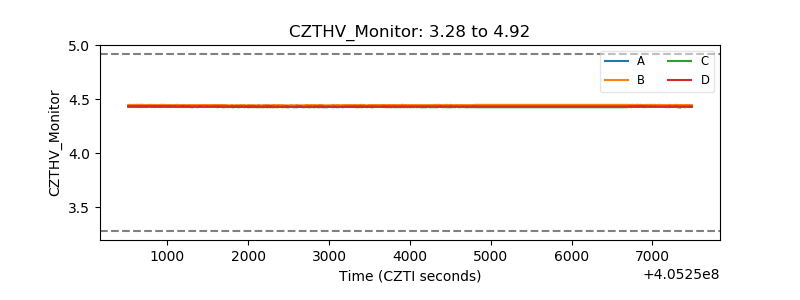 |
| D_VDD | 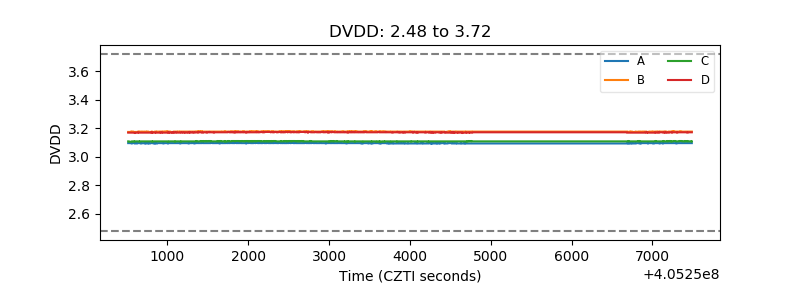 |
| Temperature 1 | 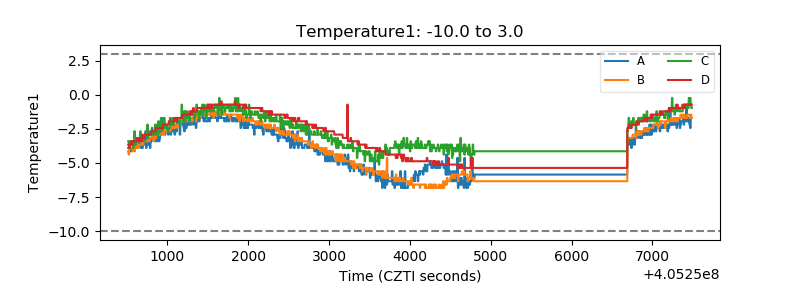 |
| Veto HV Monitor | 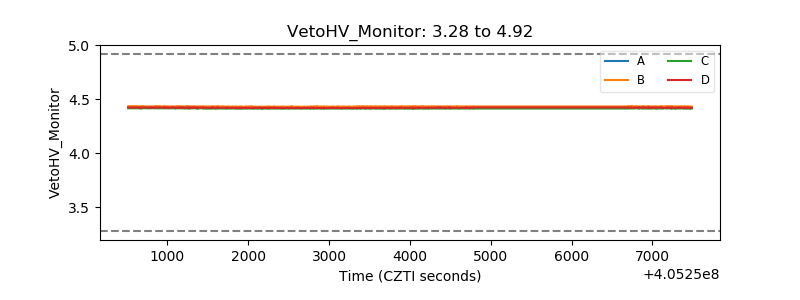 |
| Veto LLD | 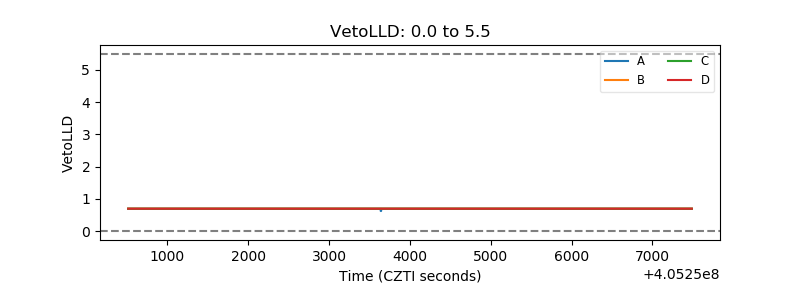 |
| Alpha Counter | 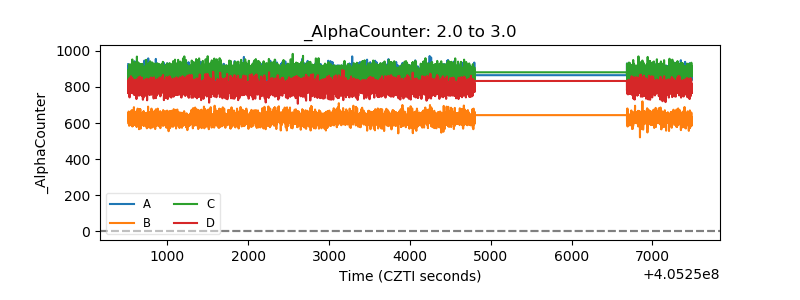 |
| _CPM_Rate | 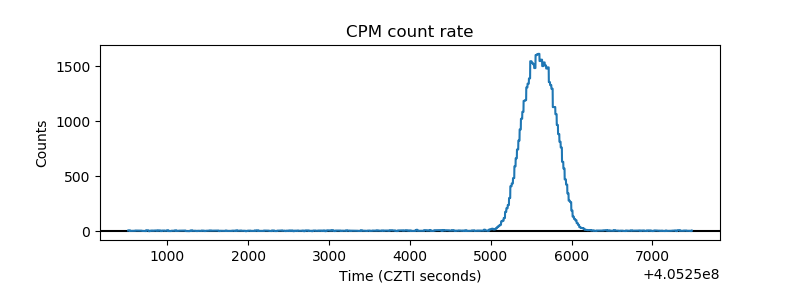 |
| CZT Counter | 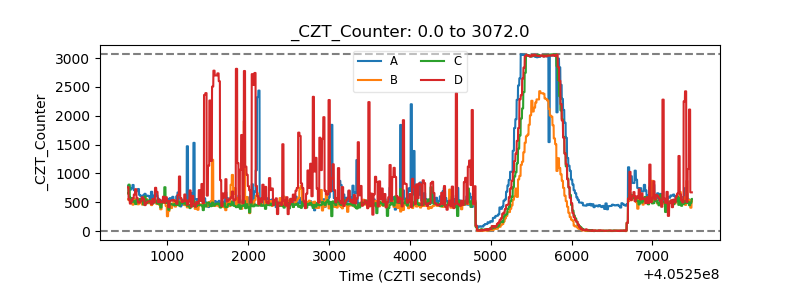 |
| +2.5 Volts monitor | 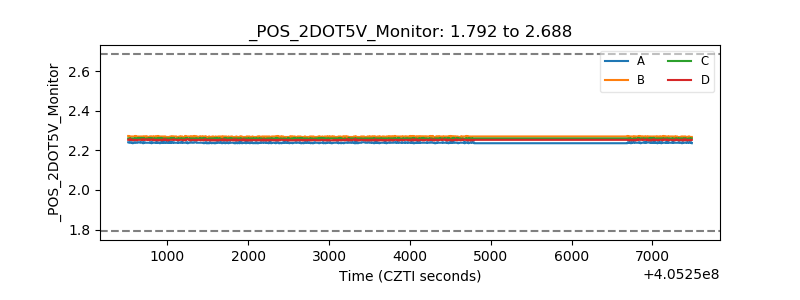 |
| +5 Volts monitor | 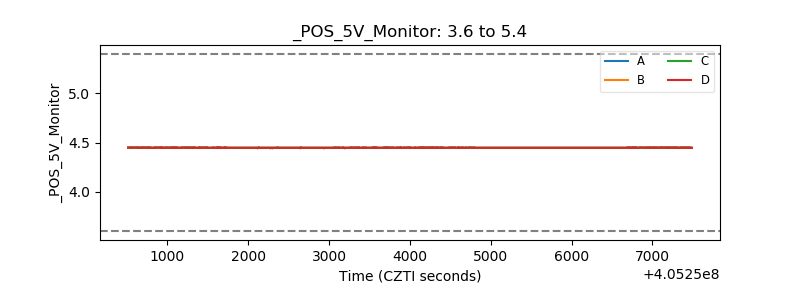 |
| _ROLL_ROT | 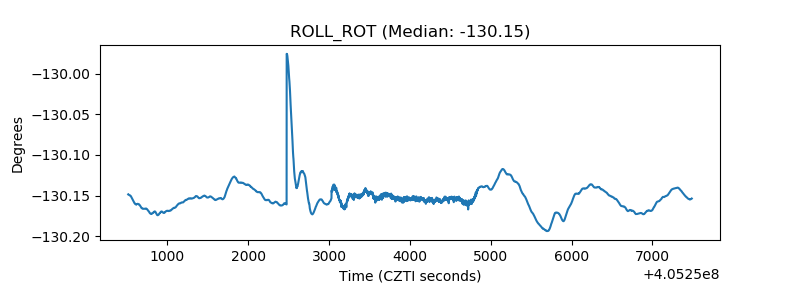 |
| _Roll_DEC | 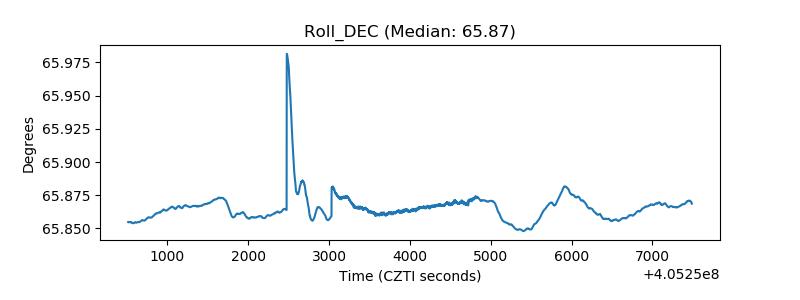 |
| _Roll_RA | 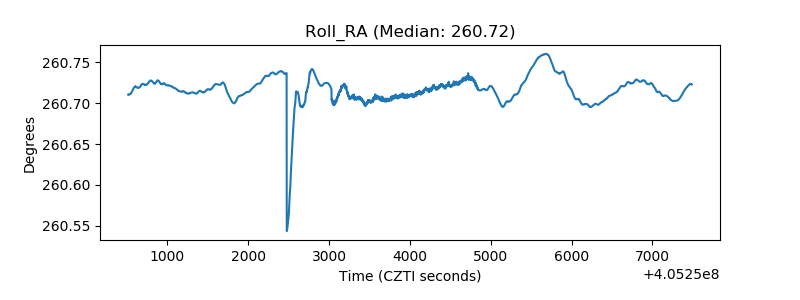 |
| Veto Counter | 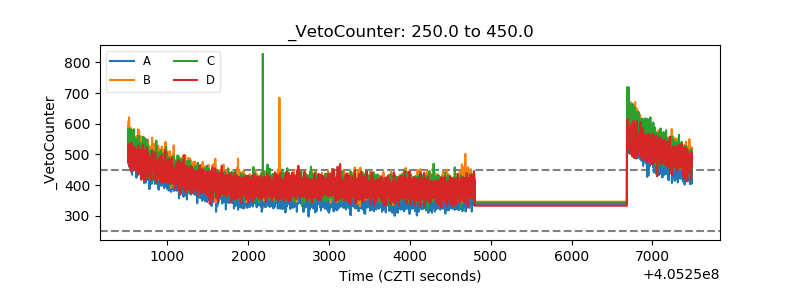 |