| Param | Original file | Final file |
|---|---|---|
| Filename | modeM0/AS1A12_018T01_9000005386_38403cztM0_level2.fits | modeM0/AS1A12_018T01_9000005386_38403cztM0_level2_quad_clean.evt |
| Size (bytes) | 327,864,960 | 95,630,400 |
| Size | 312.7 MB | 91.2 MB |
| Events in quadrant A | 3,155,128 | 660,079 |
| Events in quadrant B | 2,672,800 | 671,257 |
| Events in quadrant C | 2,557,267 | 629,373 |
| Events in quadrant D | 3,354,189 | 577,920 |
| Mode SS | |||
|---|---|---|---|
| Quadrant | BADHDUFLAG | Total packets | Discarded packets |
| A | 0 | 104 | 0 |
| B | 0 | 104 | 0 |
| C | 0 | 104 | 0 |
| D | 0 | 104 | 0 |
| Mode M9 | |||
|---|---|---|---|
| Quadrant | BADHDUFLAG | Total packets | Discarded packets |
| A | 0 | 21 | 0 |
| B | 0 | 21 | 0 |
| C | 0 | 21 | 0 |
| D | 0 | 22 | 0 |
| Mode M0 | |||
|---|---|---|---|
| Quadrant | BADHDUFLAG | Total packets | Discarded packets |
| A | 0 | 12515 | 3 |
| B | 0 | 11015 | 2 |
| C | 0 | 10476 | 2 |
| D | 0 | 13139 | 2 |
| Quadrant | Total seconds | Saturated seconds | Saturation percentage |
|---|---|---|---|
| A | 5098 | 72 | 1.412319% |
| B | 5098 | 28 | 0.549235% |
| C | 5098 | 8 | 0.156924% |
| D | 5098 | 128 | 2.510789% |
Noise dominated data is calculated using 1-second bins in cleaned event files. If a bin has >2000 counts, and if more than 50% of those come from <1% of pixels, then it is considered to be noise-dominated and hence unusable.
| Quadrant | # 1 sec bins | Bins with >0 counts | Bins with >2000 counts | High rate bins dominated by noise | Noise dominated (total time) | Noise dominated (detector-on time) | Marked lightcurve |
|---|---|---|---|---|---|---|---|
| A | 7101 | 5099 | 55 | 55 | 0.77% | 1.08% | 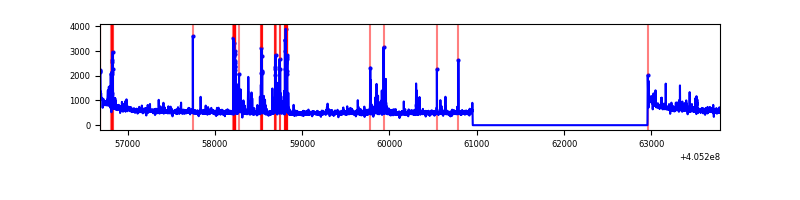 |
| B | 7101 | 5099 | 12 | 12 | 0.17% | 0.24% | 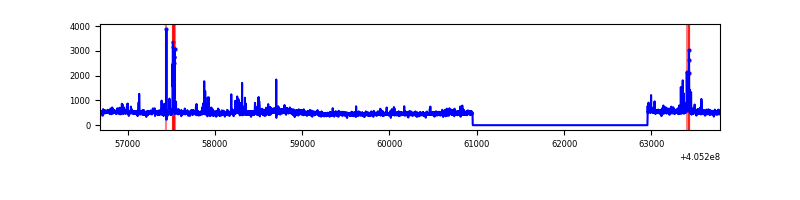 |
| C | 7101 | 5099 | 3 | 3 | 0.04% | 0.06% | 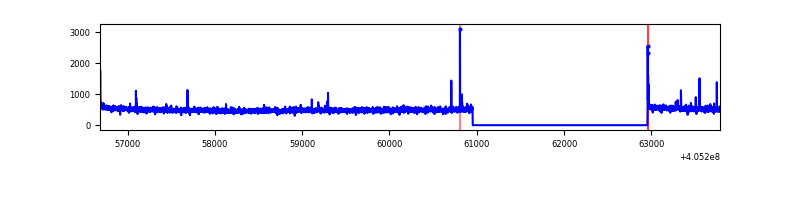 |
| D | 7101 | 5099 | 96 | 96 | 1.35% | 1.88% | 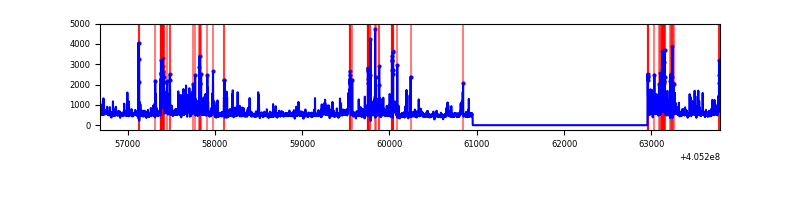 |
Top three noisy pixels from each quadrant. If the there are fewer than three noisy pixels in the level2.evt file, extra rows are filled as -1
| Pixel properties | Quadrant properties | ||||||
|---|---|---|---|---|---|---|---|
| Quadrant | DetID | PixID | Counts | Sigma | Mean | Median | Sigma |
| A | 10 | 83 | 406214 | 3325.1 | 604 | 592 | 122.0 |
| A | 13 | 248 | 271966 | 2224.6 | 604 | 592 | 122.0 |
| A | 12 | 189 | 74839 | 608.64 | 604 | 592 | 122.0 |
| B | 0 | 183 | 147603 | 1319.59 | 597 | 582 | 111.4 |
| B | 4 | 232 | 68619 | 610.67 | 597 | 582 | 111.4 |
| B | 0 | 230 | 55639 | 494.17 | 597 | 582 | 111.4 |
| C | 15 | 214 | 216887 | 1601.56 | 588 | 592 | 135.1 |
| C | 0 | 10 | 13101 | 92.62 | 588 | 592 | 135.1 |
| C | 15 | 159 | 11309 | 79.35 | 588 | 592 | 135.1 |
| D | 2 | 153 | 241031 | 1691.09 | 589 | 574 | 142.2 |
| D | 12 | 6 | 152821 | 1070.72 | 589 | 574 | 142.2 |
| D | 10 | 118 | 151443 | 1061.03 | 589 | 574 | 142.2 |
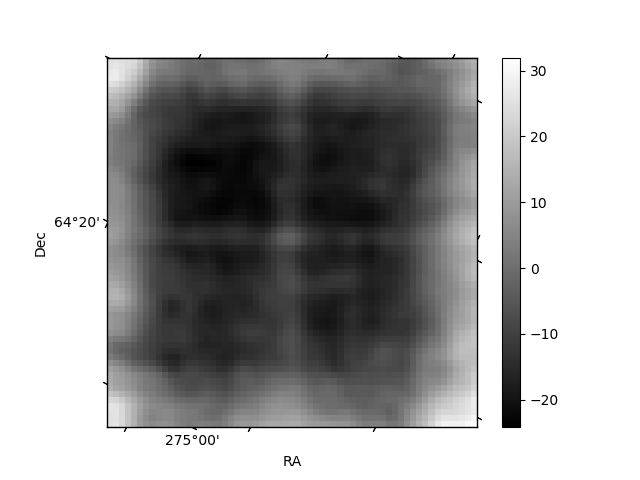
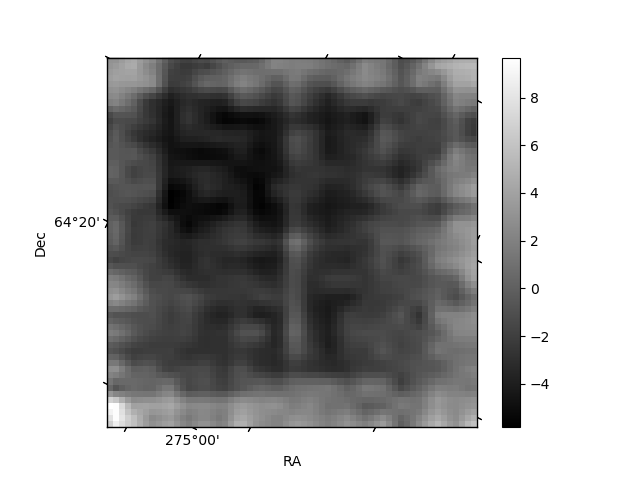
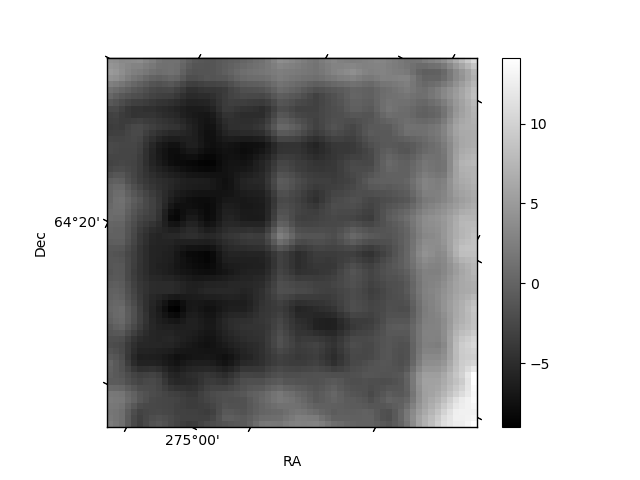
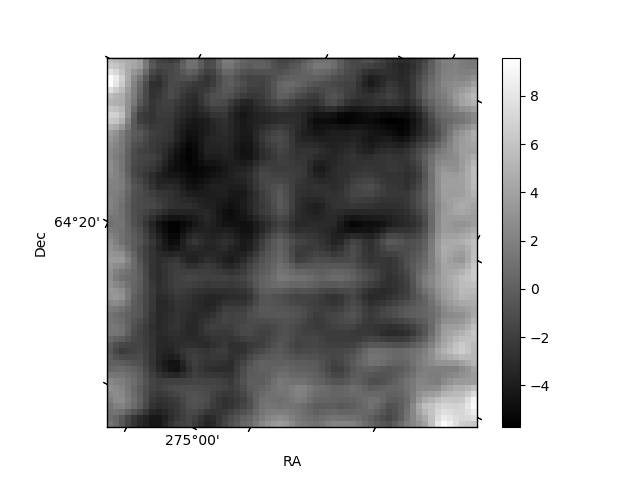
Histogram calculated using DETX and DETY for each event in the final _common_clean file
| Quadrant A | 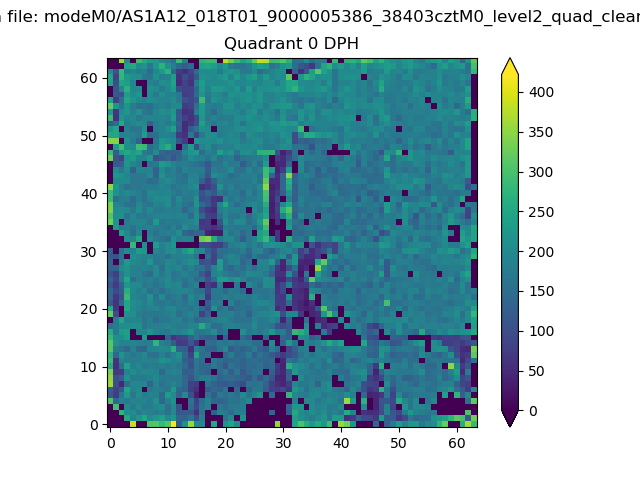 |
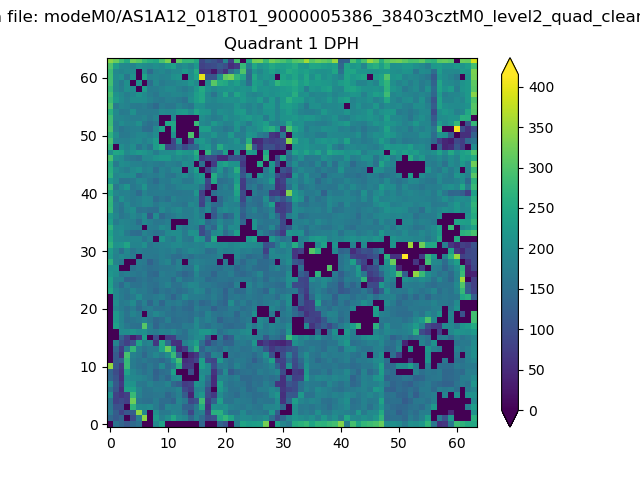 |
Quadrant B |
|---|---|---|---|
| Quadrant D | 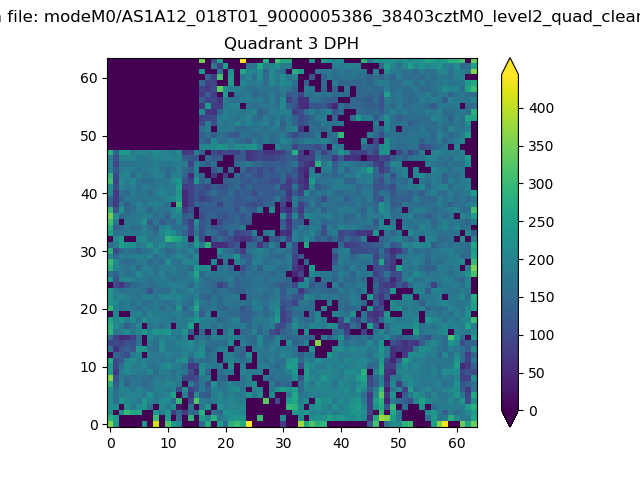 |
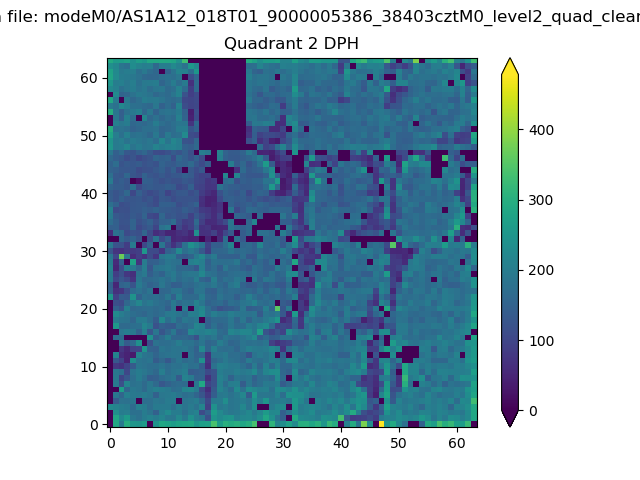 |
Quadrant C |
| Plot type | Count rate plots | Images |
|---|---|---|
| Comparison with Poisson distribution Blue bars denote a histogram of data divided into 1 sec bins. Red curve is a Poisson curve with rate = median count rate of data. |
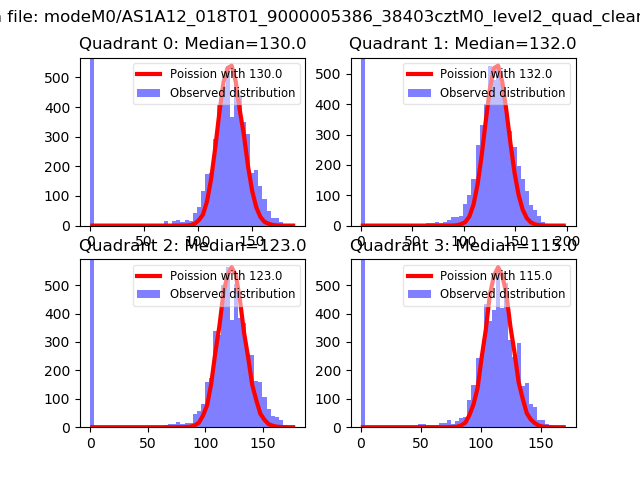 |
 |
| Quadrant-wise count rates Data is divided into 100 sec bins |
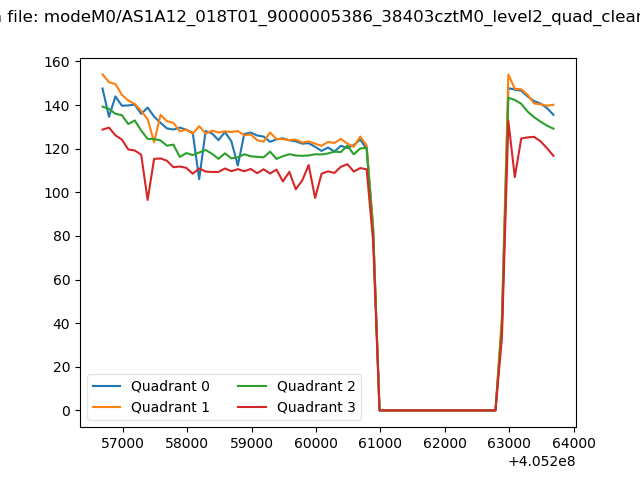 |
|
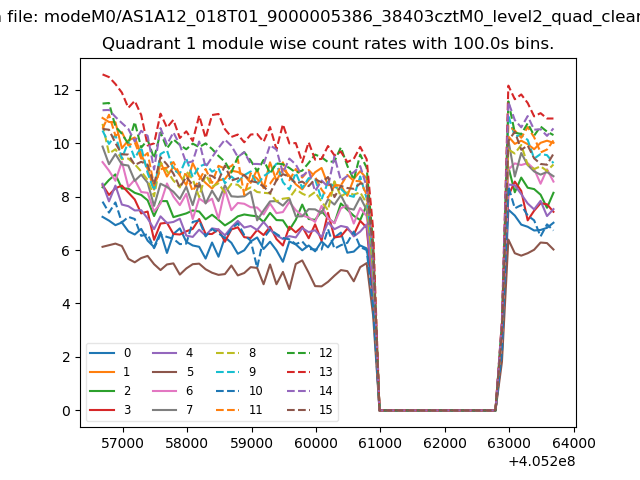
| Module-wise count rates for Quadrant A Data is divided into 100 sec bins |
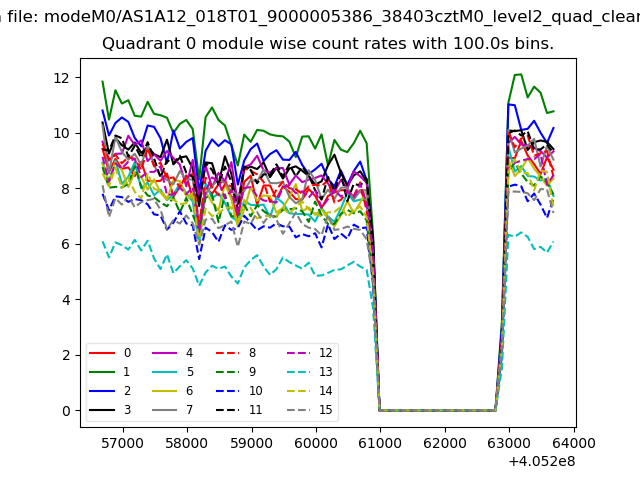 |
 |
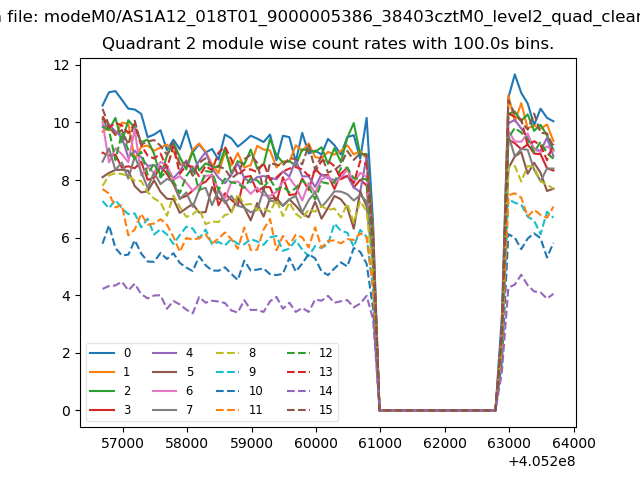
| Module-wise count rates for Quadrant B Data is divided into 100 sec bins |
 |
 |
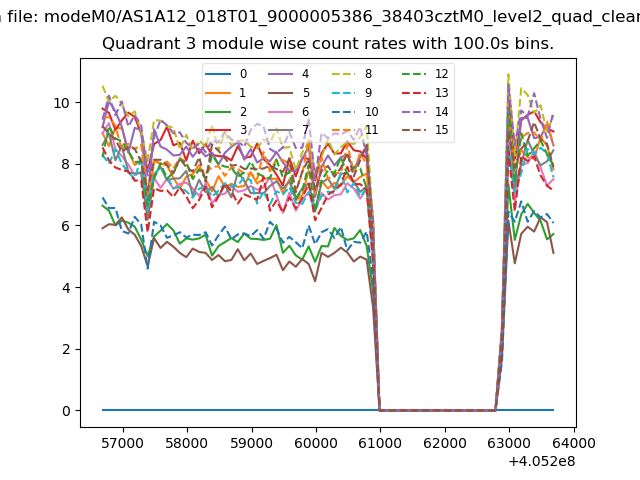
| Module-wise count rates for Quadrant C Data is divided into 100 sec bins |
 |
 |
| Module-wise count rates for Quadrant D Data is divided into 100 sec bins |
 |
 |
| Parameter | Plot |
|---|---|
| CZT HV Monitor | 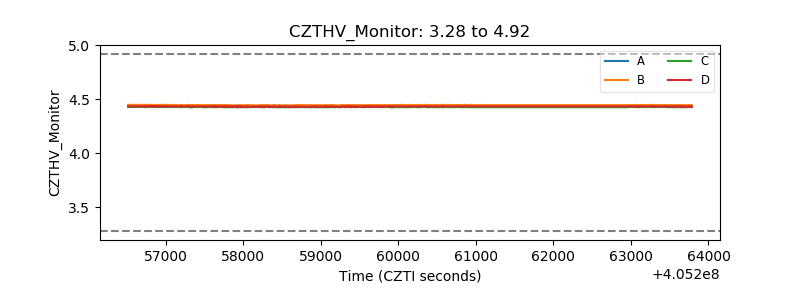 |
| D_VDD | 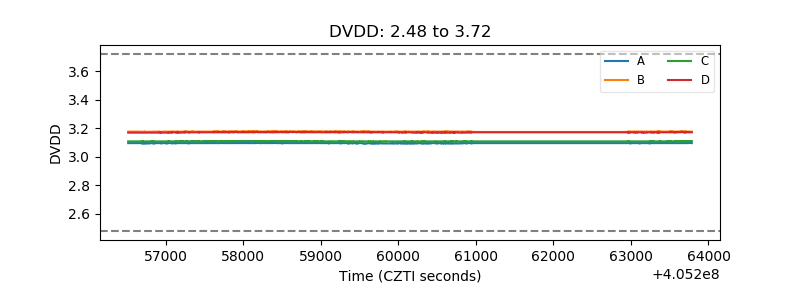 |
| Temperature 1 | 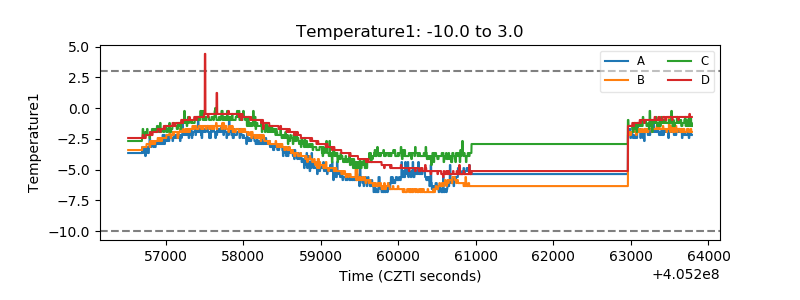 |
| Veto HV Monitor | 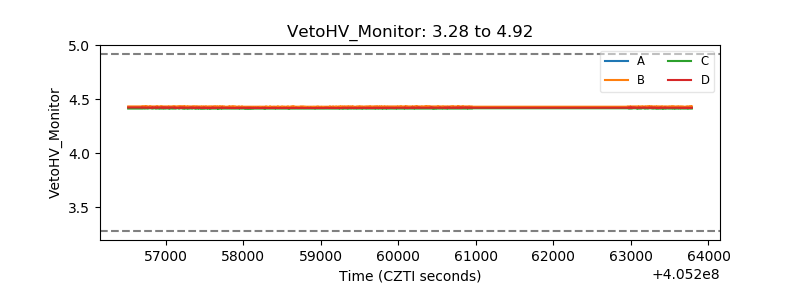 |
| Veto LLD | 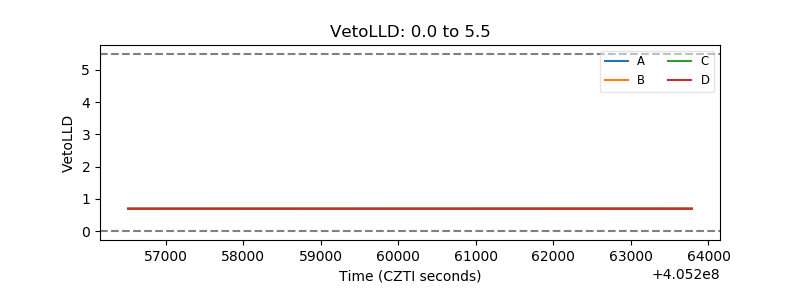 |
| Alpha Counter | 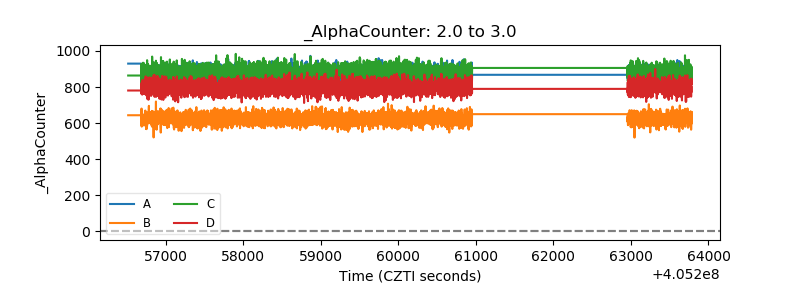 |
| _CPM_Rate | 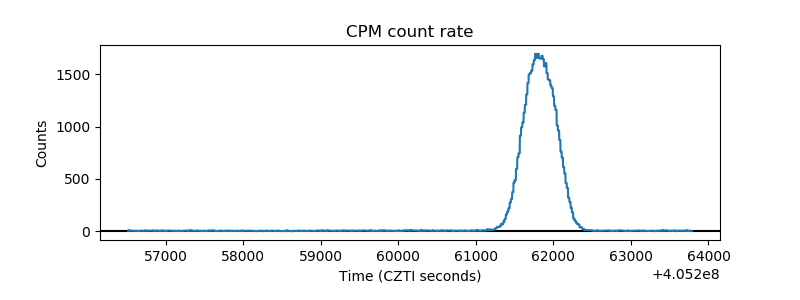 |
| CZT Counter | 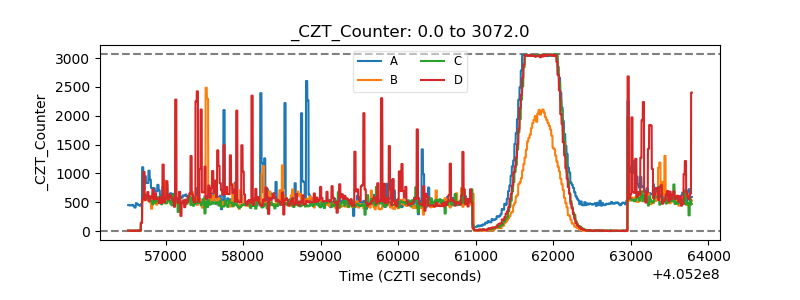 |
| +2.5 Volts monitor | 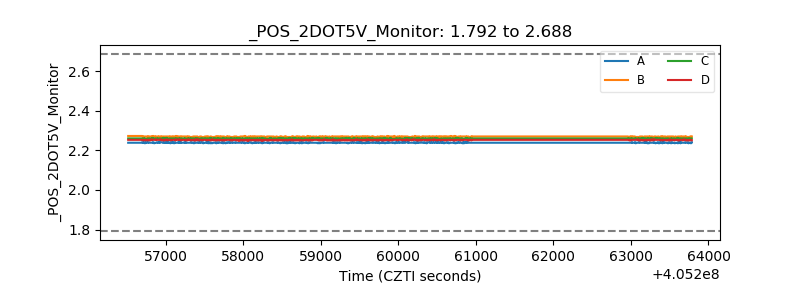 |
| +5 Volts monitor | 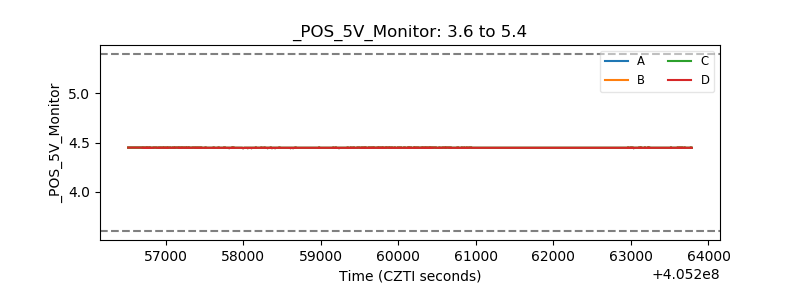 |
| _ROLL_ROT | 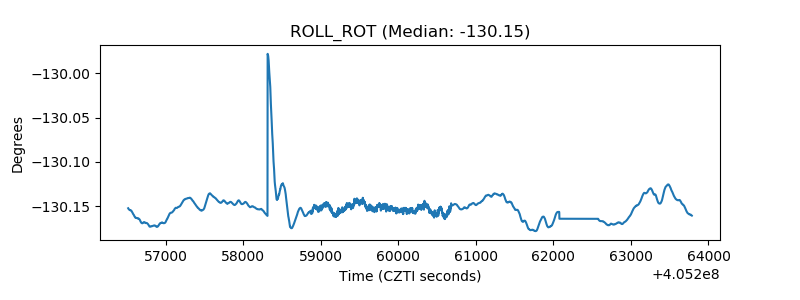 |
| _Roll_DEC | 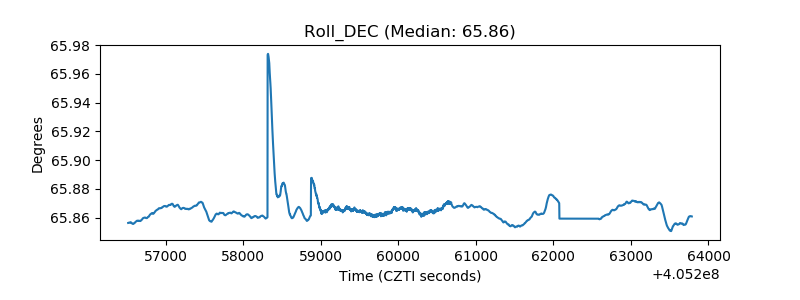 |
| _Roll_RA | 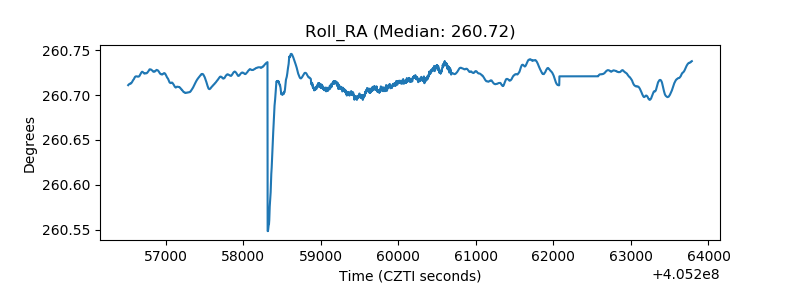 |
| Veto Counter | 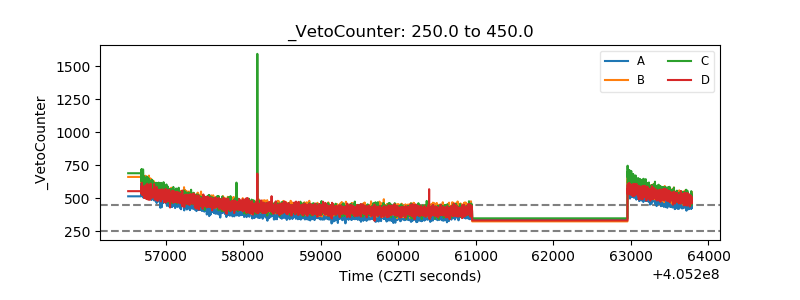 |