| Param | Original file | Final file |
|---|---|---|
| Filename | modeM0/AS1A12_018T01_9000005386_38404cztM0_level2.fits | modeM0/AS1A12_018T01_9000005386_38404cztM0_level2_quad_clean.evt |
| Size (bytes) | 349,404,480 | 96,566,400 |
| Size | 333.2 MB | 92.1 MB |
| Events in quadrant A | 3,764,546 | 637,749 |
| Events in quadrant B | 2,766,127 | 679,305 |
| Events in quadrant C | 2,647,069 | 648,921 |
| Events in quadrant D | 3,352,342 | 594,989 |
| Mode SS | |||
|---|---|---|---|
| Quadrant | BADHDUFLAG | Total packets | Discarded packets |
| A | 0 | 106 | 0 |
| B | 0 | 106 | 0 |
| C | 0 | 106 | 0 |
| D | 0 | 106 | 0 |
| Mode M9 | |||
|---|---|---|---|
| Quadrant | BADHDUFLAG | Total packets | Discarded packets |
| A | 0 | 24 | 0 |
| B | 0 | 24 | 0 |
| C | 0 | 24 | 0 |
| D | 0 | 25 | 0 |
| Mode M0 | |||
|---|---|---|---|
| Quadrant | BADHDUFLAG | Total packets | Discarded packets |
| A | 0 | 14482 | 3 |
| B | 0 | 11390 | 2 |
| C | 0 | 10757 | 2 |
| D | 0 | 13167 | 2 |
| Quadrant | Total seconds | Saturated seconds | Saturation percentage |
|---|---|---|---|
| A | 5185 | 354 | 6.827387% |
| B | 5185 | 29 | 0.559306% |
| C | 5185 | 16 | 0.308582% |
| D | 5185 | 114 | 2.198650% |
Noise dominated data is calculated using 1-second bins in cleaned event files. If a bin has >2000 counts, and if more than 50% of those come from <1% of pixels, then it is considered to be noise-dominated and hence unusable.
| Quadrant | # 1 sec bins | Bins with >0 counts | Bins with >2000 counts | High rate bins dominated by noise | Noise dominated (total time) | Noise dominated (detector-on time) | Marked lightcurve |
|---|---|---|---|---|---|---|---|
| A | 7278 | 5186 | 273 | 273 | 3.75% | 5.26% | 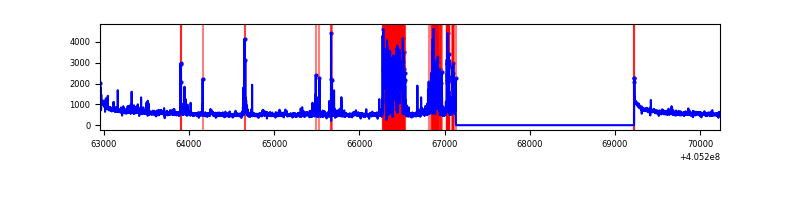 |
| B | 7278 | 5186 | 17 | 17 | 0.23% | 0.33% | 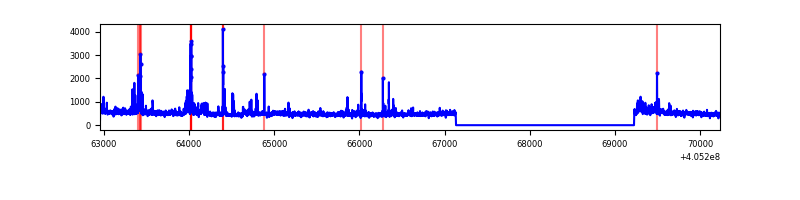 |
| C | 7278 | 5186 | 6 | 6 | 0.08% | 0.12% | 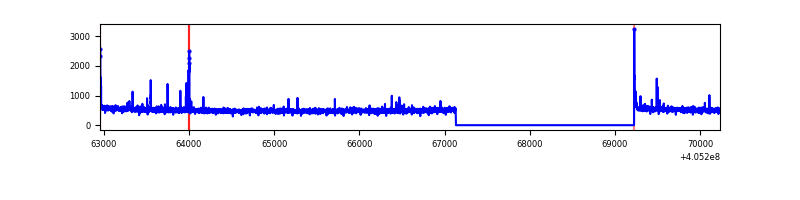 |
| D | 7278 | 5186 | 85 | 85 | 1.17% | 1.64% | 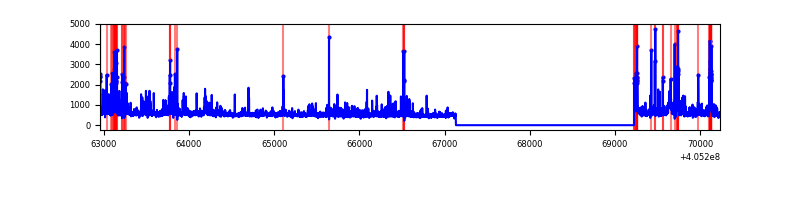 |
Top three noisy pixels from each quadrant. If the there are fewer than three noisy pixels in the level2.evt file, extra rows are filled as -1
| Pixel properties | Quadrant properties | ||||||
|---|---|---|---|---|---|---|---|
| Quadrant | DetID | PixID | Counts | Sigma | Mean | Median | Sigma |
| A | 13 | 248 | 890402 | 7460.05 | 595 | 583 | 119.3 |
| A | 10 | 83 | 410815 | 3439.29 | 595 | 583 | 119.3 |
| A | 9 | 143 | 72572 | 603.54 | 595 | 583 | 119.3 |
| B | 0 | 183 | 190062 | 1693.66 | 607 | 593 | 111.9 |
| B | 4 | 232 | 77238 | 685.13 | 607 | 593 | 111.9 |
| B | 0 | 230 | 34899 | 306.66 | 607 | 593 | 111.9 |
| C | 15 | 214 | 220738 | 1602.35 | 603 | 608 | 137.4 |
| C | 5 | 250 | 31992 | 228.45 | 603 | 608 | 137.4 |
| C | 0 | 10 | 23301 | 165.19 | 603 | 608 | 137.4 |
| D | 12 | 6 | 188957 | 1303.4 | 602 | 586 | 144.5 |
| D | 2 | 153 | 184766 | 1274.4 | 602 | 586 | 144.5 |
| D | 13 | 249 | 150766 | 1039.15 | 602 | 586 | 144.5 |
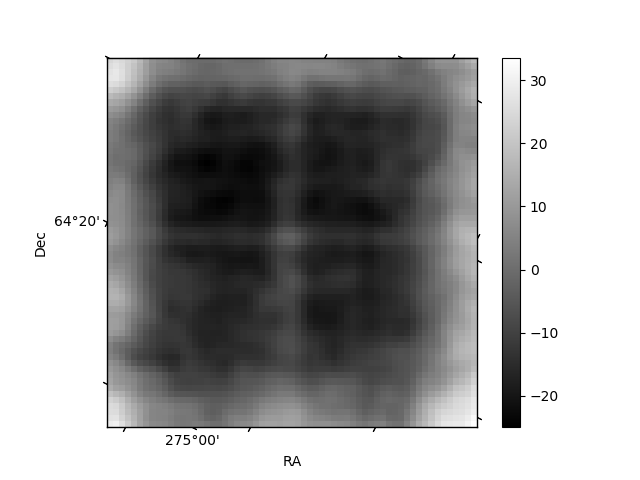
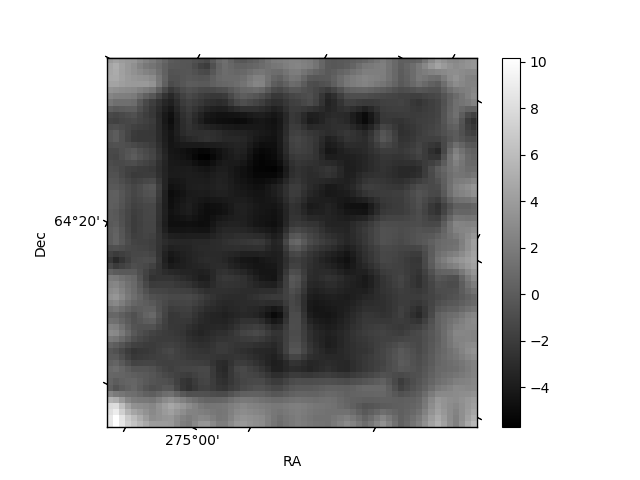
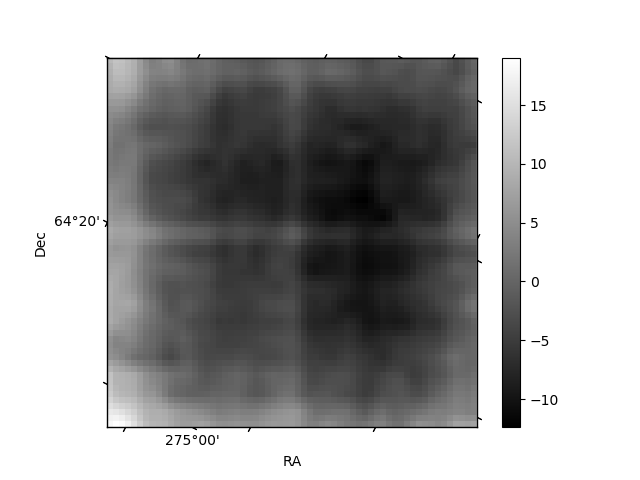
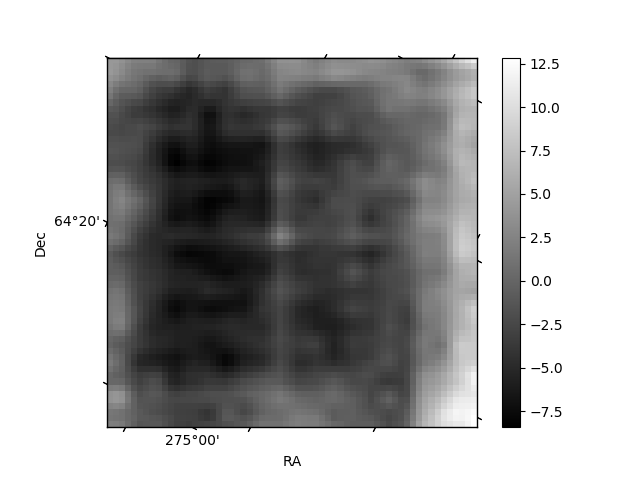
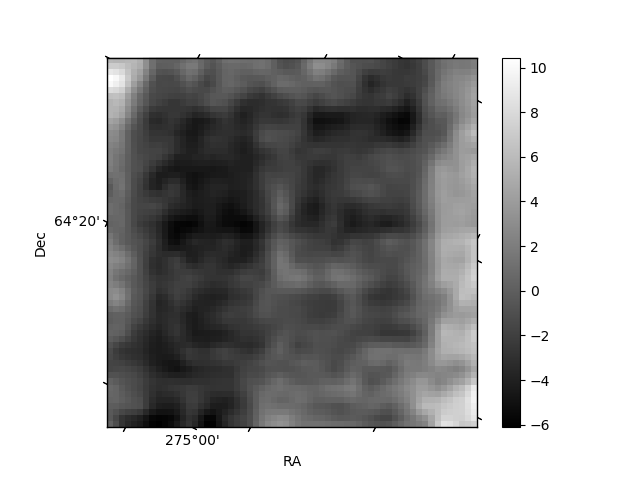
Histogram calculated using DETX and DETY for each event in the final _common_clean file
| Quadrant A | 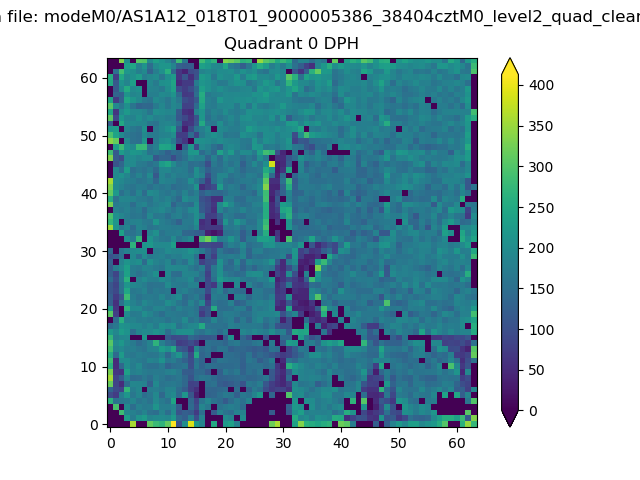 |
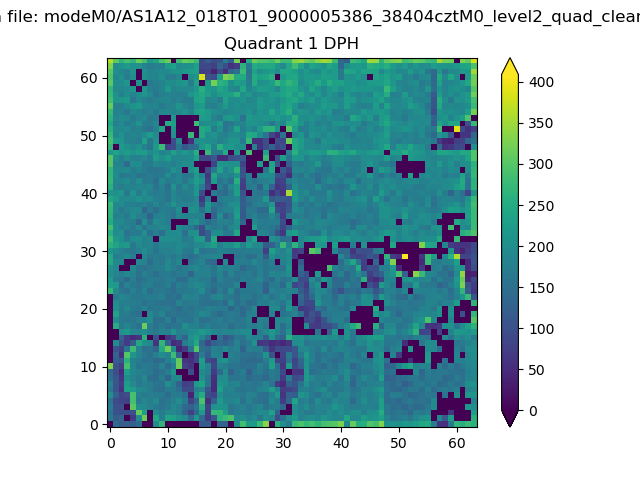 |
Quadrant B |
|---|---|---|---|
| Quadrant D | 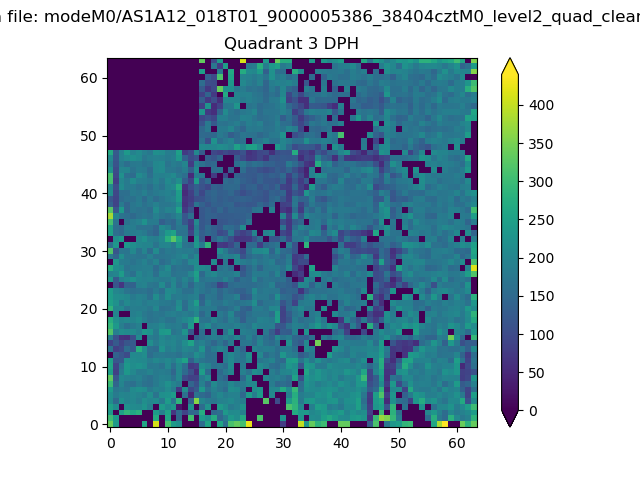 |
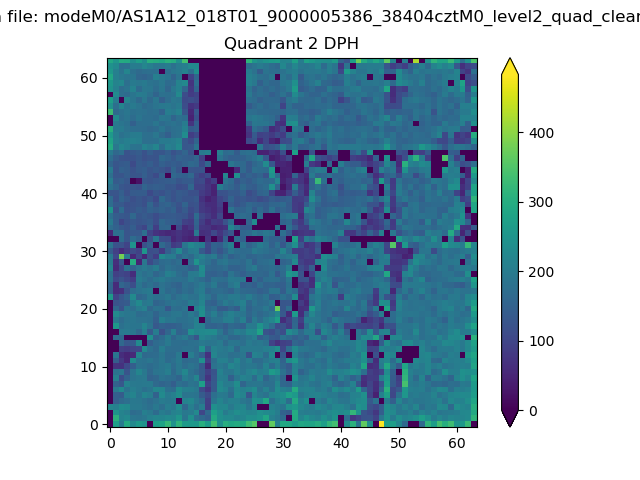 |
Quadrant C |
| Plot type | Count rate plots | Images |
|---|---|---|
| Comparison with Poisson distribution Blue bars denote a histogram of data divided into 1 sec bins. Red curve is a Poisson curve with rate = median count rate of data. |
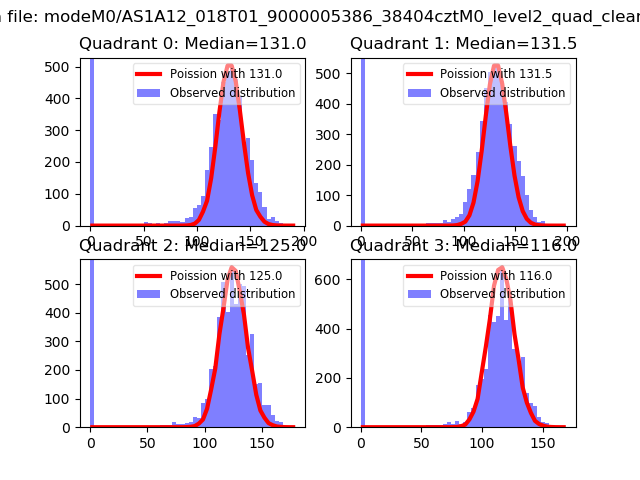 |
 |
| Quadrant-wise count rates Data is divided into 100 sec bins |
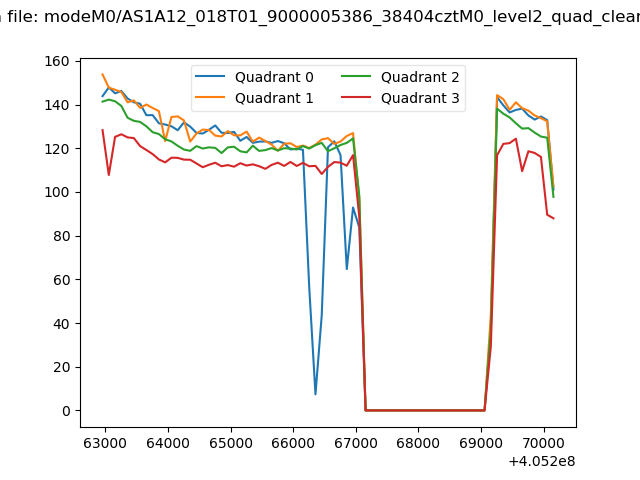 |
|
| Module-wise count rates for Quadrant A Data is divided into 100 sec bins |
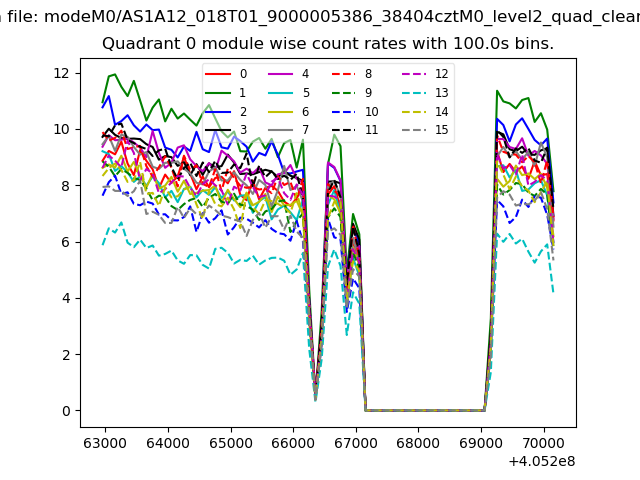 |
 |
| Module-wise count rates for Quadrant B Data is divided into 100 sec bins |
 |
 |
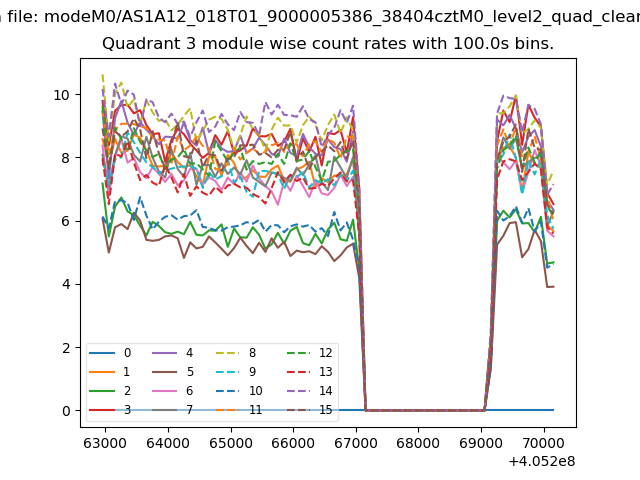
| Module-wise count rates for Quadrant C Data is divided into 100 sec bins |
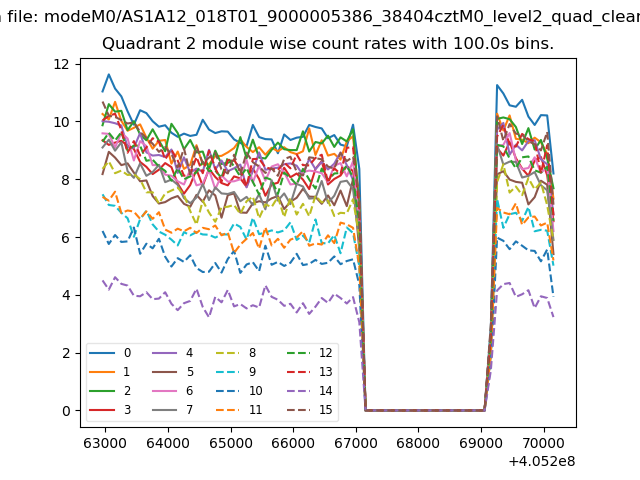 |
 |
| Module-wise count rates for Quadrant D Data is divided into 100 sec bins |
 |
 |
| Parameter | Plot |
|---|---|
| CZT HV Monitor | 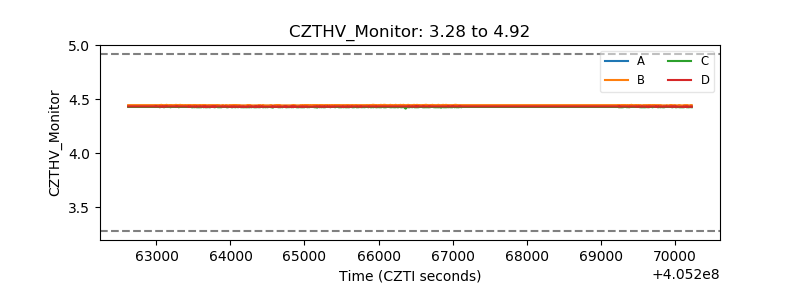 |
| D_VDD | 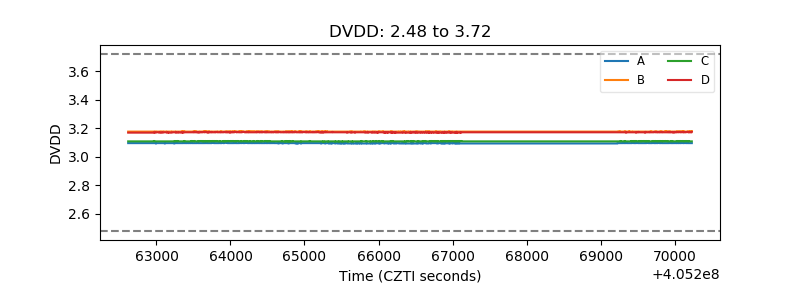 |
| Temperature 1 | 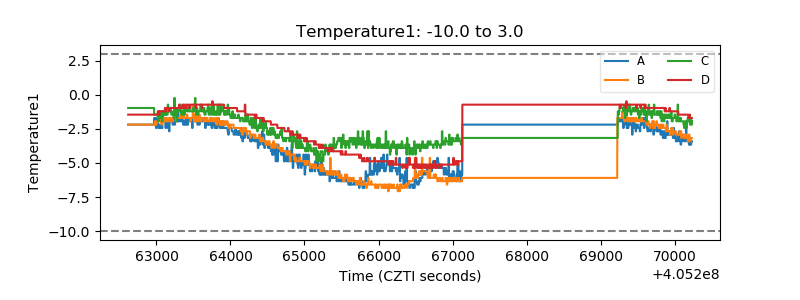 |
| Veto HV Monitor |  |
| Veto LLD | 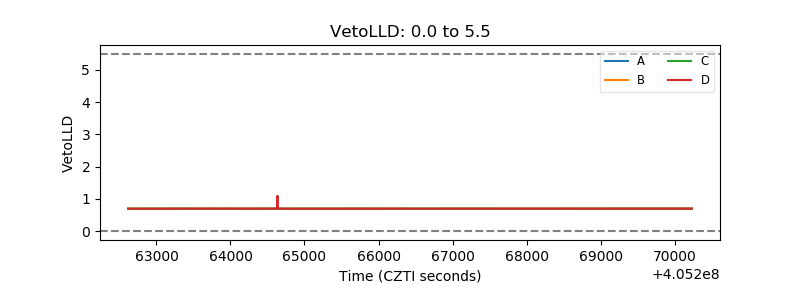 |
| Alpha Counter | 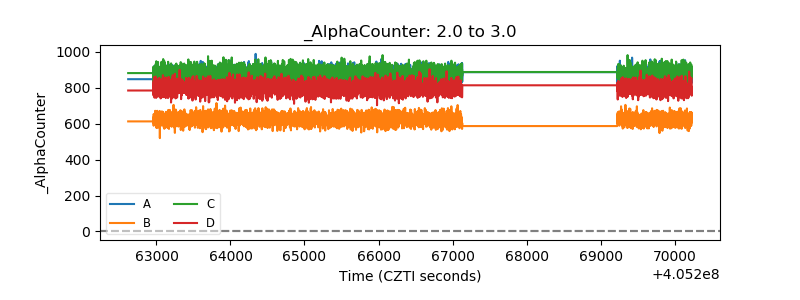 |
| _CPM_Rate | 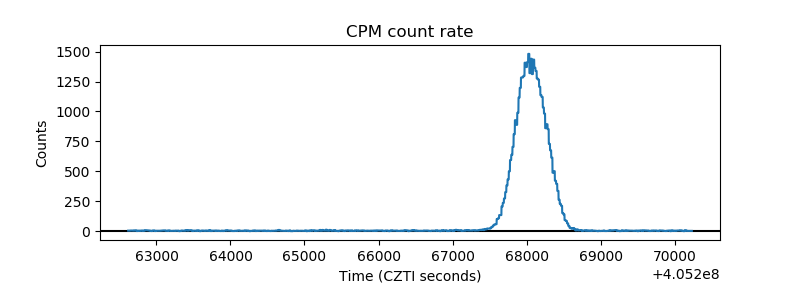 |
| CZT Counter | 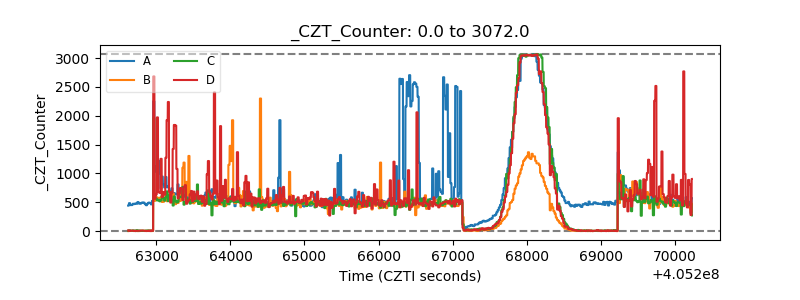 |
| +2.5 Volts monitor | 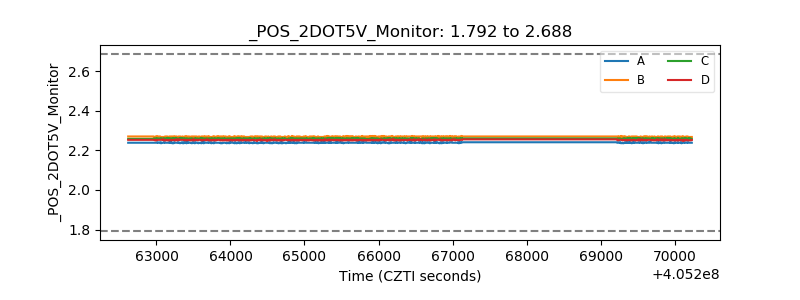 |
| +5 Volts monitor | 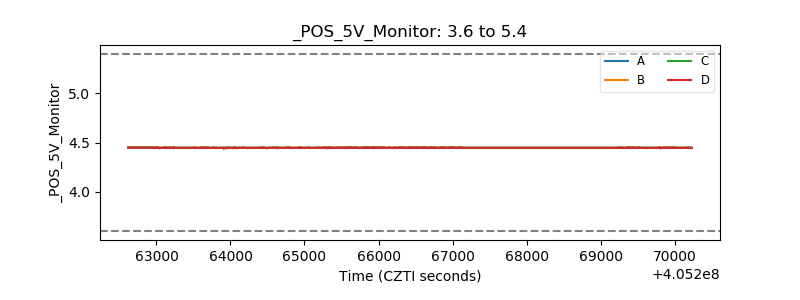 |
| _ROLL_ROT | 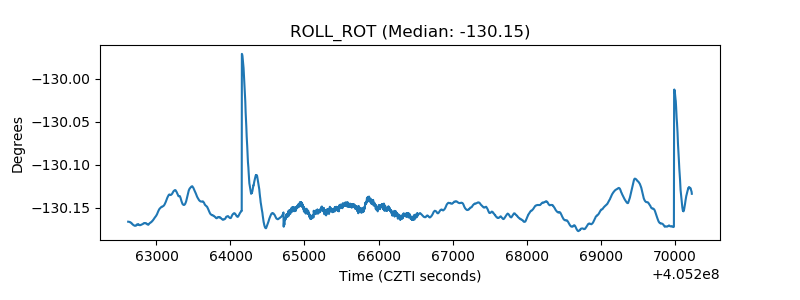 |
| _Roll_DEC | 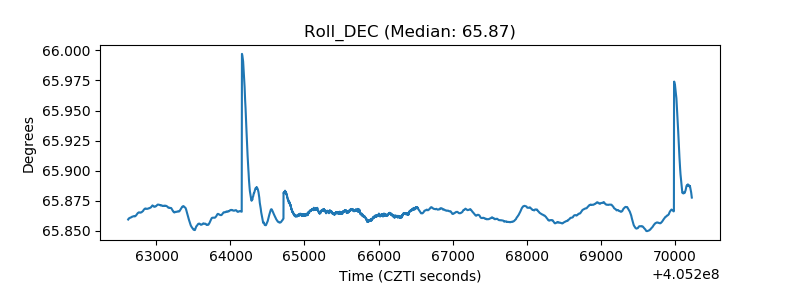 |
| _Roll_RA | 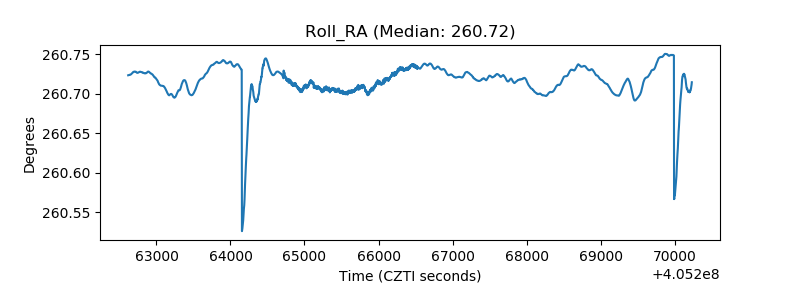 |
| Veto Counter | 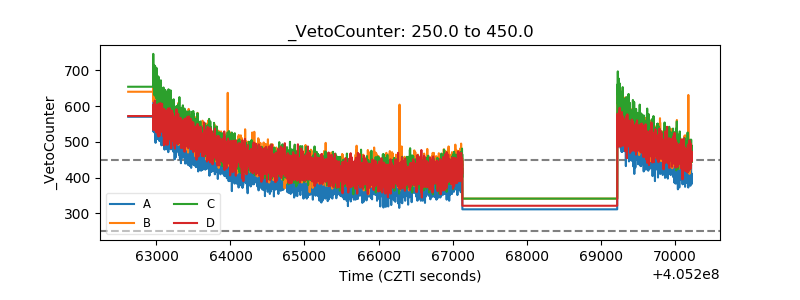 |