| Param | Original file | Final file |
|---|---|---|
| Filename | modeM0/AS1A12_018T01_9000005386_38406cztM0_level2.fits | modeM0/AS1A12_018T01_9000005386_38406cztM0_level2_quad_clean.evt |
| Size (bytes) | 319,127,040 | 86,160,960 |
| Size | 304.3 MB | 82.2 MB |
| Events in quadrant A | 2,983,205 | 576,260 |
| Events in quadrant B | 2,662,502 | 590,241 |
| Events in quadrant C | 2,562,428 | 572,026 |
| Events in quadrant D | 3,221,104 | 524,867 |
| Mode SS | |||
|---|---|---|---|
| Quadrant | BADHDUFLAG | Total packets | Discarded packets |
| A | 0 | 100 | 0 |
| B | 0 | 100 | 0 |
| C | 0 | 100 | 0 |
| D | 0 | 100 | 0 |
| Mode M9 | |||
|---|---|---|---|
| Quadrant | BADHDUFLAG | Total packets | Discarded packets |
| A | 0 | 28 | 0 |
| B | 0 | 28 | 0 |
| C | 0 | 28 | 0 |
| D | 0 | 29 | 0 |
| Mode M0 | |||
|---|---|---|---|
| Quadrant | BADHDUFLAG | Total packets | Discarded packets |
| A | 0 | 11934 | 3 |
| B | 0 | 11090 | 2 |
| C | 0 | 10609 | 2 |
| D | 0 | 12863 | 2 |
| Quadrant | Total seconds | Saturated seconds | Saturation percentage |
|---|---|---|---|
| A | 4929 | 103 | 2.089673% |
| B | 4929 | 53 | 1.075269% |
| C | 4929 | 32 | 0.649219% |
| D | 4929 | 94 | 1.907081% |
Noise dominated data is calculated using 1-second bins in cleaned event files. If a bin has >2000 counts, and if more than 50% of those come from <1% of pixels, then it is considered to be noise-dominated and hence unusable.
| Quadrant | # 1 sec bins | Bins with >0 counts | Bins with >2000 counts | High rate bins dominated by noise | Noise dominated (total time) | Noise dominated (detector-on time) | Marked lightcurve |
|---|---|---|---|---|---|---|---|
| A | 6992 | 4930 | 70 | 70 | 1.00% | 1.42% | 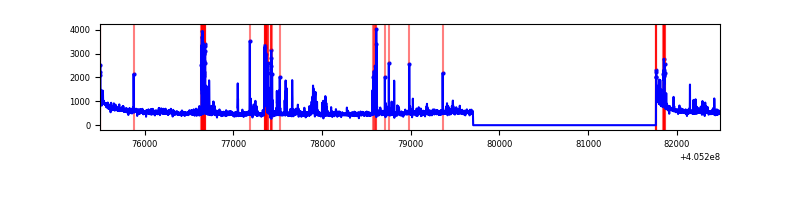 |
| B | 6992 | 4930 | 29 | 29 | 0.41% | 0.59% | 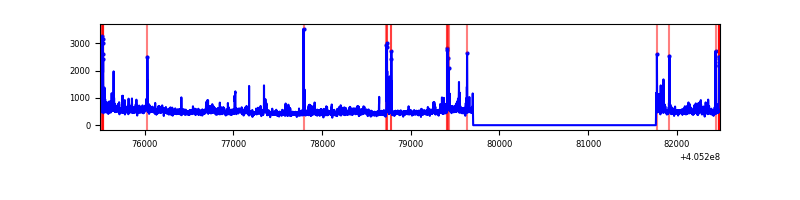 |
| C | 6992 | 4930 | 25 | 25 | 0.36% | 0.51% | 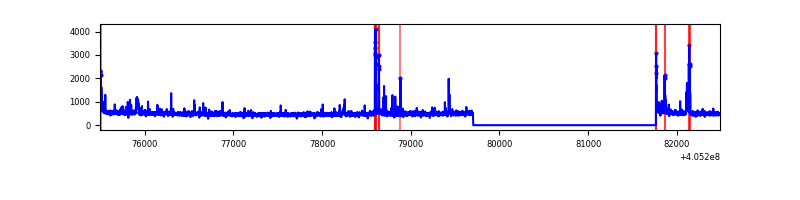 |
| D | 6992 | 4930 | 74 | 74 | 1.06% | 1.50% | 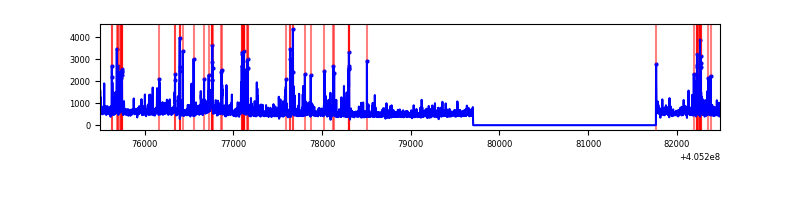 |
Top three noisy pixels from each quadrant. If the there are fewer than three noisy pixels in the level2.evt file, extra rows are filled as -1
| Pixel properties | Quadrant properties | ||||||
|---|---|---|---|---|---|---|---|
| Quadrant | DetID | PixID | Counts | Sigma | Mean | Median | Sigma |
| A | 10 | 83 | 394258 | 3579.33 | 546 | 536 | 110.0 |
| A | 13 | 248 | 223413 | 2026.18 | 546 | 536 | 110.0 |
| A | 9 | 143 | 127578 | 1154.94 | 546 | 536 | 110.0 |
| B | 4 | 171 | 123086 | 1195.1 | 546 | 533 | 102.5 |
| B | 0 | 183 | 97371 | 944.34 | 546 | 533 | 102.5 |
| B | 0 | 155 | 84600 | 819.8 | 546 | 533 | 102.5 |
| C | 15 | 214 | 209300 | 1661.59 | 542 | 548 | 125.6 |
| C | 1 | 23 | 85895 | 679.33 | 542 | 548 | 125.6 |
| C | 5 | 250 | 80527 | 636.6 | 542 | 548 | 125.6 |
| D | 2 | 250 | 290717 | 2236.22 | 538 | 522 | 129.8 |
| D | 12 | 235 | 232212 | 1785.38 | 538 | 522 | 129.8 |
| D | 2 | 153 | 200400 | 1540.24 | 538 | 522 | 129.8 |
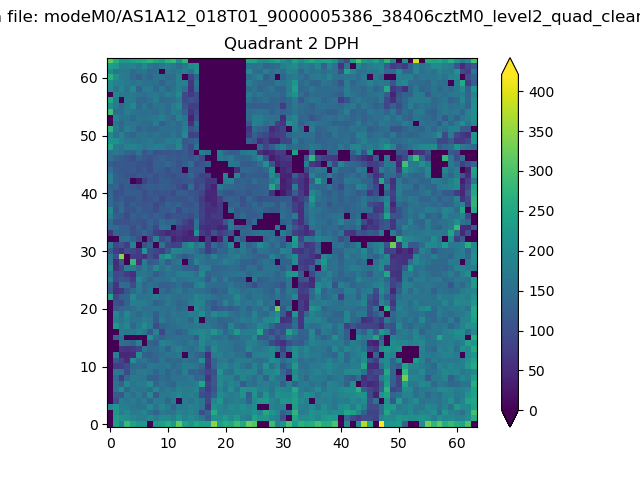
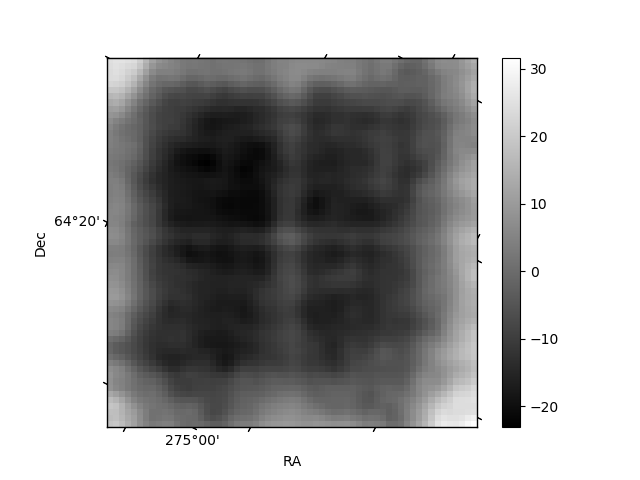
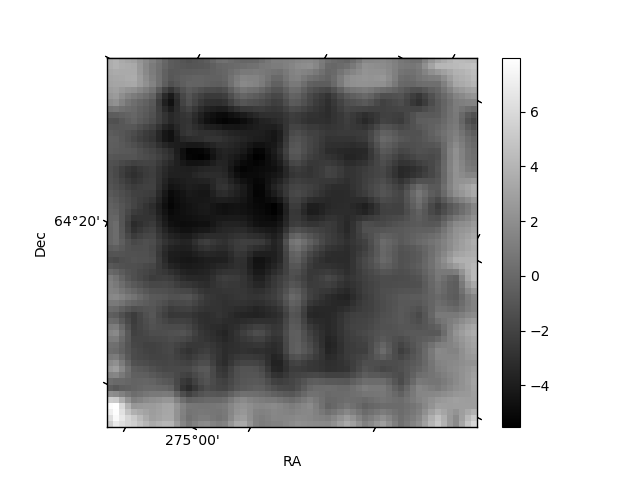
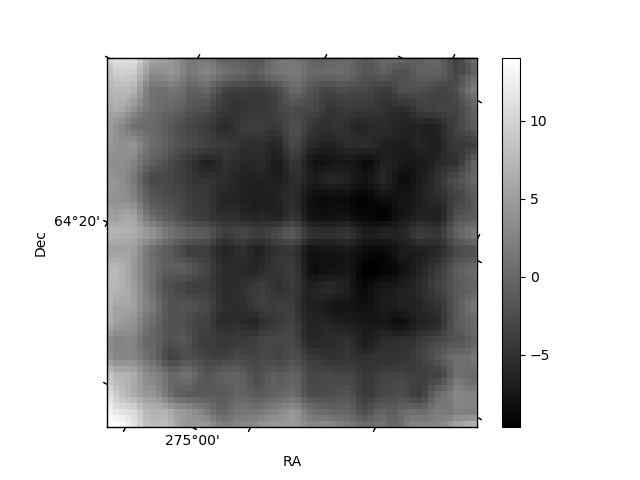
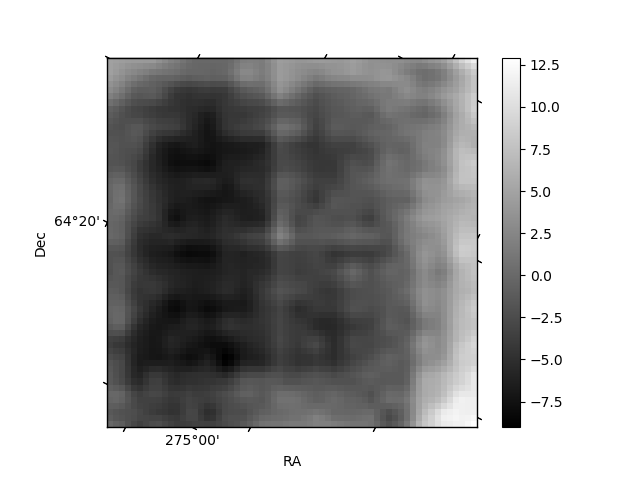
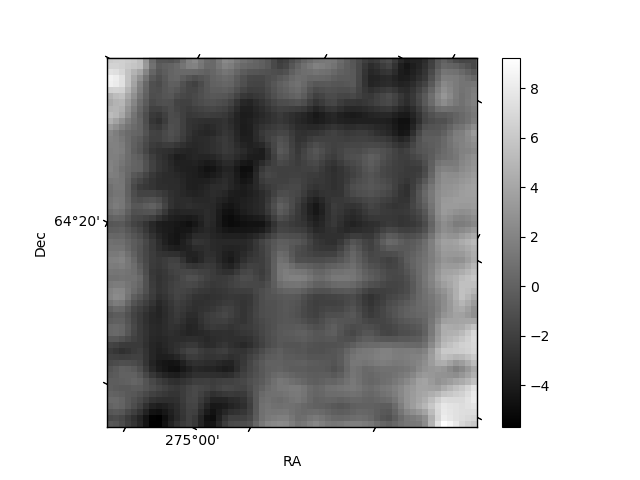
Histogram calculated using DETX and DETY for each event in the final _common_clean file
| Quadrant A | 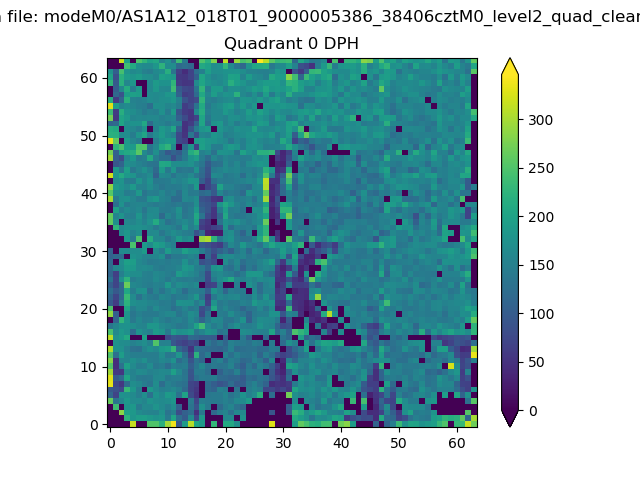 |
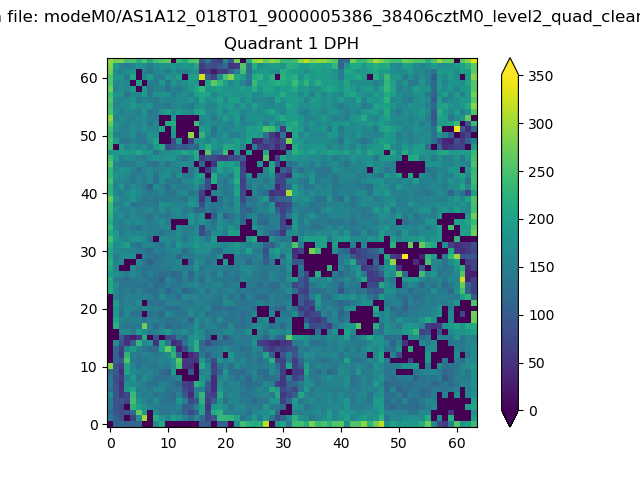 |
Quadrant B |
|---|---|---|---|
| Quadrant D | 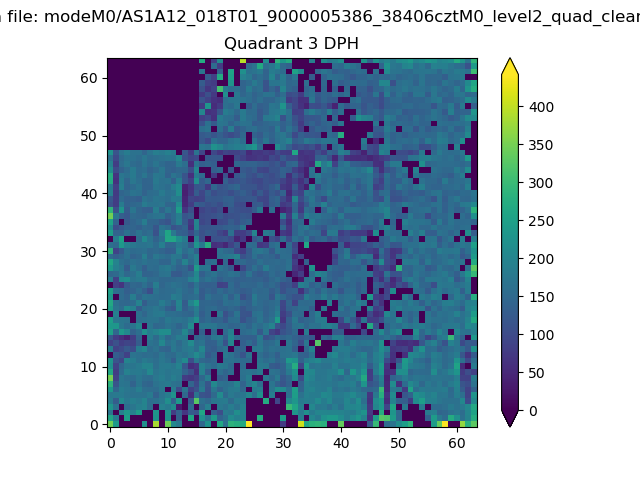 |
 |
Quadrant C |
| Plot type | Count rate plots | Images |
|---|---|---|
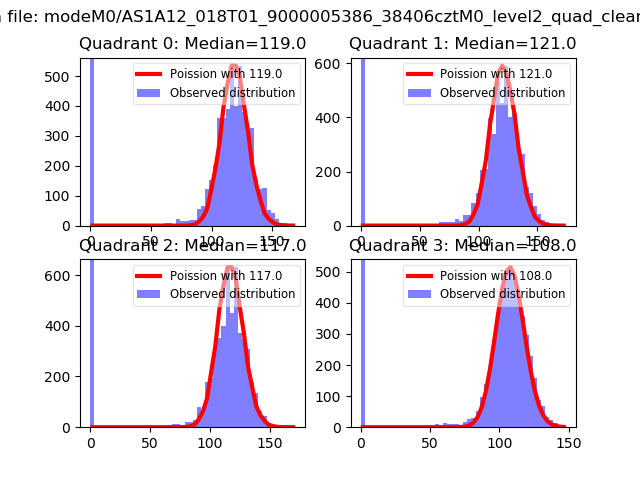
| Comparison with Poisson distribution Blue bars denote a histogram of data divided into 1 sec bins. Red curve is a Poisson curve with rate = median count rate of data. |
 |
 |
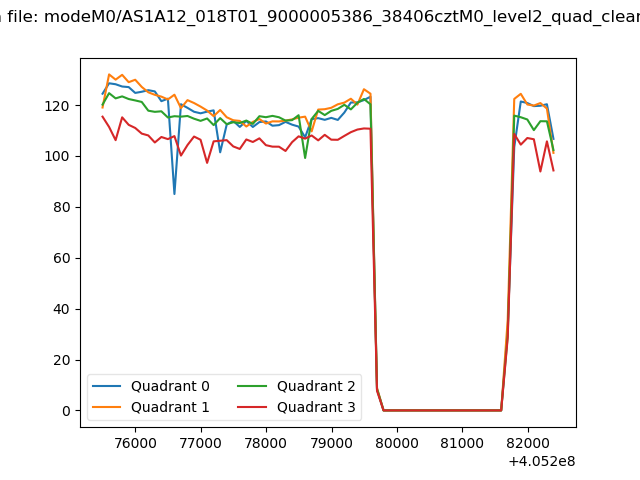
| Quadrant-wise count rates Data is divided into 100 sec bins |
 |
|
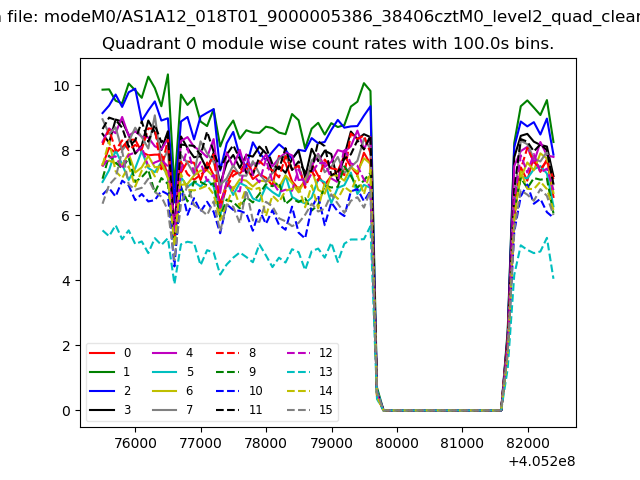
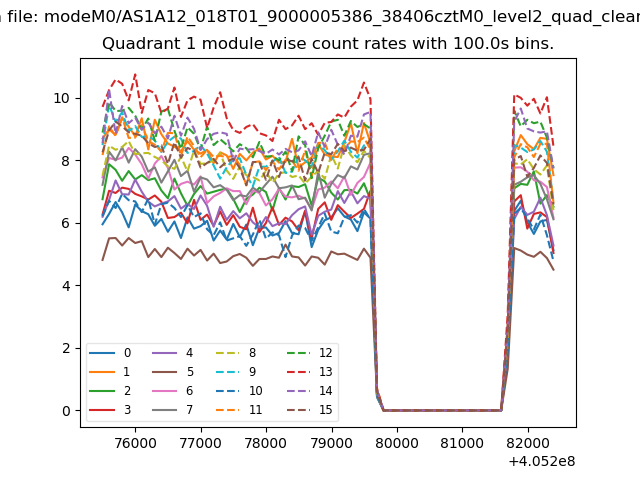
| Module-wise count rates for Quadrant A Data is divided into 100 sec bins |
 |
 |
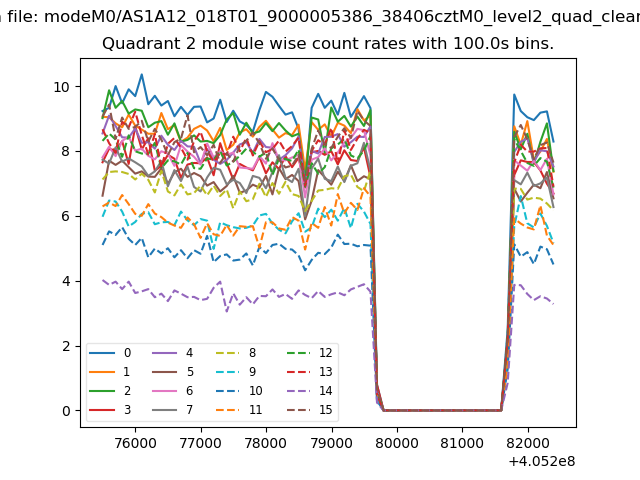
| Module-wise count rates for Quadrant B Data is divided into 100 sec bins |
 |
 |
| Module-wise count rates for Quadrant C Data is divided into 100 sec bins |
 |
 |
| Module-wise count rates for Quadrant D Data is divided into 100 sec bins |
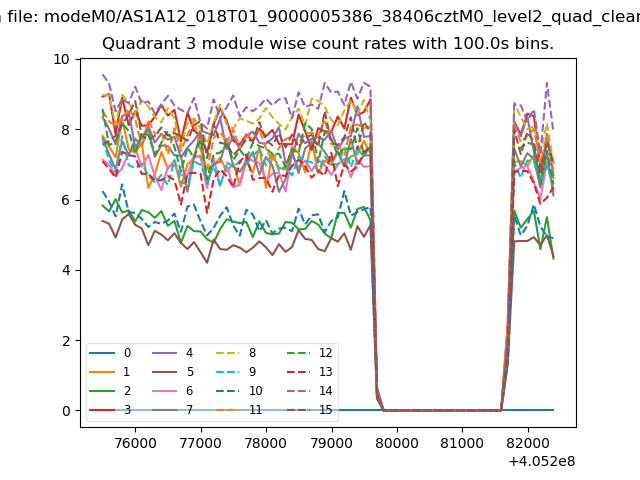 |
 |
| Parameter | Plot |
|---|---|
| CZT HV Monitor | 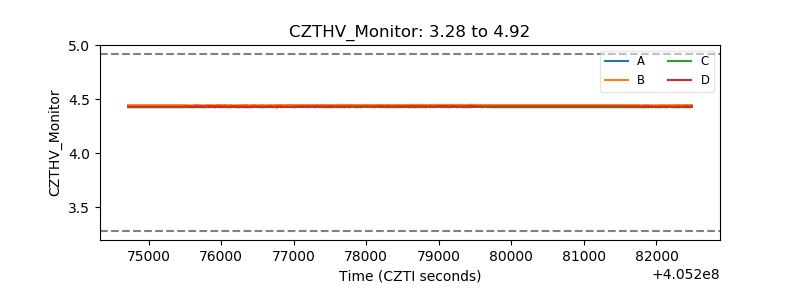 |
| D_VDD | 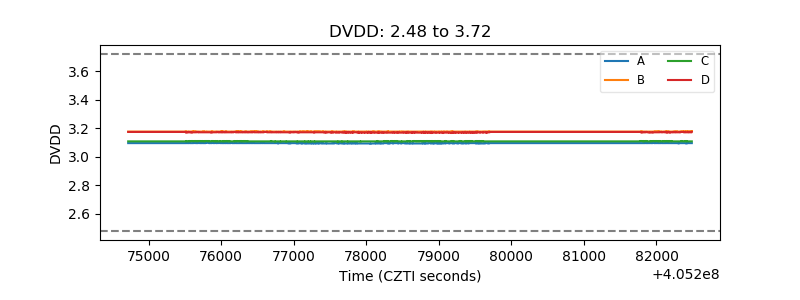 |
| Temperature 1 | 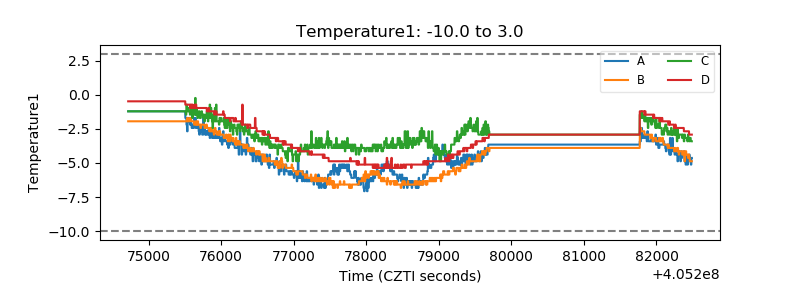 |
| Veto HV Monitor | 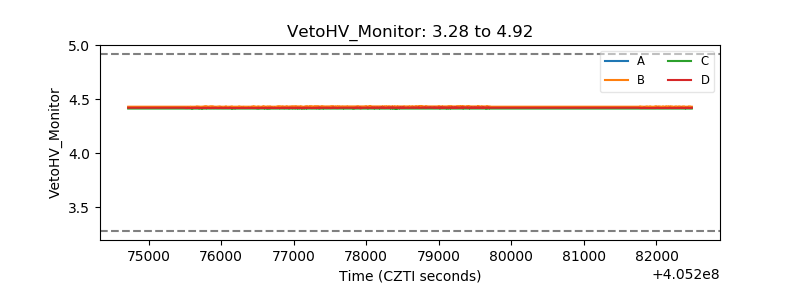 |
| Veto LLD | 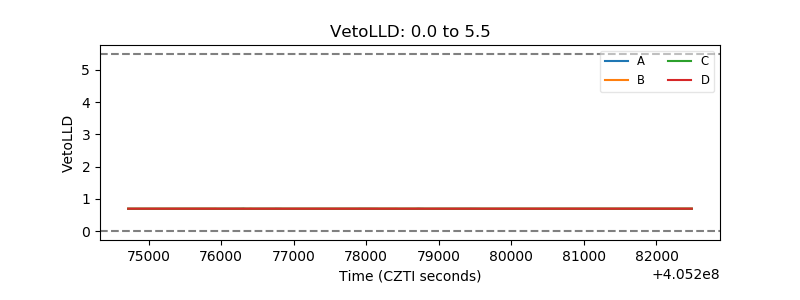 |
| Alpha Counter | 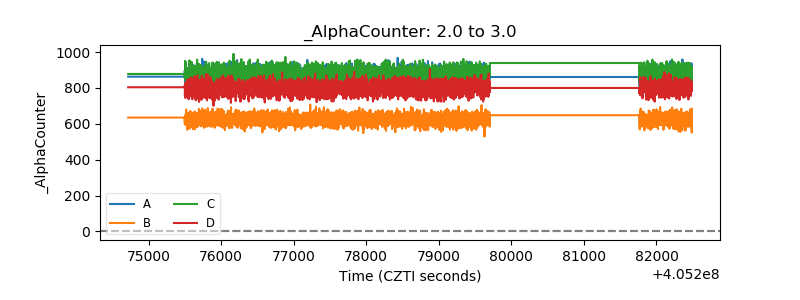 |
| _CPM_Rate | 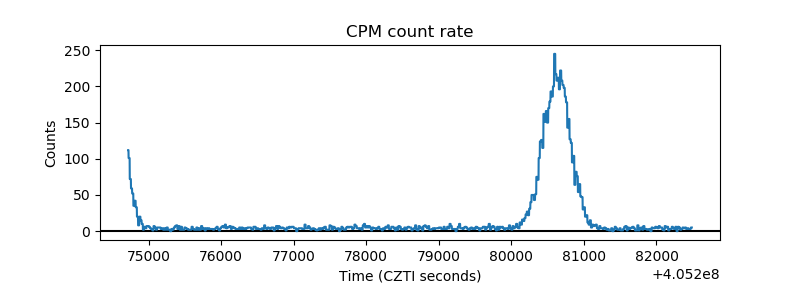 |
| CZT Counter | 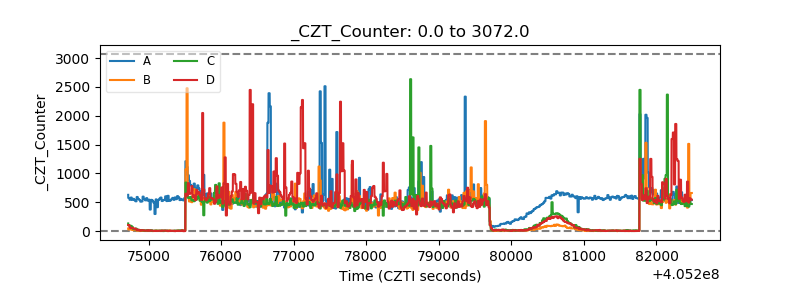 |
| +2.5 Volts monitor | 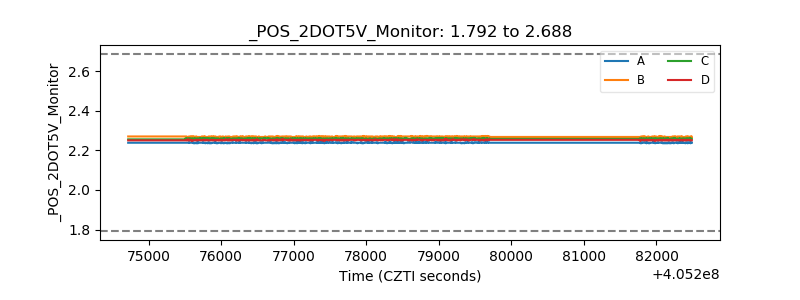 |
| +5 Volts monitor | 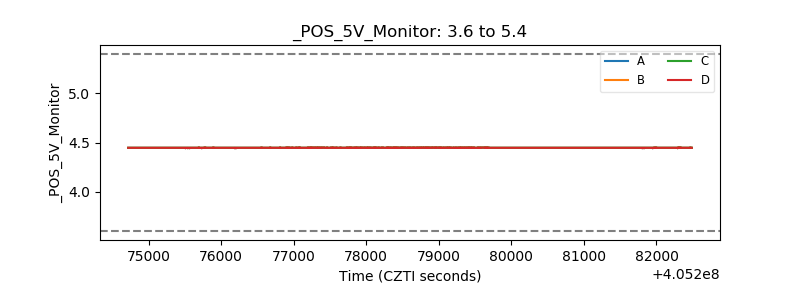 |
| _ROLL_ROT | 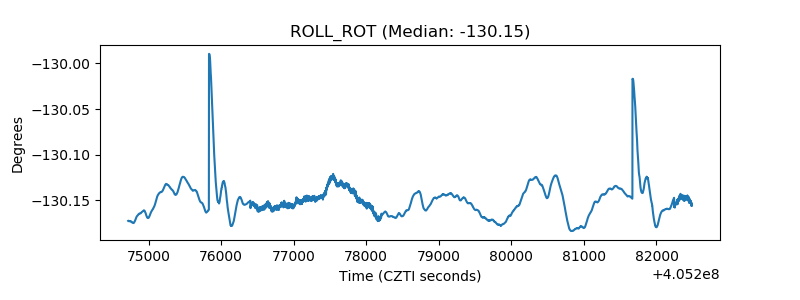 |
| _Roll_DEC | 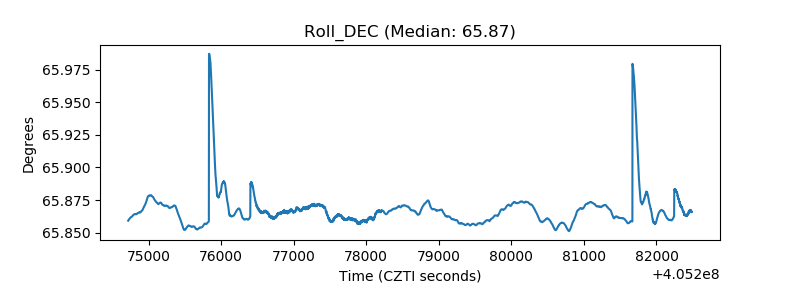 |
| _Roll_RA | 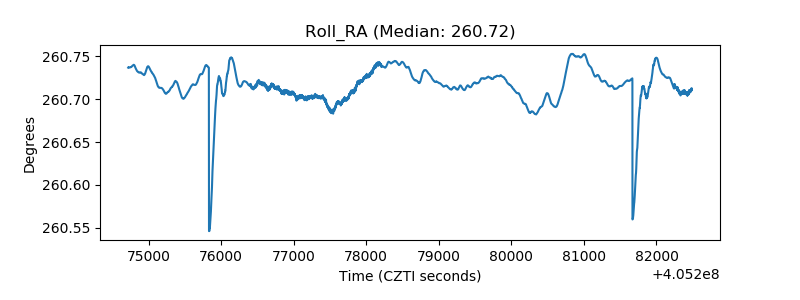 |
| Veto Counter | 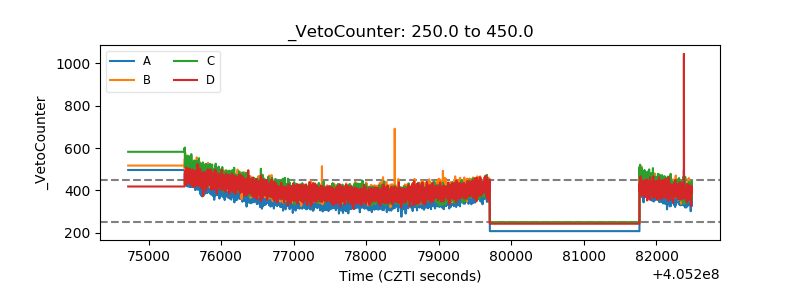 |