| Param | Original file | Final file |
|---|---|---|
| Filename | modeM0/AS1A12_018T01_9000005386_38407cztM0_level2.fits | modeM0/AS1A12_018T01_9000005386_38407cztM0_level2_quad_clean.evt |
| Size (bytes) | 318,461,760 | 89,815,680 |
| Size | 303.7 MB | 85.7 MB |
| Events in quadrant A | 2,980,833 | 600,401 |
| Events in quadrant B | 2,776,822 | 613,231 |
| Events in quadrant C | 2,604,469 | 590,102 |
| Events in quadrant D | 3,012,559 | 544,547 |
| Mode SS | |||
|---|---|---|---|
| Quadrant | BADHDUFLAG | Total packets | Discarded packets |
| A | 0 | 106 | 0 |
| B | 0 | 106 | 0 |
| C | 0 | 106 | 0 |
| D | 0 | 106 | 0 |
| Mode M9 | |||
|---|---|---|---|
| Quadrant | BADHDUFLAG | Total packets | Discarded packets |
| A | 0 | 28 | 0 |
| B | 0 | 28 | 0 |
| C | 0 | 28 | 0 |
| D | 0 | 29 | 0 |
| Mode M0 | |||
|---|---|---|---|
| Quadrant | BADHDUFLAG | Total packets | Discarded packets |
| A | 0 | 12205 | 3 |
| B | 0 | 11853 | 2 |
| C | 0 | 11099 | 2 |
| D | 0 | 12505 | 2 |
| Quadrant | Total seconds | Saturated seconds | Saturation percentage |
|---|---|---|---|
| A | 5310 | 56 | 1.054614% |
| B | 5310 | 34 | 0.640301% |
| C | 5310 | 20 | 0.376648% |
| D | 5310 | 60 | 1.129944% |
Noise dominated data is calculated using 1-second bins in cleaned event files. If a bin has >2000 counts, and if more than 50% of those come from <1% of pixels, then it is considered to be noise-dominated and hence unusable.
| Quadrant | # 1 sec bins | Bins with >0 counts | Bins with >2000 counts | High rate bins dominated by noise | Noise dominated (total time) | Noise dominated (detector-on time) | Marked lightcurve |
|---|---|---|---|---|---|---|---|
| A | 7131 | 5311 | 32 | 32 | 0.45% | 0.60% | 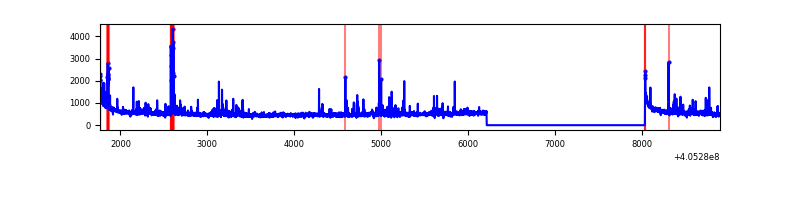 |
| B | 7131 | 5311 | 23 | 23 | 0.32% | 0.43% | 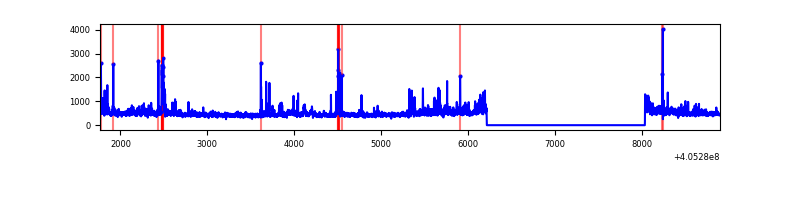 |
| C | 7131 | 5311 | 12 | 12 | 0.17% | 0.23% | 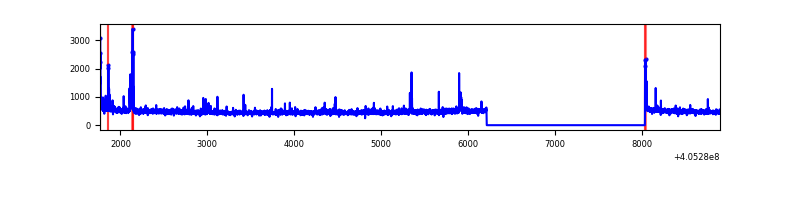 |
| D | 7131 | 5311 | 47 | 47 | 0.66% | 0.88% | 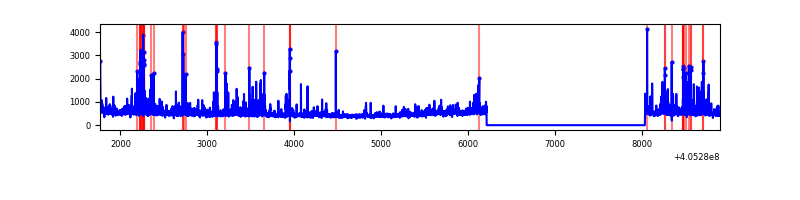 |
Top three noisy pixels from each quadrant. If the there are fewer than three noisy pixels in the level2.evt file, extra rows are filled as -1
| Pixel properties | Quadrant properties | ||||||
|---|---|---|---|---|---|---|---|
| Quadrant | DetID | PixID | Counts | Sigma | Mean | Median | Sigma |
| A | 10 | 83 | 399604 | 3431.78 | 577 | 566 | 116.3 |
| A | 9 | 143 | 113689 | 972.87 | 577 | 566 | 116.3 |
| A | 13 | 248 | 81286 | 694.2 | 577 | 566 | 116.3 |
| B | 0 | 155 | 135892 | 1236.64 | 577 | 562 | 109.4 |
| B | 4 | 171 | 95313 | 865.83 | 577 | 562 | 109.4 |
| B | 0 | 183 | 81153 | 736.44 | 577 | 562 | 109.4 |
| C | 15 | 214 | 224672 | 1673.17 | 572 | 576 | 133.9 |
| C | 5 | 250 | 93741 | 695.6 | 572 | 576 | 133.9 |
| C | 0 | 10 | 31504 | 230.92 | 572 | 576 | 133.9 |
| D | 2 | 250 | 215178 | 1573.79 | 567 | 551 | 136.4 |
| D | 12 | 6 | 138072 | 1008.4 | 567 | 551 | 136.4 |
| D | 2 | 153 | 137409 | 1003.54 | 567 | 551 | 136.4 |
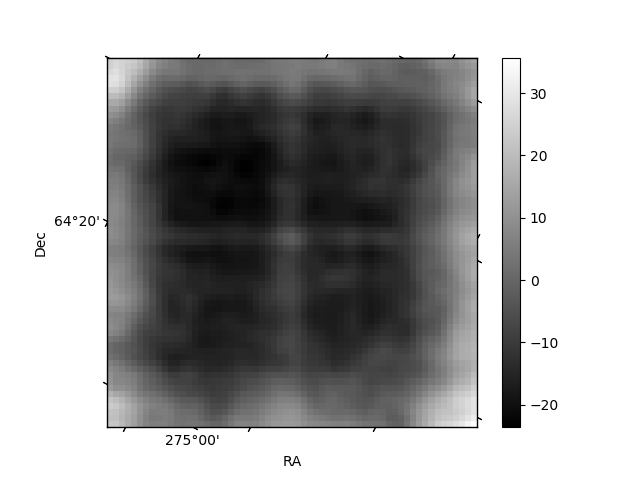
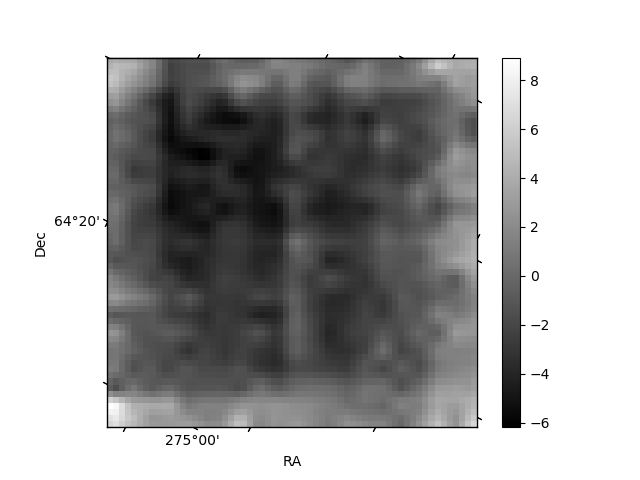
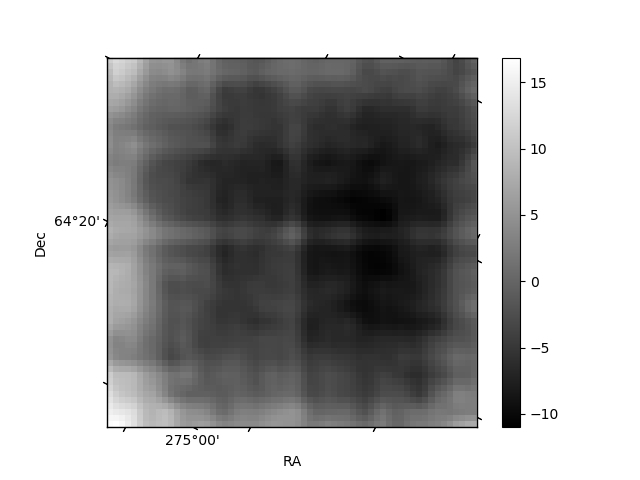
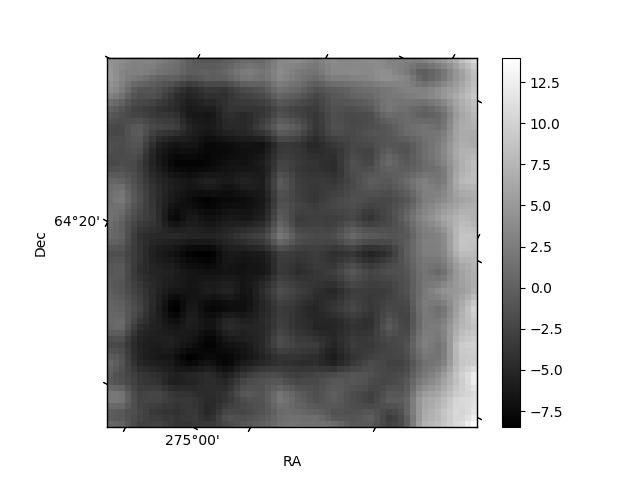
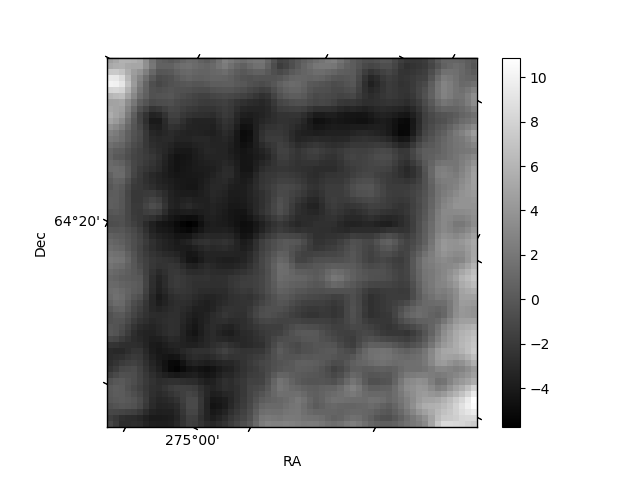
Histogram calculated using DETX and DETY for each event in the final _common_clean file
| Quadrant A | 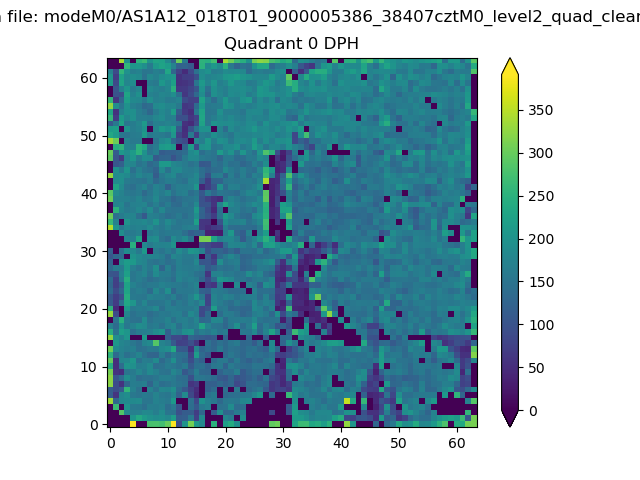 |
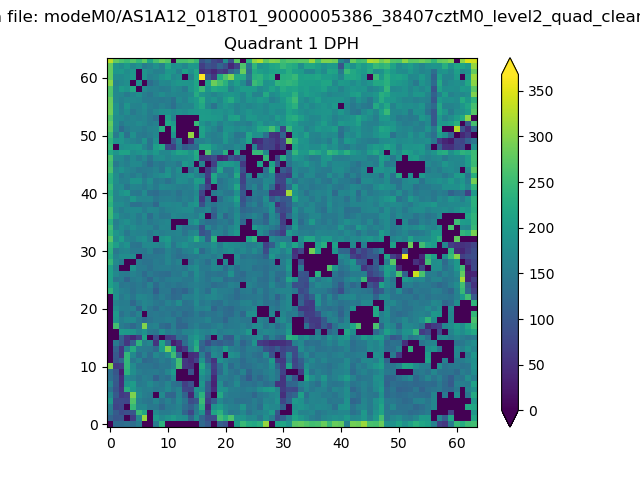 |
Quadrant B |
|---|---|---|---|
| Quadrant D | 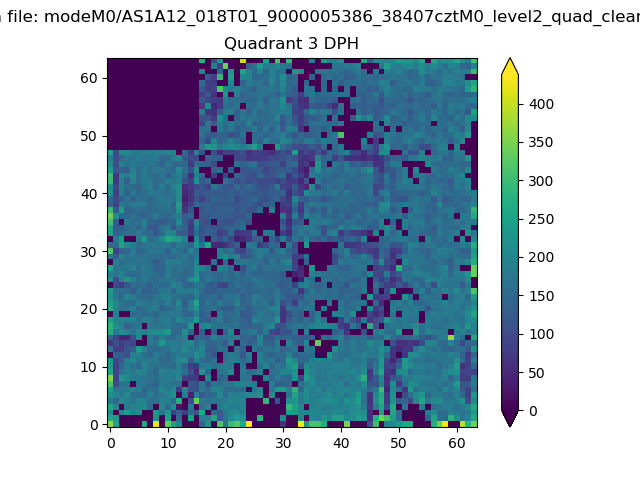 |
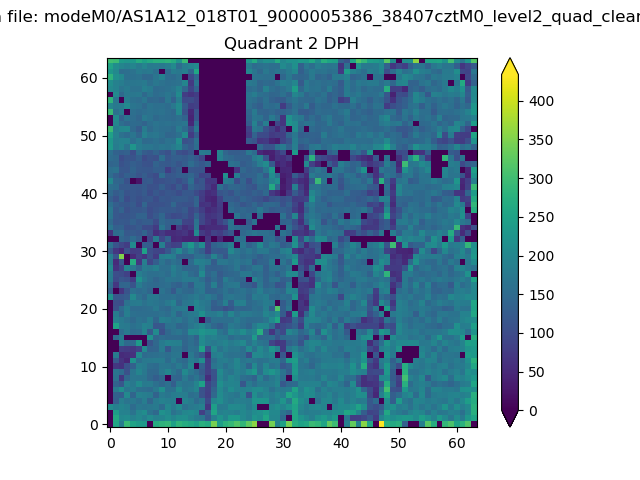 |
Quadrant C |
| Plot type | Count rate plots | Images |
|---|---|---|
| Comparison with Poisson distribution Blue bars denote a histogram of data divided into 1 sec bins. Red curve is a Poisson curve with rate = median count rate of data. |
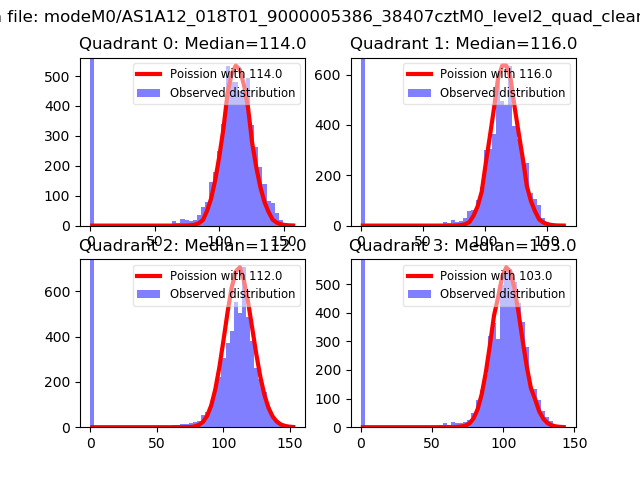 |
 |
| Quadrant-wise count rates Data is divided into 100 sec bins |
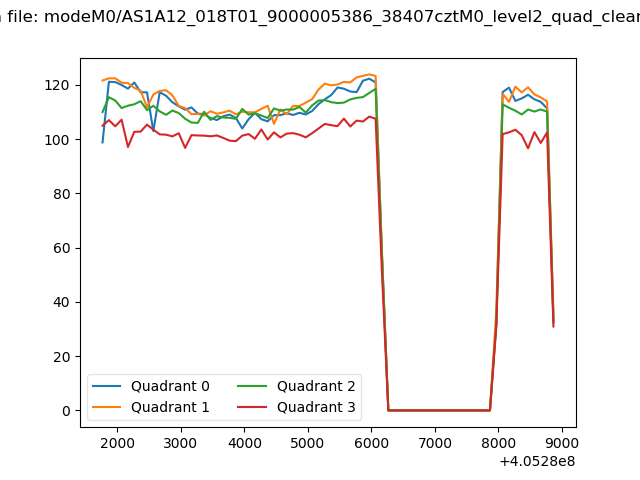 |
|
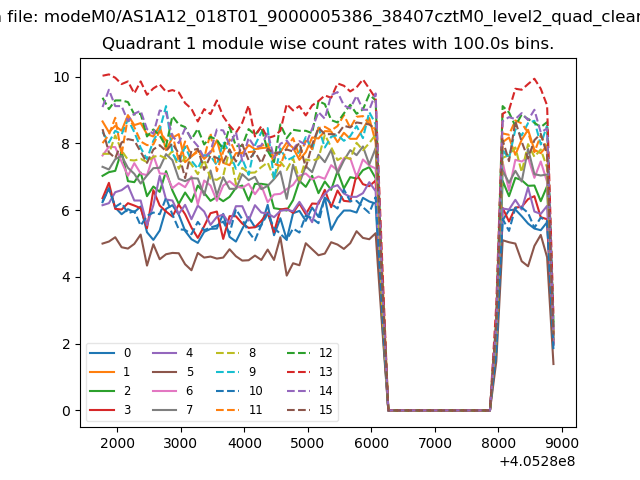
| Module-wise count rates for Quadrant A Data is divided into 100 sec bins |
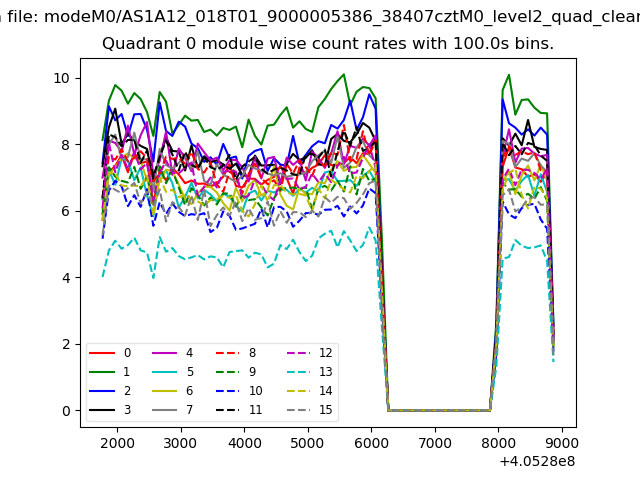 |
 |
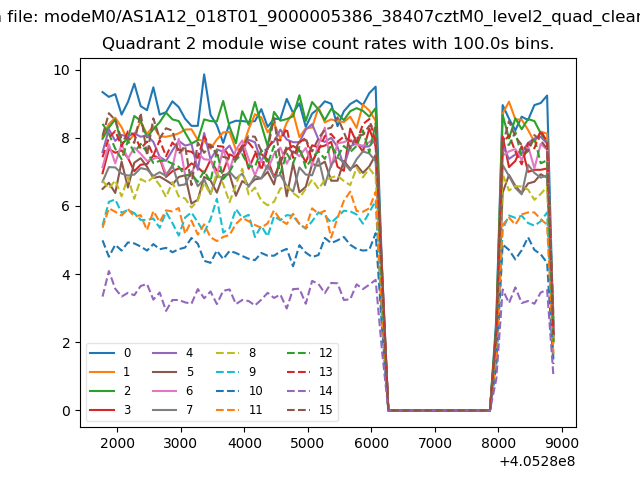
| Module-wise count rates for Quadrant B Data is divided into 100 sec bins |
 |
 |
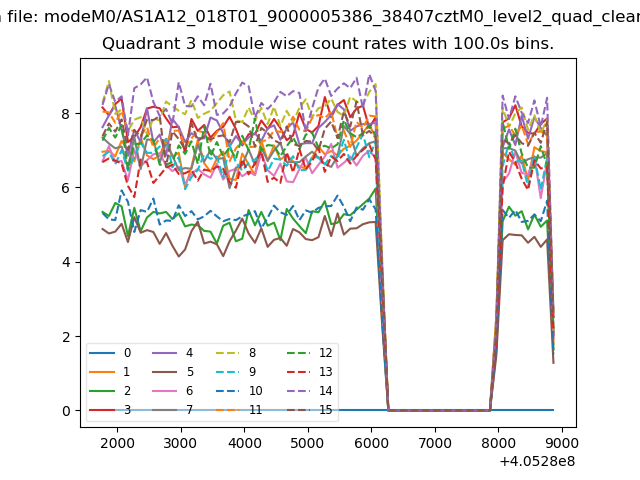
| Module-wise count rates for Quadrant C Data is divided into 100 sec bins |
 |
 |
| Module-wise count rates for Quadrant D Data is divided into 100 sec bins |
 |
 |
| Parameter | Plot |
|---|---|
| CZT HV Monitor | 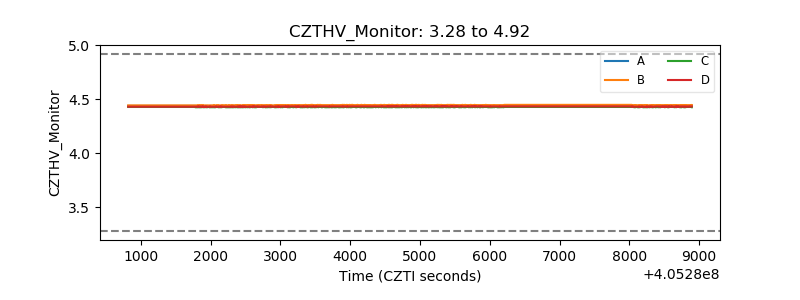 |
| D_VDD | 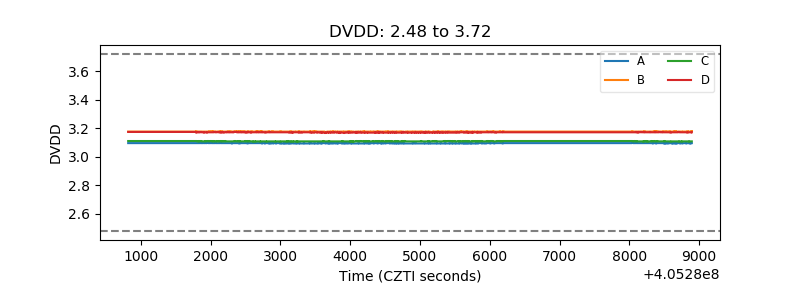 |
| Temperature 1 | 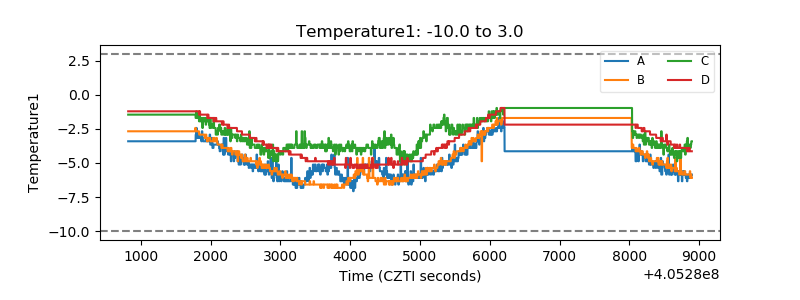 |
| Veto HV Monitor | 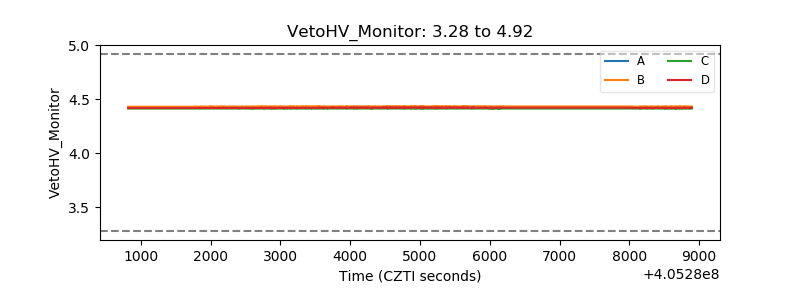 |
| Veto LLD | 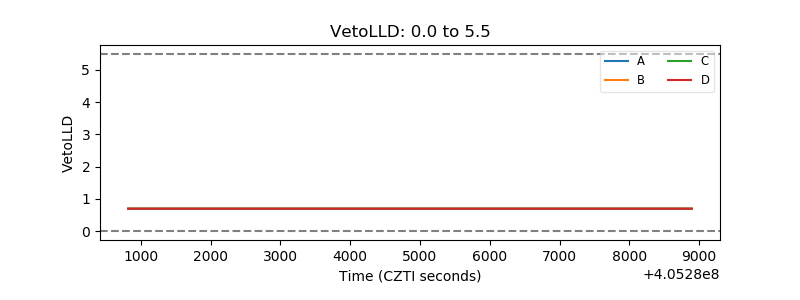 |
| Alpha Counter | 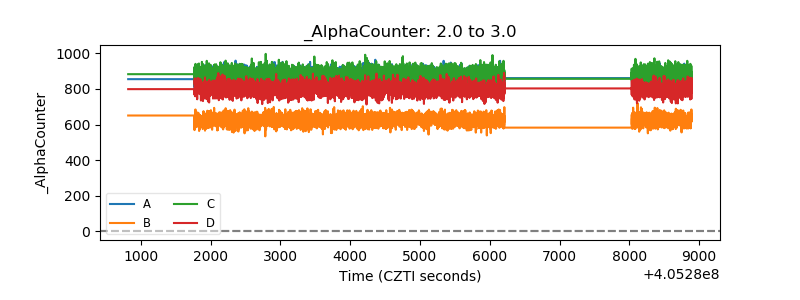 |
| _CPM_Rate | 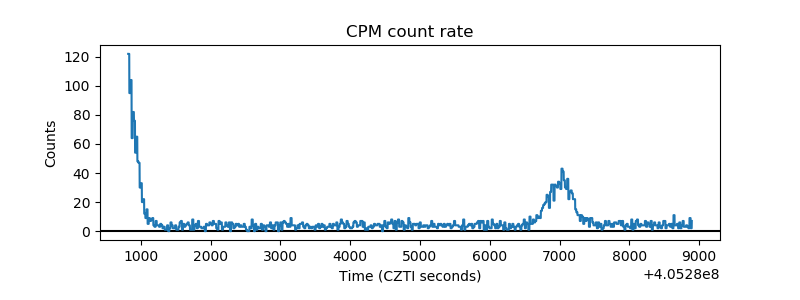 |
| CZT Counter | 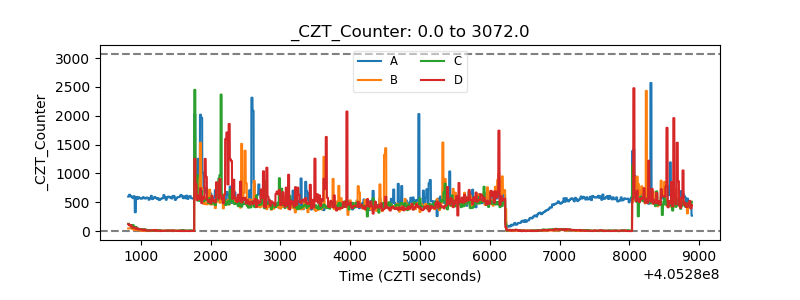 |
| +2.5 Volts monitor | 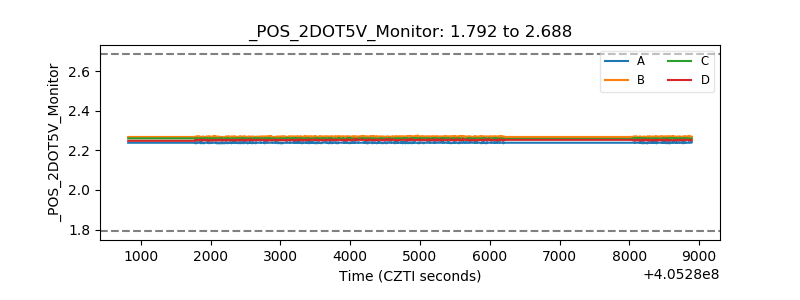 |
| +5 Volts monitor | 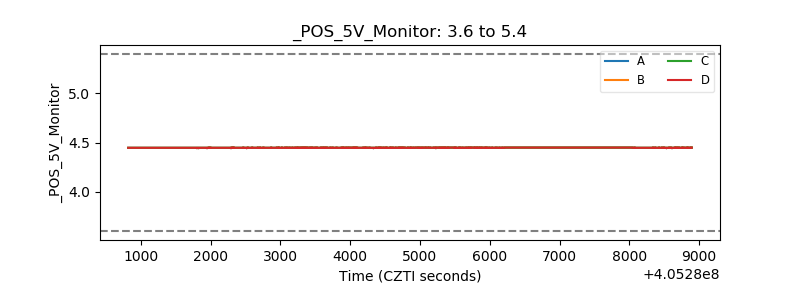 |
| _ROLL_ROT | 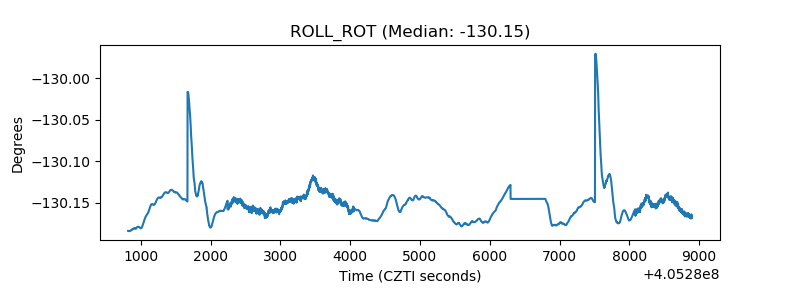 |
| _Roll_DEC | 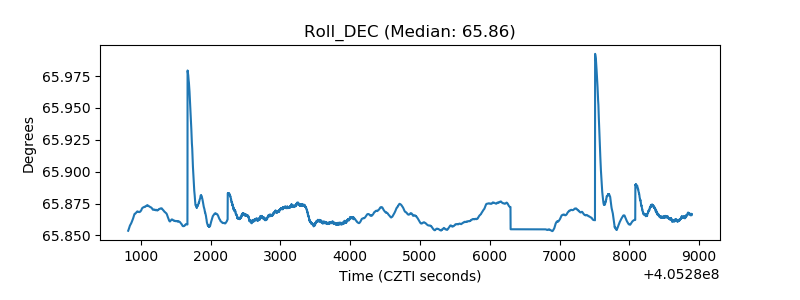 |
| _Roll_RA | 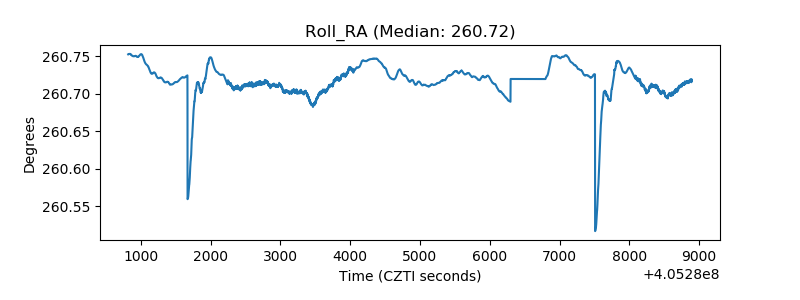 |
| Veto Counter | 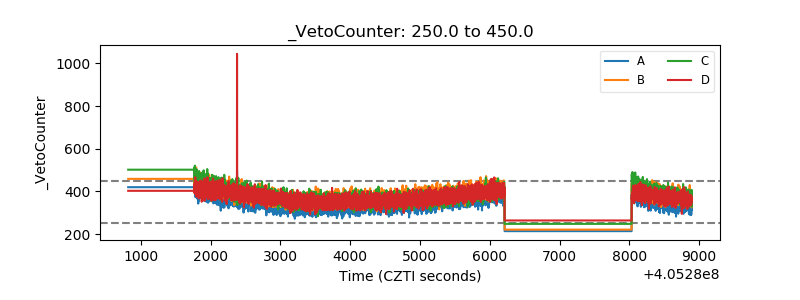 |