| Param | Original file | Final file |
|---|---|---|
| Filename | modeM0/AS1A12_018T01_9000005386_38408cztM0_level2.fits | modeM0/AS1A12_018T01_9000005386_38408cztM0_level2_quad_clean.evt |
| Size (bytes) | 341,035,200 | 93,700,800 |
| Size | 325.2 MB | 89.4 MB |
| Events in quadrant A | 3,101,359 | 624,116 |
| Events in quadrant B | 2,859,499 | 639,635 |
| Events in quadrant C | 2,660,014 | 616,213 |
| Events in quadrant D | 3,564,495 | 563,269 |
| Mode SS | |||
|---|---|---|---|
| Quadrant | BADHDUFLAG | Total packets | Discarded packets |
| A | 0 | 114 | 0 |
| B | 0 | 114 | 0 |
| C | 0 | 114 | 0 |
| D | 0 | 114 | 0 |
| Mode M9 | |||
|---|---|---|---|
| Quadrant | BADHDUFLAG | Total packets | Discarded packets |
| A | 0 | 27 | 0 |
| B | 0 | 27 | 0 |
| C | 0 | 27 | 0 |
| D | 0 | 28 | 0 |
| Mode M0 | |||
|---|---|---|---|
| Quadrant | BADHDUFLAG | Total packets | Discarded packets |
| A | 0 | 12799 | 3 |
| B | 0 | 12298 | 2 |
| C | 0 | 11442 | 2 |
| D | 0 | 14327 | 2 |
| Quadrant | Total seconds | Saturated seconds | Saturation percentage |
|---|---|---|---|
| A | 5631 | 76 | 1.349671% |
| B | 5631 | 25 | 0.443971% |
| C | 5631 | 6 | 0.106553% |
| D | 5631 | 124 | 2.202096% |
Noise dominated data is calculated using 1-second bins in cleaned event files. If a bin has >2000 counts, and if more than 50% of those come from <1% of pixels, then it is considered to be noise-dominated and hence unusable.
| Quadrant | # 1 sec bins | Bins with >0 counts | Bins with >2000 counts | High rate bins dominated by noise | Noise dominated (total time) | Noise dominated (detector-on time) | Marked lightcurve |
|---|---|---|---|---|---|---|---|
| A | 7124 | 5632 | 48 | 48 | 0.67% | 0.85% | 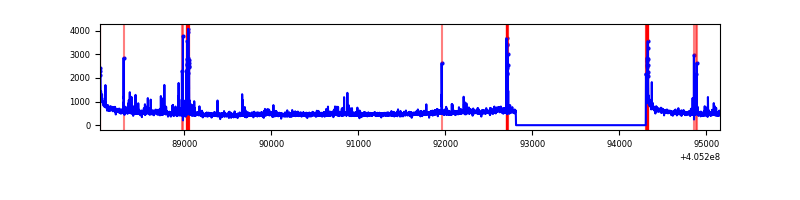 |
| B | 7124 | 5632 | 9 | 9 | 0.13% | 0.16% | 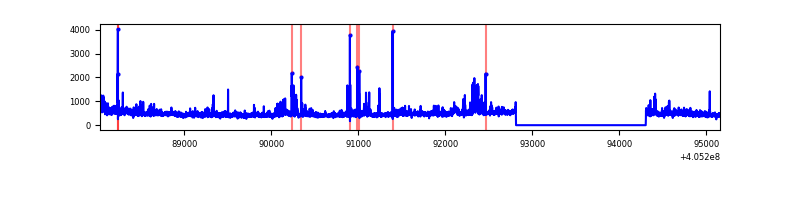 |
| C | 7124 | 5632 | 3 | 3 | 0.04% | 0.05% | 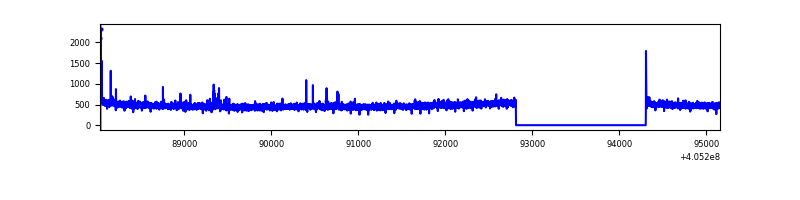 |
| D | 7124 | 5632 | 98 | 98 | 1.38% | 1.74% | 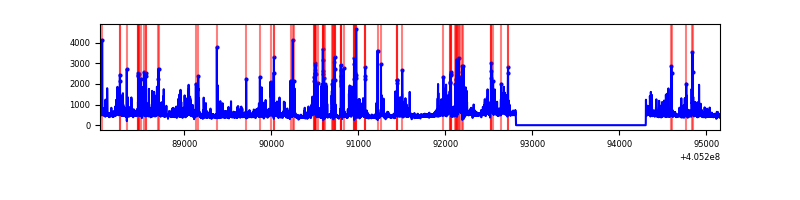 |
Top three noisy pixels from each quadrant. If the there are fewer than three noisy pixels in the level2.evt file, extra rows are filled as -1
| Pixel properties | Quadrant properties | ||||||
|---|---|---|---|---|---|---|---|
| Quadrant | DetID | PixID | Counts | Sigma | Mean | Median | Sigma |
| A | 10 | 83 | 402639 | 3218.67 | 614 | 600 | 124.9 |
| A | 13 | 248 | 119472 | 951.67 | 614 | 600 | 124.9 |
| A | 12 | 189 | 89887 | 714.82 | 614 | 600 | 124.9 |
| B | 0 | 155 | 107679 | 904.12 | 613 | 597 | 118.4 |
| B | 0 | 183 | 100285 | 841.69 | 613 | 597 | 118.4 |
| B | 4 | 171 | 91074 | 763.92 | 613 | 597 | 118.4 |
| C | 15 | 214 | 240682 | 1698.75 | 605 | 608 | 141.3 |
| C | 5 | 250 | 19633 | 134.62 | 605 | 608 | 141.3 |
| C | 0 | 10 | 17779 | 121.5 | 605 | 608 | 141.3 |
| D | 2 | 153 | 313459 | 2169.21 | 600 | 584 | 144.2 |
| D | 2 | 250 | 307748 | 2129.62 | 600 | 584 | 144.2 |
| D | 12 | 6 | 149983 | 1035.81 | 600 | 584 | 144.2 |
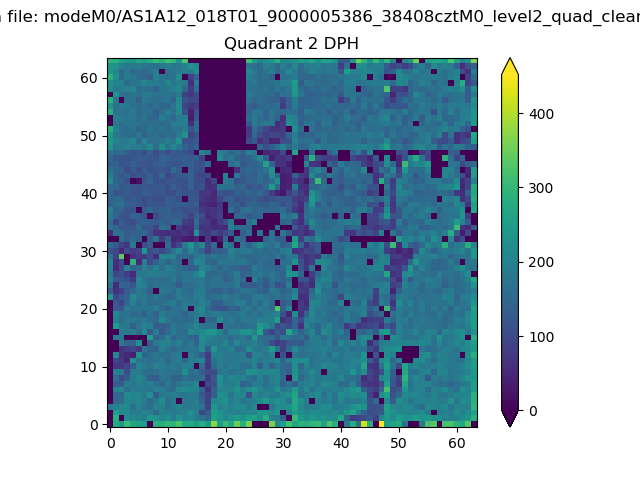
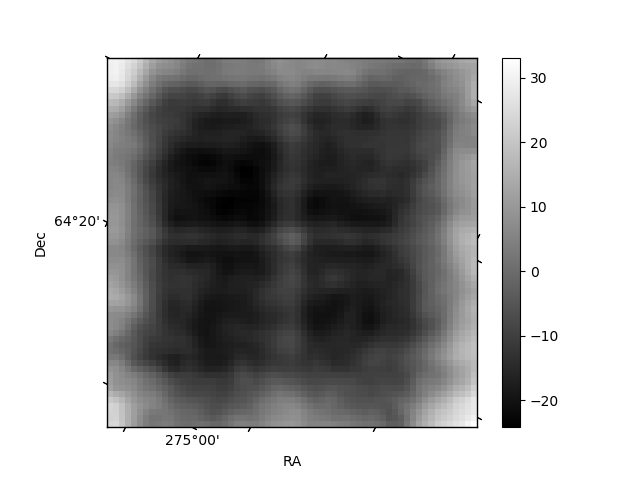
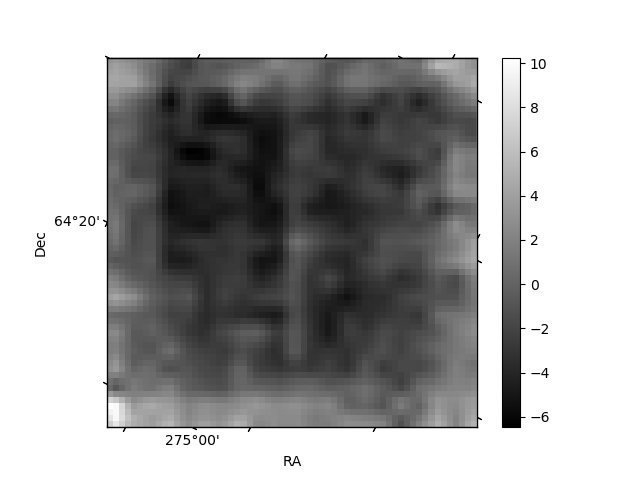
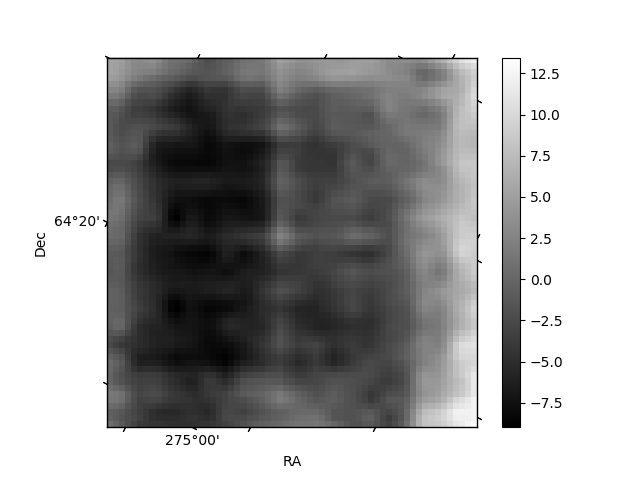
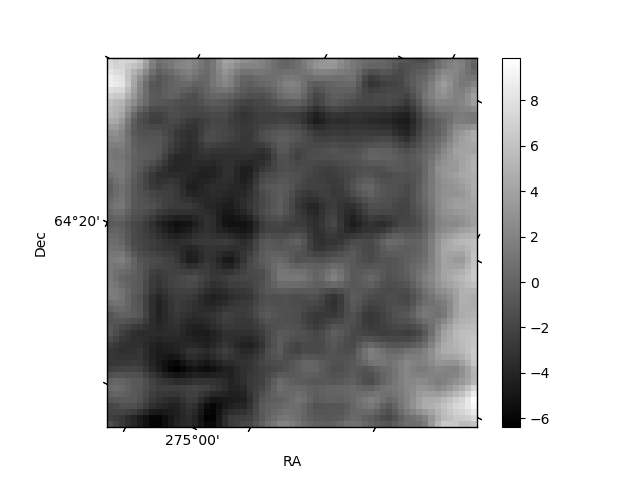
Histogram calculated using DETX and DETY for each event in the final _common_clean file
| Quadrant A | 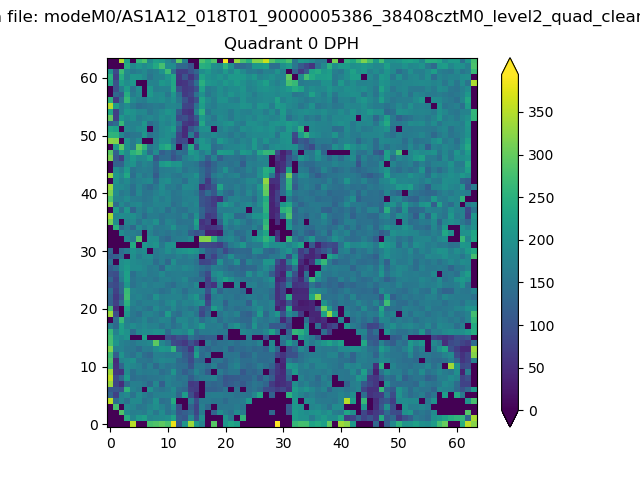 |
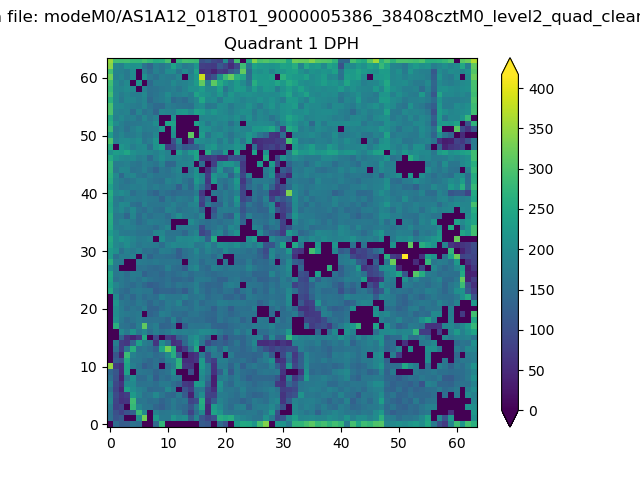 |
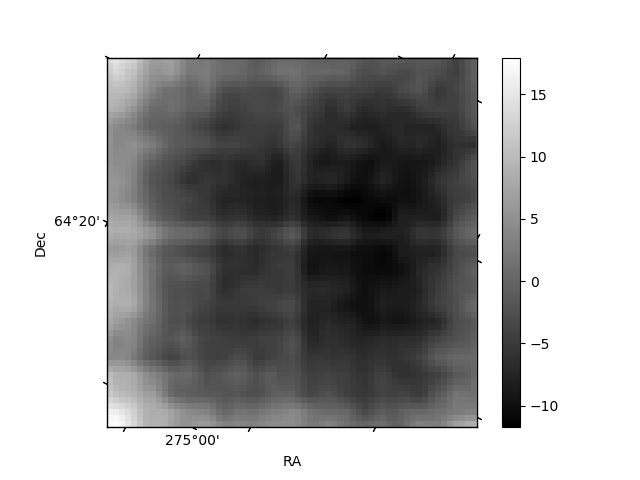
Quadrant B |
|---|---|---|---|
| Quadrant D | 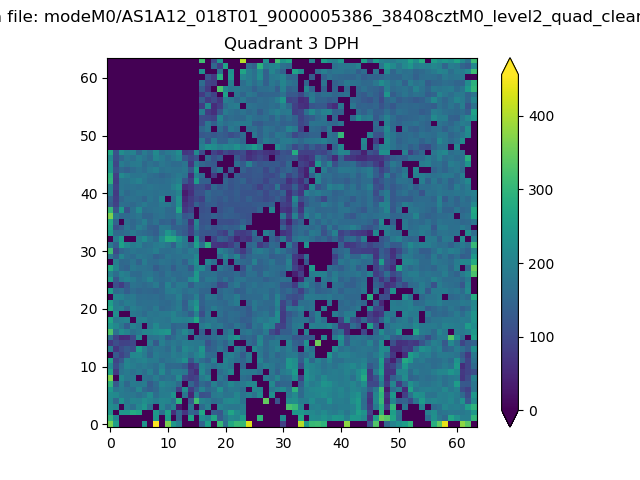 |
 |
Quadrant C |
| Plot type | Count rate plots | Images |
|---|---|---|
| Comparison with Poisson distribution Blue bars denote a histogram of data divided into 1 sec bins. Red curve is a Poisson curve with rate = median count rate of data. |
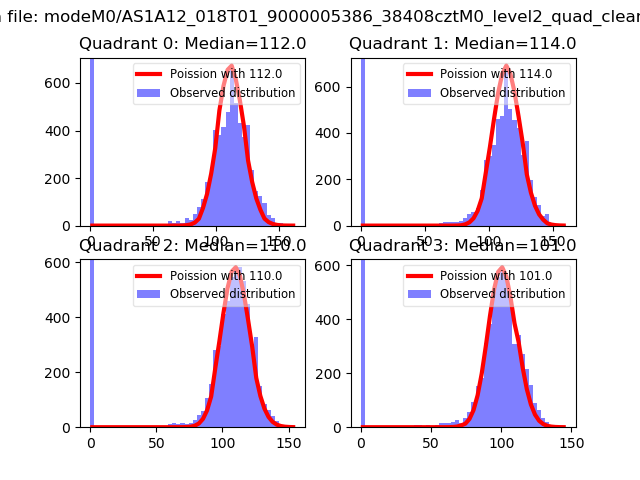 |
 |
| Quadrant-wise count rates Data is divided into 100 sec bins |
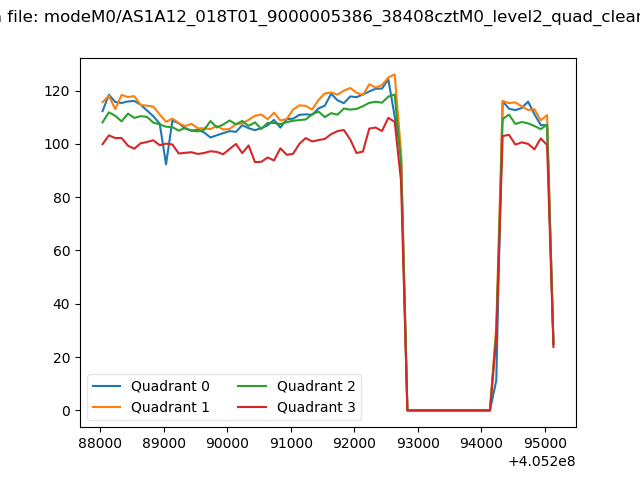 |
|
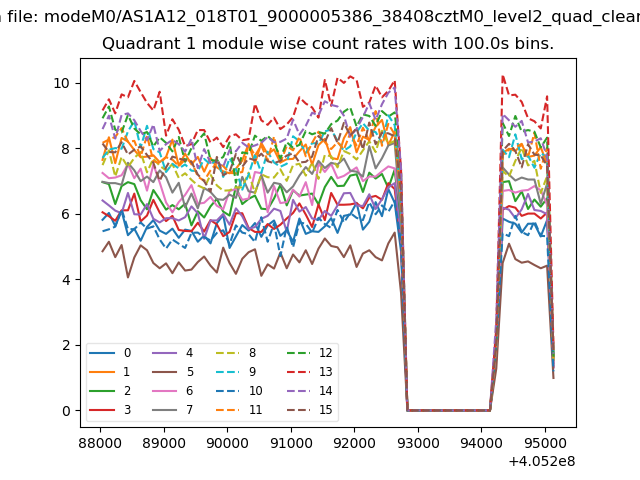
| Module-wise count rates for Quadrant A Data is divided into 100 sec bins |
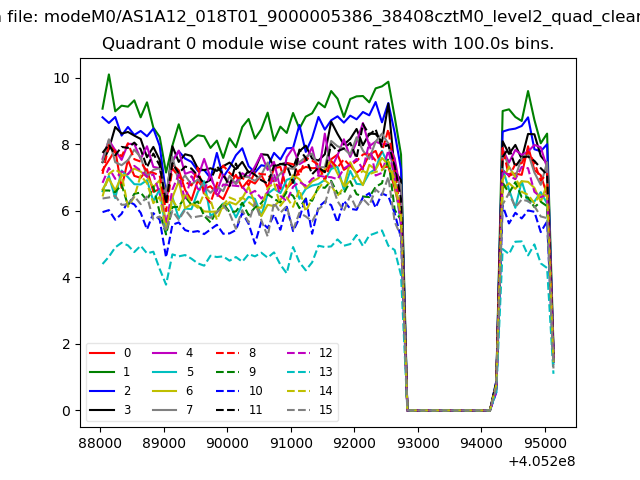 |
 |
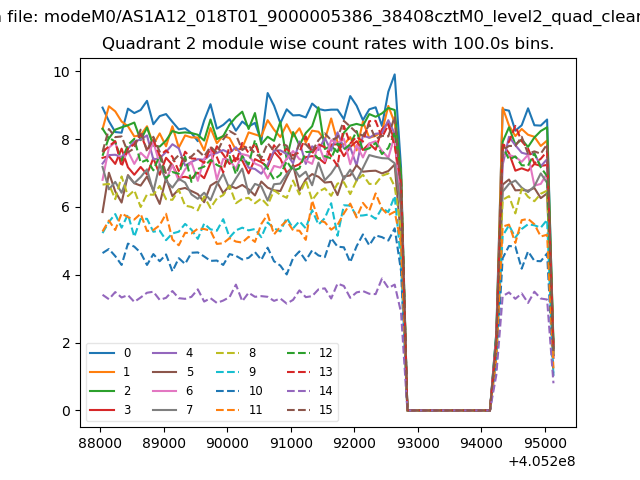
| Module-wise count rates for Quadrant B Data is divided into 100 sec bins |
 |
 |
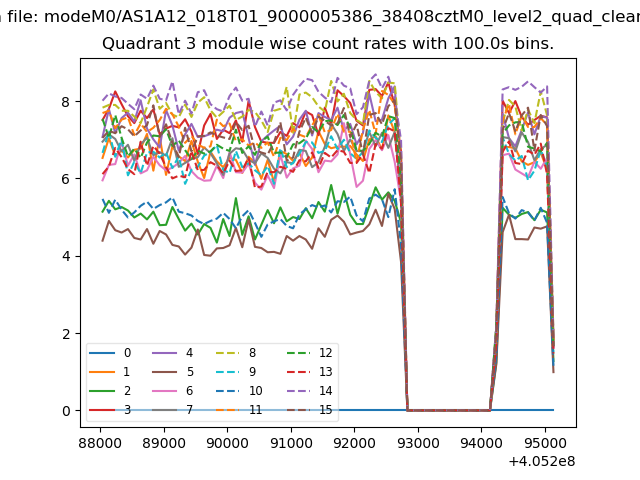
| Module-wise count rates for Quadrant C Data is divided into 100 sec bins |
 |
 |
| Module-wise count rates for Quadrant D Data is divided into 100 sec bins |
 |
 |
| Parameter | Plot |
|---|---|
| CZT HV Monitor | 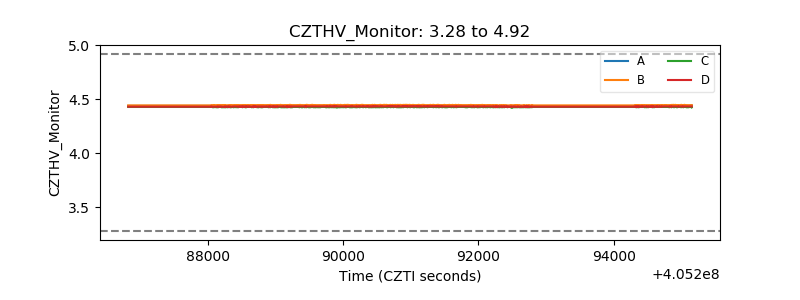 |
| D_VDD | 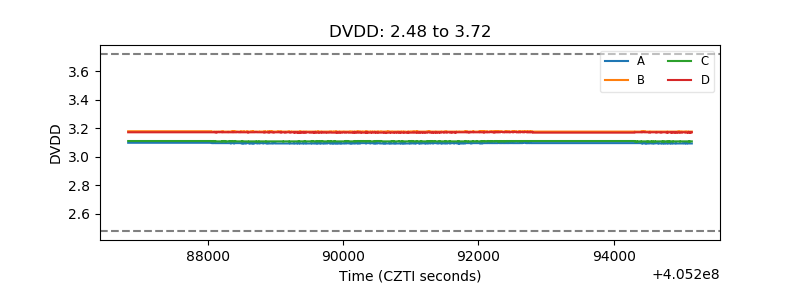 |
| Temperature 1 | 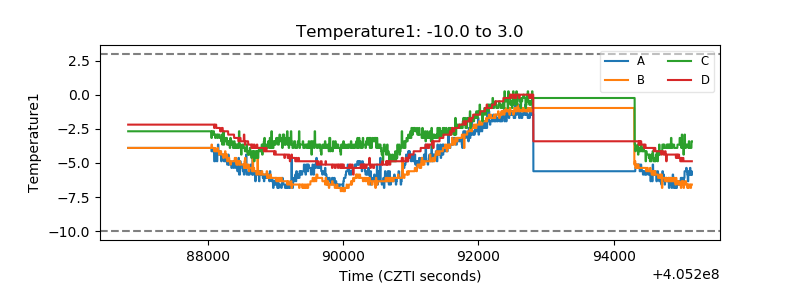 |
| Veto HV Monitor | 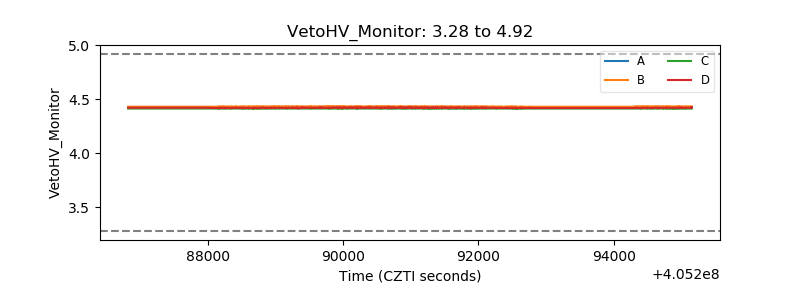 |
| Veto LLD | 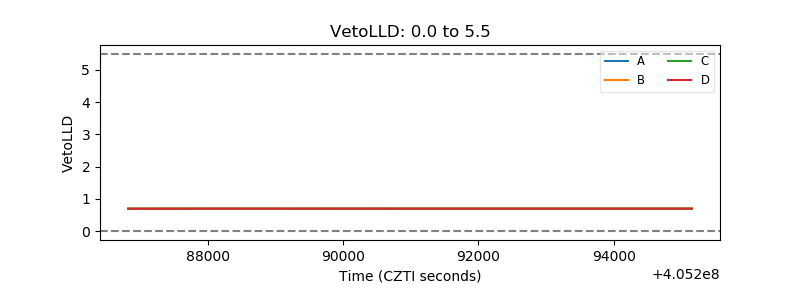 |
| Alpha Counter | 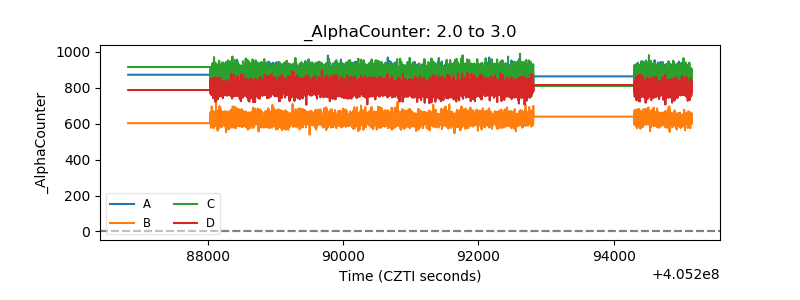 |
| _CPM_Rate | 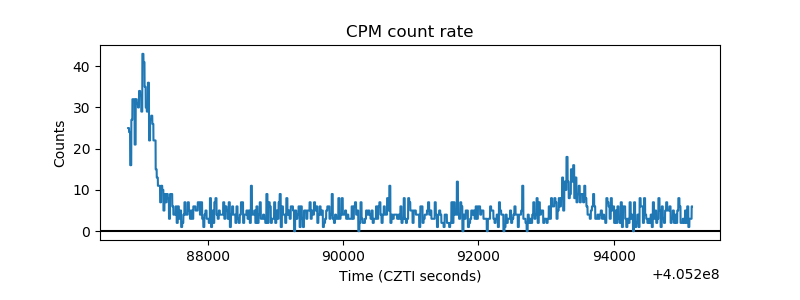 |
| CZT Counter | 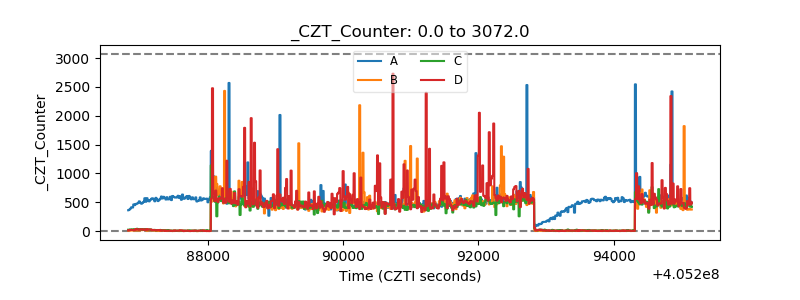 |
| +2.5 Volts monitor | 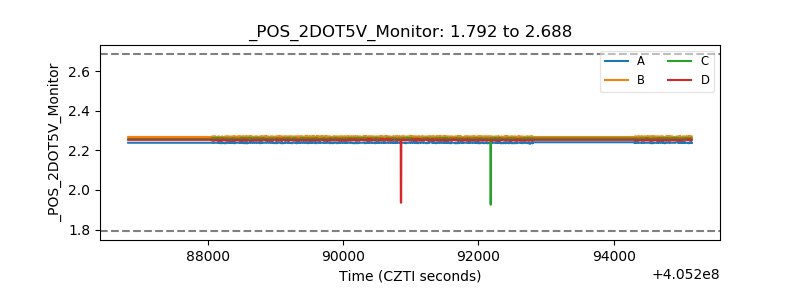 |
| +5 Volts monitor | 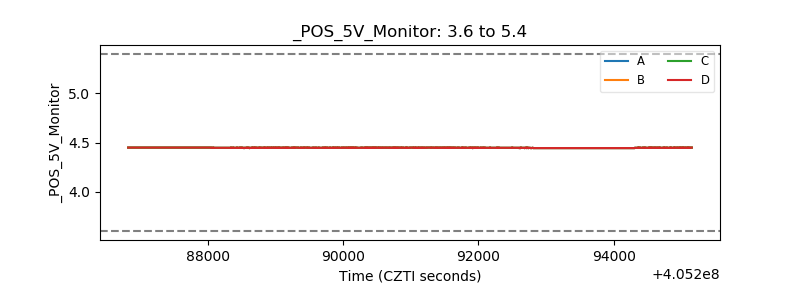 |
| _ROLL_ROT | 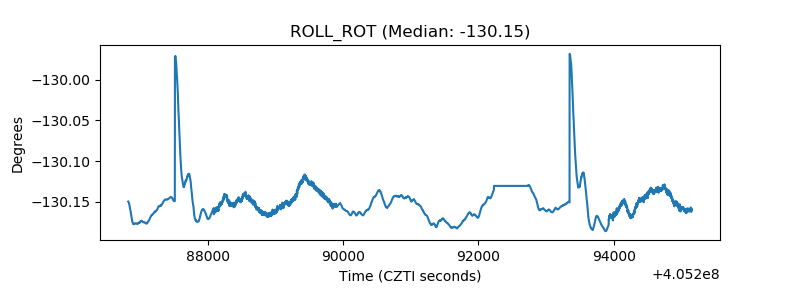 |
| _Roll_DEC | 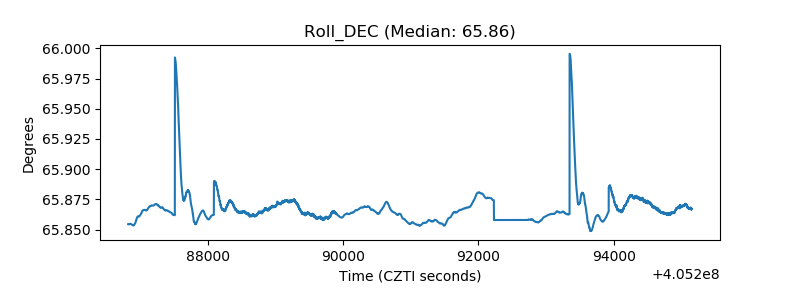 |
| _Roll_RA | 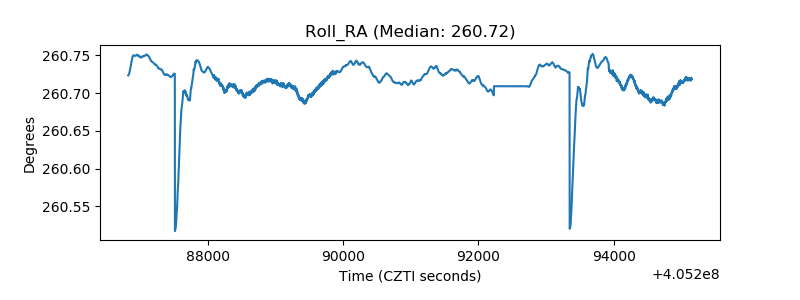 |
| Veto Counter | 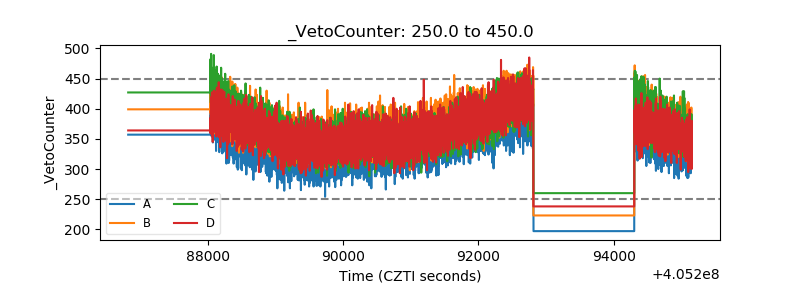 |