| Param | Original file | Final file |
|---|---|---|
| Filename | modeM0/AS1A12_018T01_9000005386_38409cztM0_level2.fits | modeM0/AS1A12_018T01_9000005386_38409cztM0_level2_quad_clean.evt |
| Size (bytes) | 367,868,160 | 100,321,920 |
| Size | 350.8 MB | 95.7 MB |
| Events in quadrant A | 3,481,808 | 666,248 |
| Events in quadrant B | 3,025,787 | 683,901 |
| Events in quadrant C | 2,923,854 | 660,085 |
| Events in quadrant D | 3,711,724 | 601,865 |
| Mode SS | |||
|---|---|---|---|
| Quadrant | BADHDUFLAG | Total packets | Discarded packets |
| A | 0 | 126 | 0 |
| B | 0 | 126 | 0 |
| C | 0 | 126 | 0 |
| D | 0 | 126 | 0 |
| Mode M9 | |||
|---|---|---|---|
| Quadrant | BADHDUFLAG | Total packets | Discarded packets |
| A | 0 | 28 | 0 |
| B | 0 | 28 | 0 |
| C | 0 | 28 | 0 |
| D | 0 | 28 | 0 |
| Mode M0 | |||
|---|---|---|---|
| Quadrant | BADHDUFLAG | Total packets | Discarded packets |
| A | 0 | 14247 | 3 |
| B | 0 | 13142 | 2 |
| C | 0 | 12484 | 2 |
| D | 0 | 15250 | 2 |
| Quadrant | Total seconds | Saturated seconds | Saturation percentage |
|---|---|---|---|
| A | 6091 | 100 | 1.641767% |
| B | 6091 | 31 | 0.508948% |
| C | 6091 | 9 | 0.147759% |
| D | 6091 | 149 | 2.446232% |
Noise dominated data is calculated using 1-second bins in cleaned event files. If a bin has >2000 counts, and if more than 50% of those come from <1% of pixels, then it is considered to be noise-dominated and hence unusable.
| Quadrant | # 1 sec bins | Bins with >0 counts | Bins with >2000 counts | High rate bins dominated by noise | Noise dominated (total time) | Noise dominated (detector-on time) | Marked lightcurve |
|---|---|---|---|---|---|---|---|
| A | 8897 | 6093 | 67 | 67 | 0.75% | 1.10% | 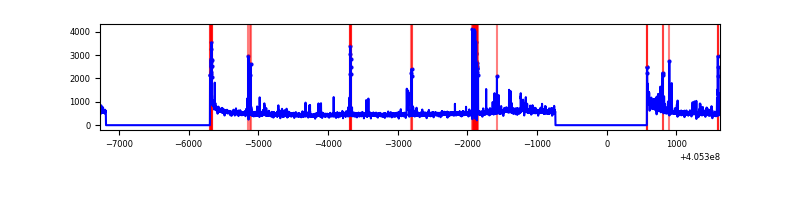 |
| B | 8897 | 6093 | 6 | 6 | 0.07% | 0.10% | 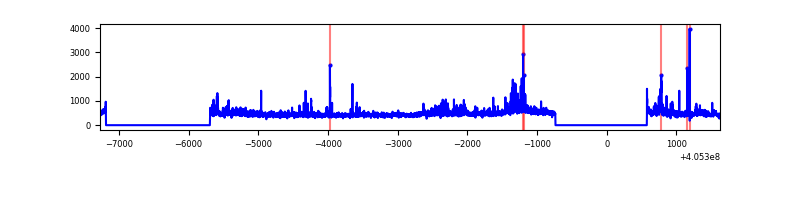 |
| C | 8897 | 6093 | 4 | 4 | 0.04% | 0.07% | 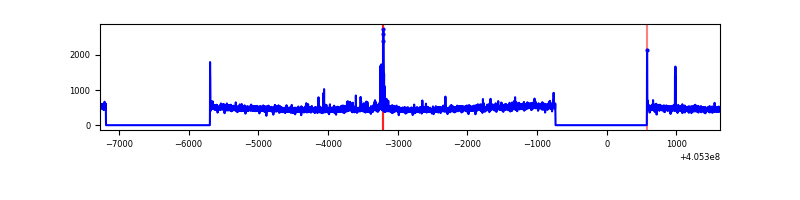 |
| D | 8897 | 6093 | 117 | 117 | 1.32% | 1.92% | 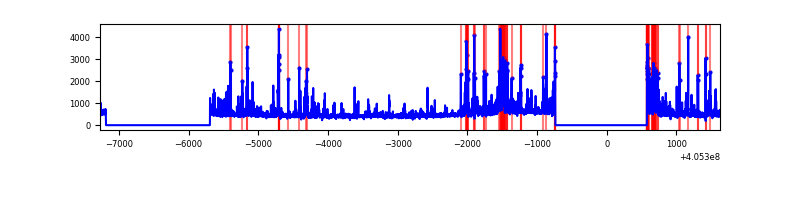 |
Top three noisy pixels from each quadrant. If the there are fewer than three noisy pixels in the level2.evt file, extra rows are filled as -1
| Pixel properties | Quadrant properties | ||||||
|---|---|---|---|---|---|---|---|
| Quadrant | DetID | PixID | Counts | Sigma | Mean | Median | Sigma |
| A | 10 | 83 | 429582 | 3166.7 | 668 | 654 | 135.4 |
| A | 9 | 143 | 207790 | 1529.25 | 668 | 654 | 135.4 |
| A | 12 | 189 | 61750 | 451.06 | 668 | 654 | 135.4 |
| B | 0 | 183 | 106119 | 822.6 | 667 | 649 | 128.2 |
| B | 4 | 171 | 94849 | 734.7 | 667 | 649 | 128.2 |
| B | 0 | 155 | 70868 | 547.66 | 667 | 649 | 128.2 |
| C | 15 | 214 | 257230 | 1659.42 | 658 | 660 | 154.6 |
| C | 10 | 20 | 43036 | 274.07 | 658 | 660 | 154.6 |
| C | 14 | 254 | 16007 | 99.26 | 658 | 660 | 154.6 |
| D | 2 | 153 | 379692 | 2392.42 | 651 | 632 | 158.4 |
| D | 2 | 250 | 172722 | 1086.14 | 651 | 632 | 158.4 |
| D | 12 | 6 | 158286 | 995.03 | 651 | 632 | 158.4 |
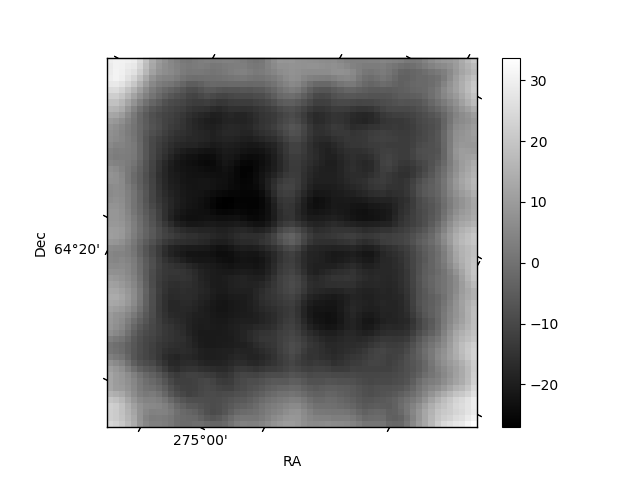
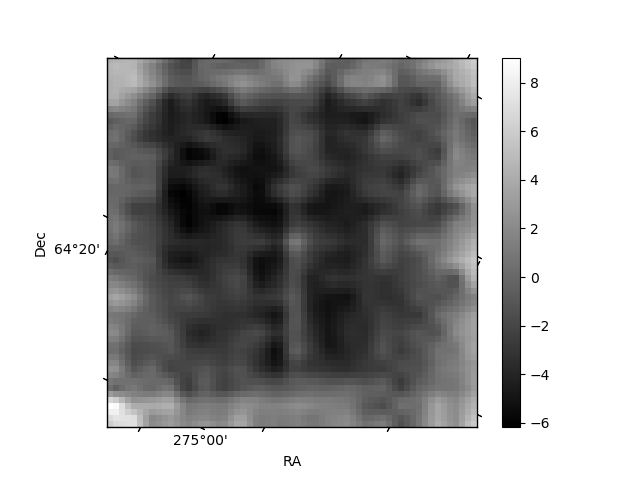
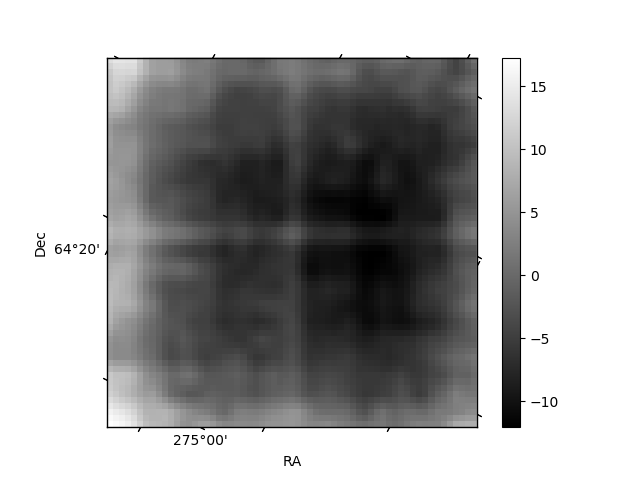
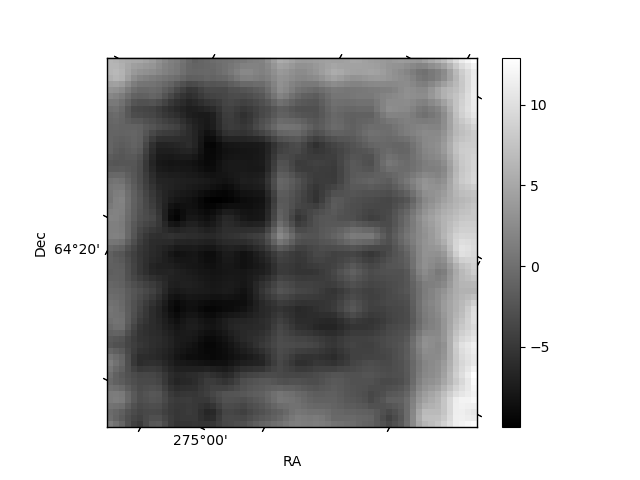
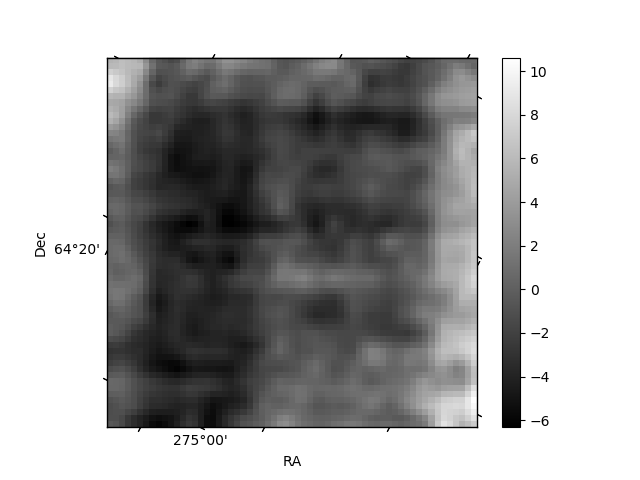
Histogram calculated using DETX and DETY for each event in the final _common_clean file
| Quadrant A | 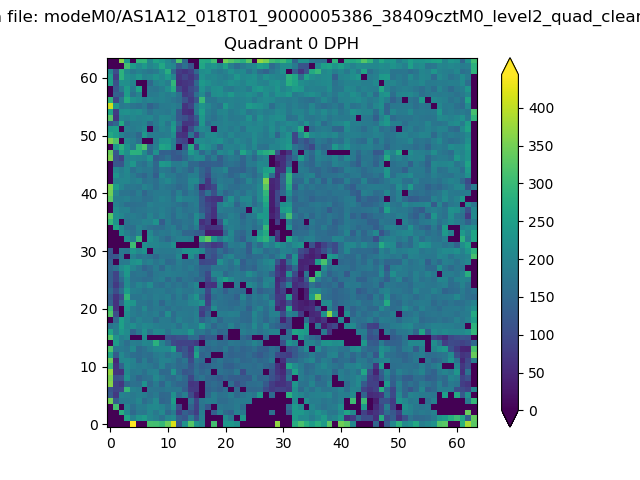 |
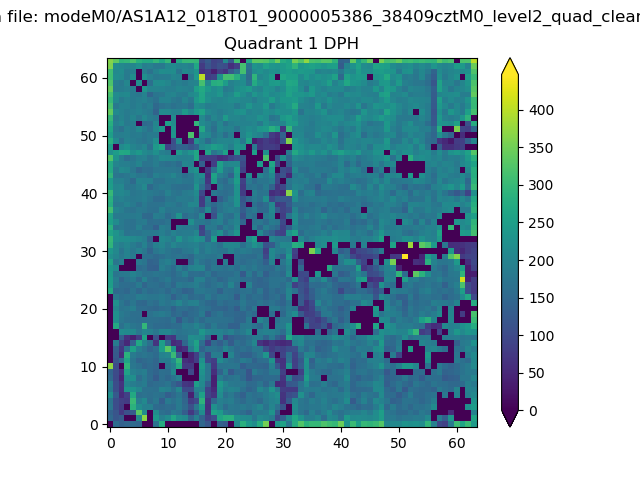 |
Quadrant B |
|---|---|---|---|
| Quadrant D | 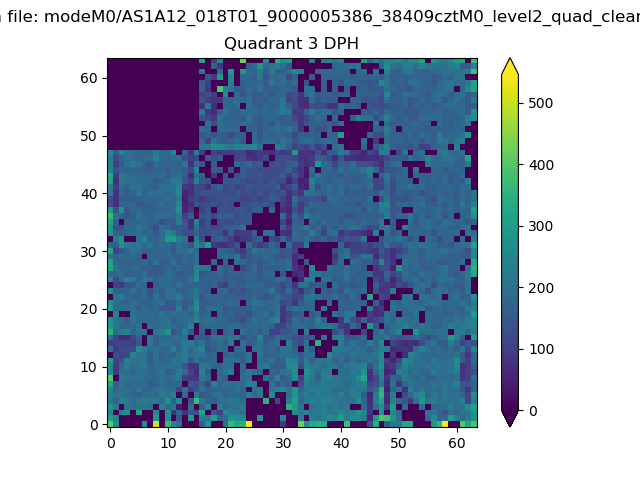 |
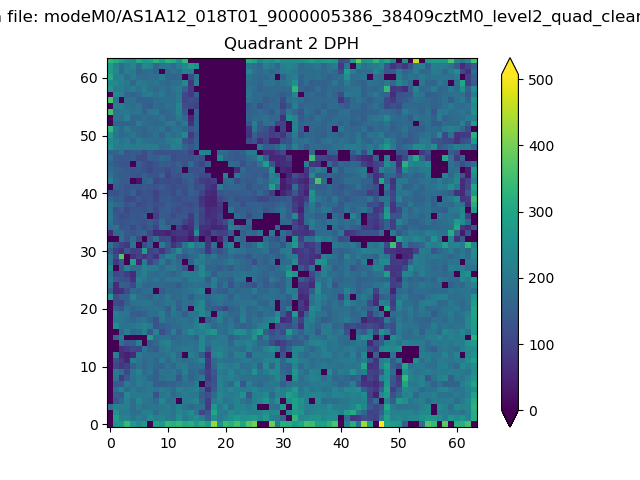 |
Quadrant C |
| Plot type | Count rate plots | Images |
|---|---|---|
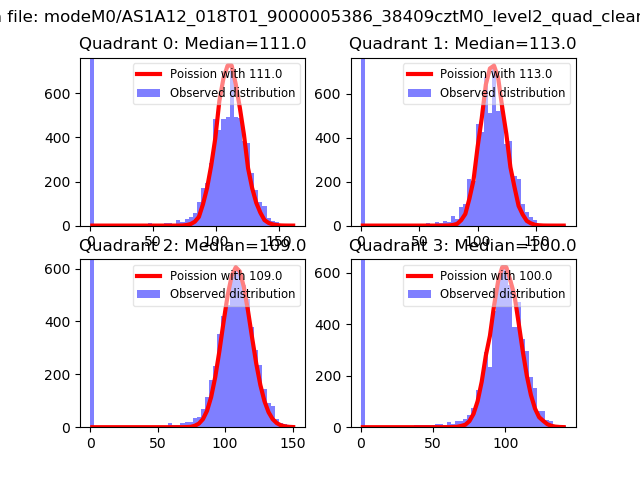
| Comparison with Poisson distribution Blue bars denote a histogram of data divided into 1 sec bins. Red curve is a Poisson curve with rate = median count rate of data. |
 |
 |
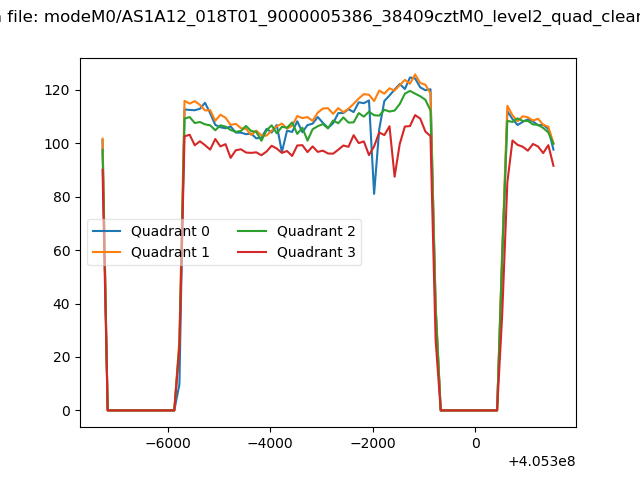
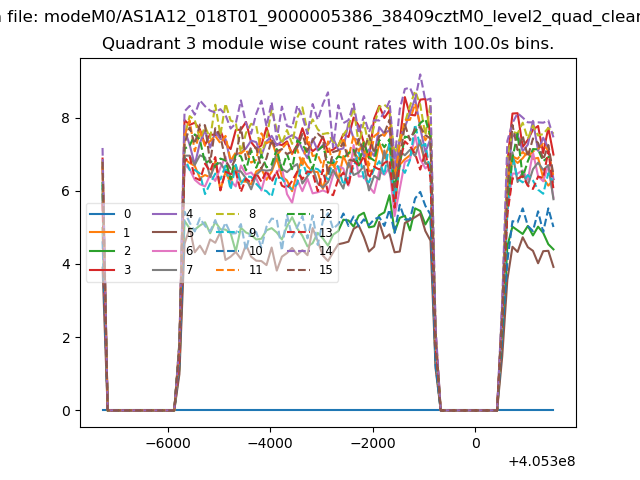
| Quadrant-wise count rates Data is divided into 100 sec bins |
 |
|
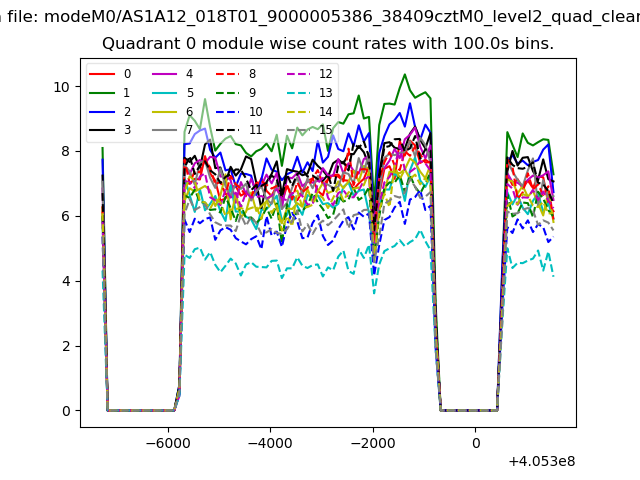
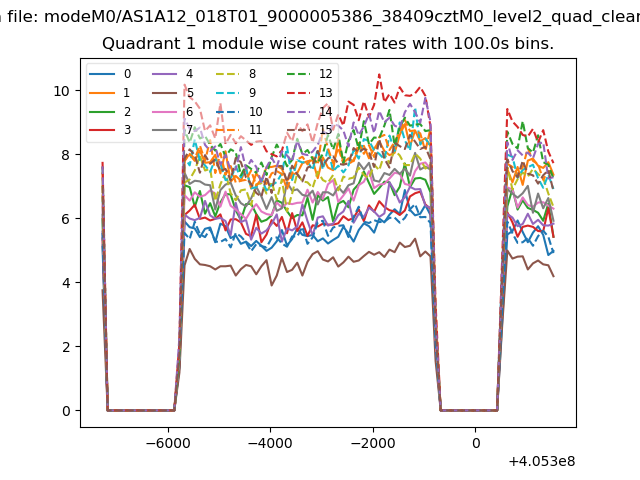
| Module-wise count rates for Quadrant A Data is divided into 100 sec bins |
 |
 |
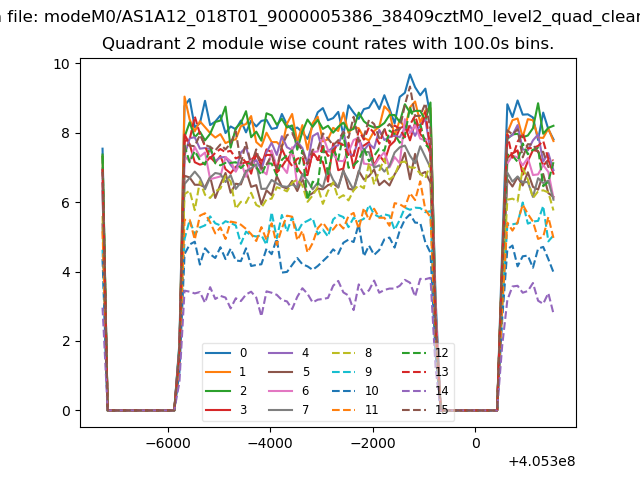
| Module-wise count rates for Quadrant B Data is divided into 100 sec bins |
 |
 |
| Module-wise count rates for Quadrant C Data is divided into 100 sec bins |
 |
 |
| Module-wise count rates for Quadrant D Data is divided into 100 sec bins |
 |
 |
| Parameter | Plot |
|---|---|
| CZT HV Monitor | 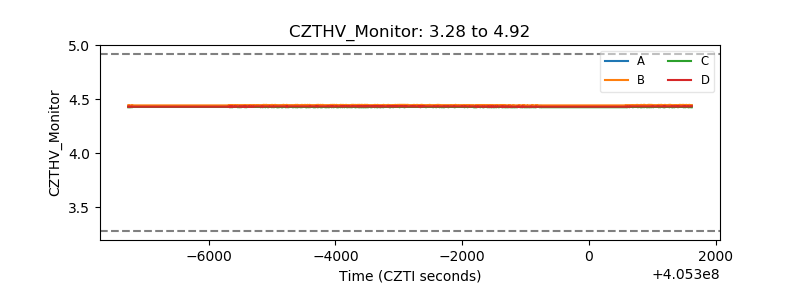 |
| D_VDD | 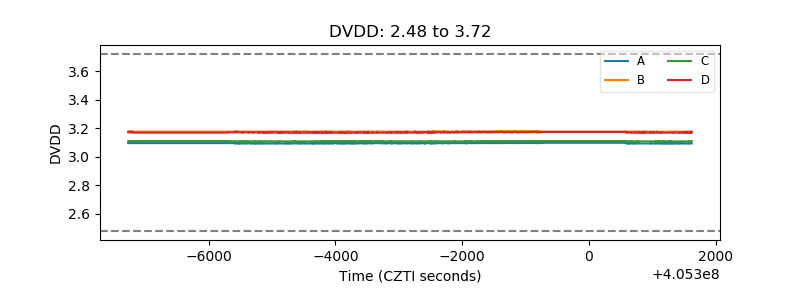 |
| Temperature 1 | 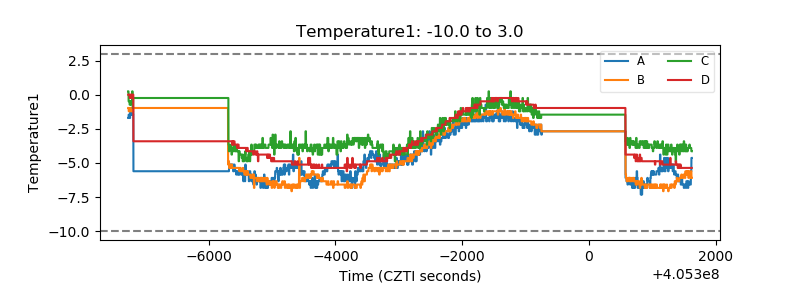 |
| Veto HV Monitor | 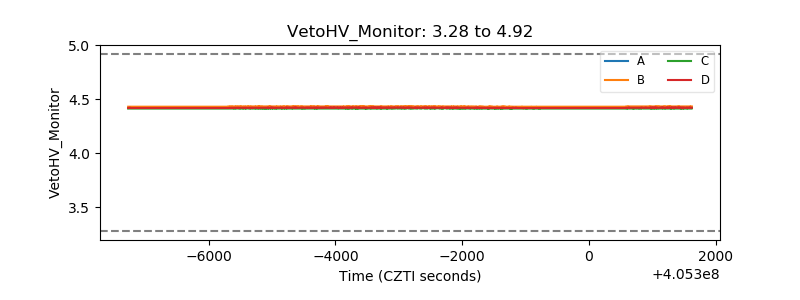 |
| Veto LLD | 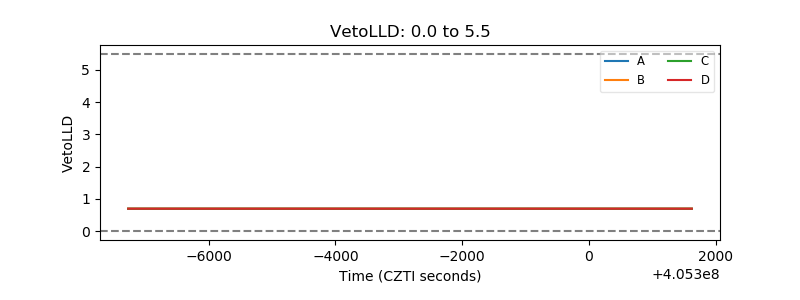 |
| Alpha Counter | 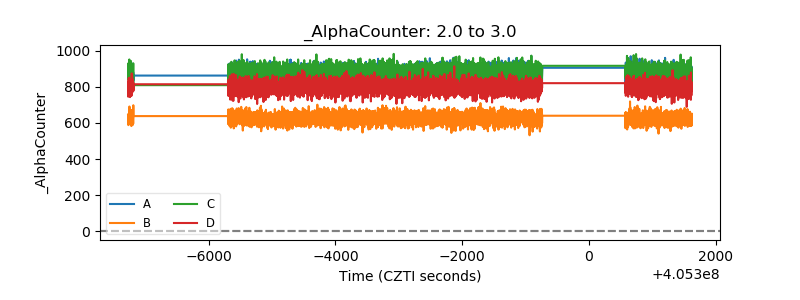 |
| _CPM_Rate | 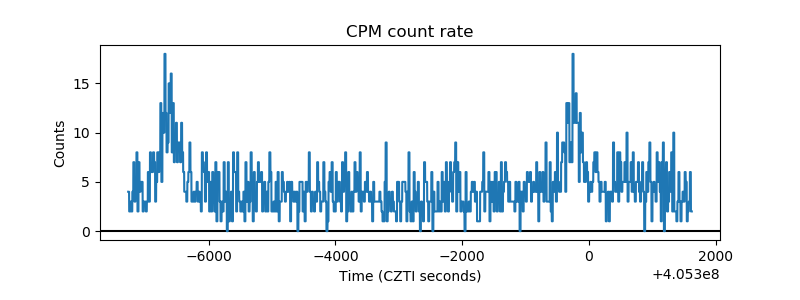 |
| CZT Counter | 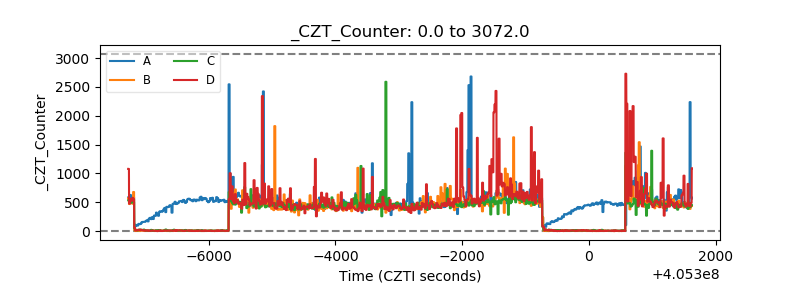 |
| +2.5 Volts monitor |  |
| +5 Volts monitor | 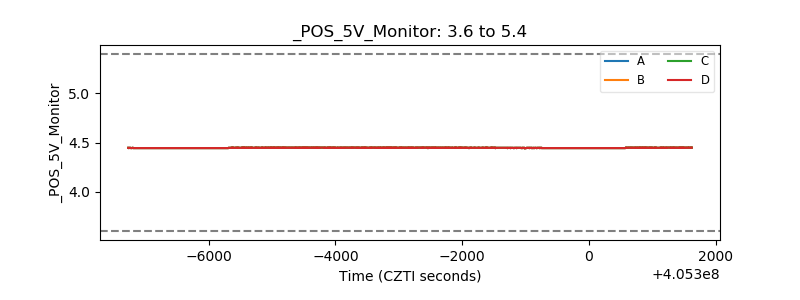 |
| _ROLL_ROT | 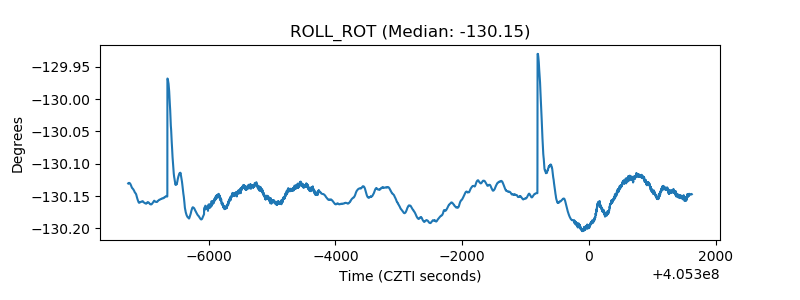 |
| _Roll_DEC | 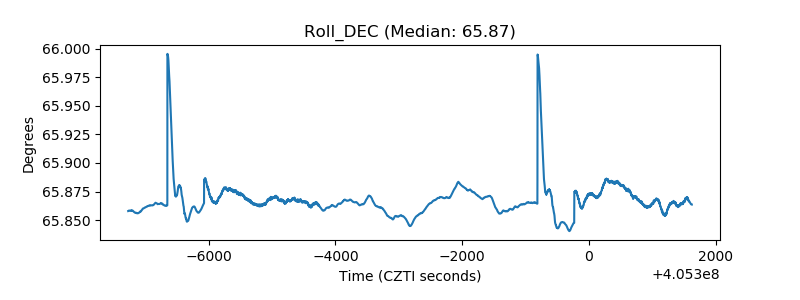 |
| _Roll_RA | 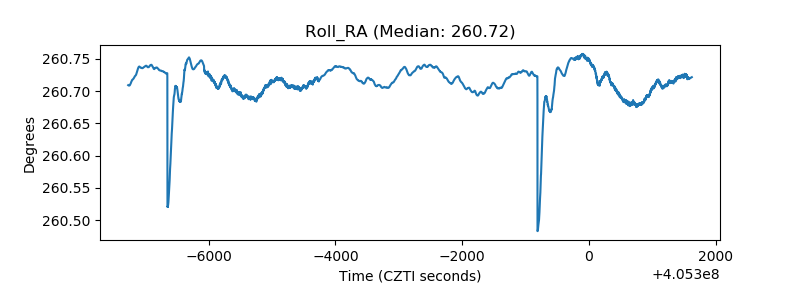 |
| Veto Counter | 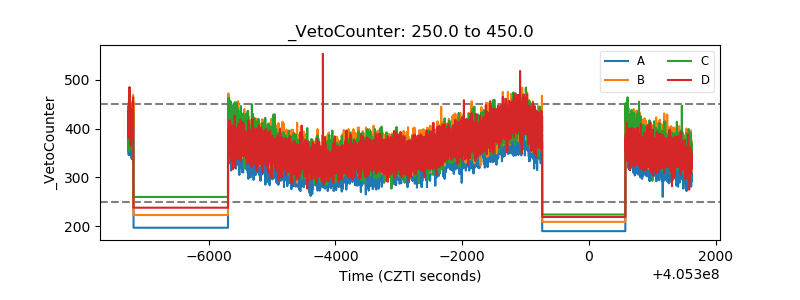 |