| Param | Original file | Final file |
|---|---|---|
| Filename | modeM0/AS1A12_018T01_9000005386_38410cztM0_level2.fits | modeM0/AS1A12_018T01_9000005386_38410cztM0_level2_quad_clean.evt |
| Size (bytes) | 378,593,280 | 97,804,800 |
| Size | 361.1 MB | 93.3 MB |
| Events in quadrant A | 3,491,929 | 651,684 |
| Events in quadrant B | 3,201,139 | 663,807 |
| Events in quadrant C | 2,835,361 | 647,154 |
| Events in quadrant D | 4,022,140 | 581,947 |
| Mode SS | |||
|---|---|---|---|
| Quadrant | BADHDUFLAG | Total packets | Discarded packets |
| A | 0 | 122 | 0 |
| B | 0 | 122 | 0 |
| C | 0 | 122 | 0 |
| D | 0 | 122 | 0 |
| Mode M9 | |||
|---|---|---|---|
| Quadrant | BADHDUFLAG | Total packets | Discarded packets |
| A | 0 | 16 | 0 |
| B | 0 | 16 | 0 |
| C | 0 | 16 | 0 |
| D | 0 | 17 | 0 |
| Mode M0 | |||
|---|---|---|---|
| Quadrant | BADHDUFLAG | Total packets | Discarded packets |
| A | 0 | 14102 | 3 |
| B | 0 | 13593 | 2 |
| C | 0 | 12238 | 2 |
| D | 0 | 16175 | 2 |
| Quadrant | Total seconds | Saturated seconds | Saturation percentage |
|---|---|---|---|
| A | 5961 | 57 | 0.956215% |
| B | 5961 | 88 | 1.476262% |
| C | 5961 | 10 | 0.167757% |
| D | 5961 | 220 | 3.690656% |
Noise dominated data is calculated using 1-second bins in cleaned event files. If a bin has >2000 counts, and if more than 50% of those come from <1% of pixels, then it is considered to be noise-dominated and hence unusable.
| Quadrant | # 1 sec bins | Bins with >0 counts | Bins with >2000 counts | High rate bins dominated by noise | Noise dominated (total time) | Noise dominated (detector-on time) | Marked lightcurve |
|---|---|---|---|---|---|---|---|
| A | 7274 | 5962 | 32 | 32 | 0.44% | 0.54% | 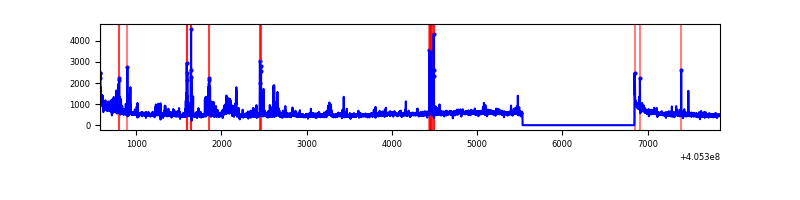 |
| B | 7274 | 5962 | 43 | 43 | 0.59% | 0.72% | 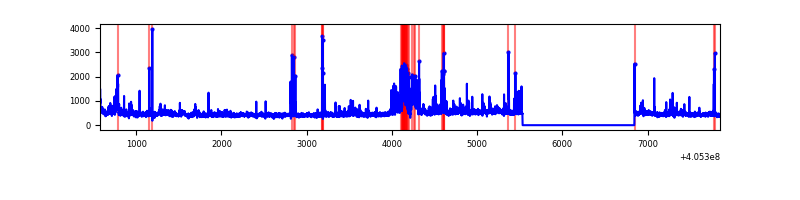 |
| C | 7274 | 5962 | 5 | 5 | 0.07% | 0.08% | 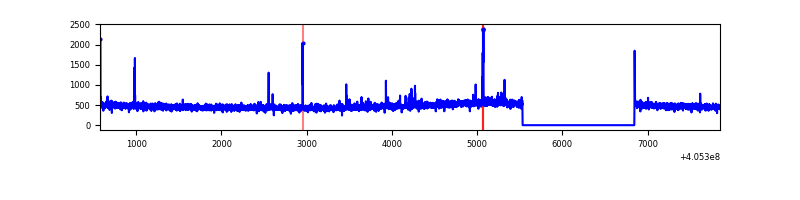 |
| D | 7274 | 5962 | 184 | 184 | 2.53% | 3.09% | 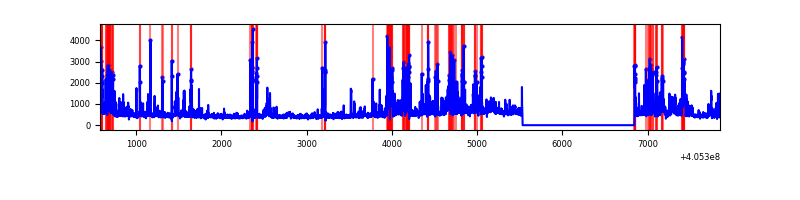 |
Top three noisy pixels from each quadrant. If the there are fewer than three noisy pixels in the level2.evt file, extra rows are filled as -1
| Pixel properties | Quadrant properties | ||||||
|---|---|---|---|---|---|---|---|
| Quadrant | DetID | PixID | Counts | Sigma | Mean | Median | Sigma |
| A | 10 | 83 | 430024 | 3225.04 | 659 | 647 | 133.1 |
| A | 12 | 16 | 201327 | 1507.3 | 659 | 647 | 133.1 |
| A | 9 | 143 | 124309 | 928.82 | 659 | 647 | 133.1 |
| B | 0 | 183 | 350443 | 2759.54 | 655 | 637 | 126.8 |
| B | 4 | 171 | 131706 | 1033.97 | 655 | 637 | 126.8 |
| B | 0 | 155 | 56226 | 438.53 | 655 | 637 | 126.8 |
| C | 15 | 214 | 255214 | 1677.67 | 645 | 648 | 151.7 |
| C | 0 | 207 | 14247 | 89.62 | 645 | 648 | 151.7 |
| C | 0 | 239 | 13741 | 86.29 | 645 | 648 | 151.7 |
| D | 2 | 250 | 424573 | 2754.24 | 635 | 620 | 153.9 |
| D | 2 | 153 | 300686 | 1949.4 | 635 | 620 | 153.9 |
| D | 7 | 223 | 168201 | 1088.7 | 635 | 620 | 153.9 |
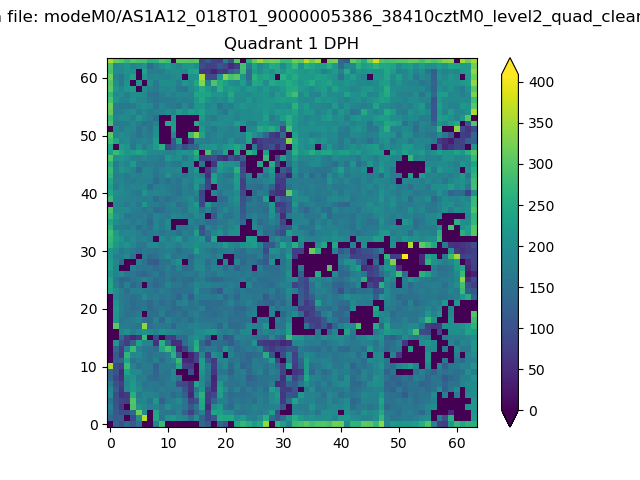
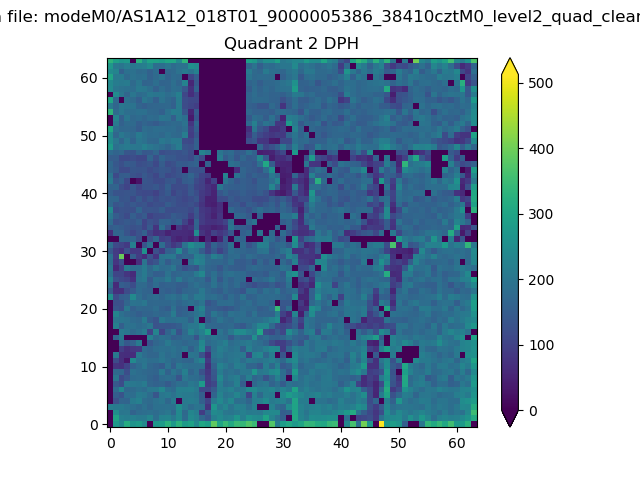
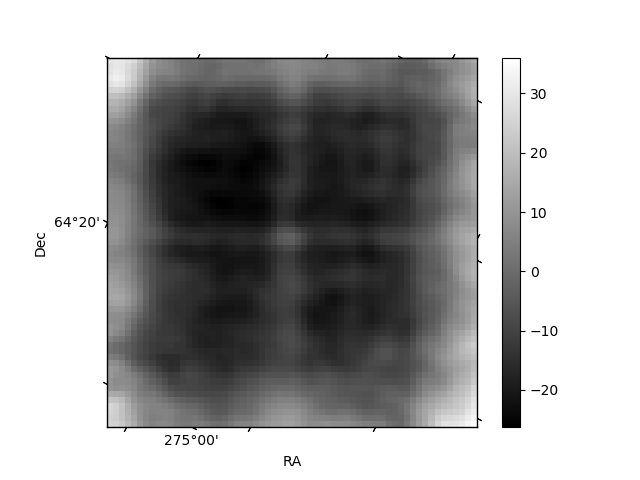
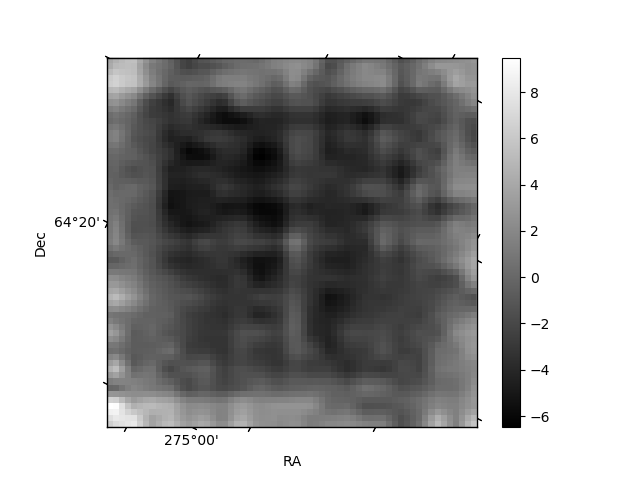
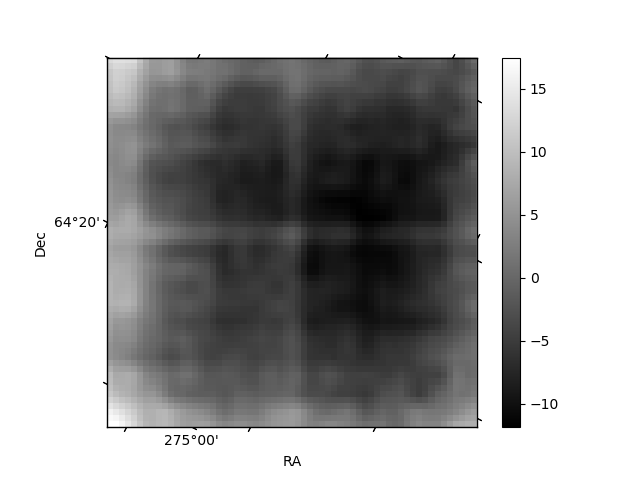
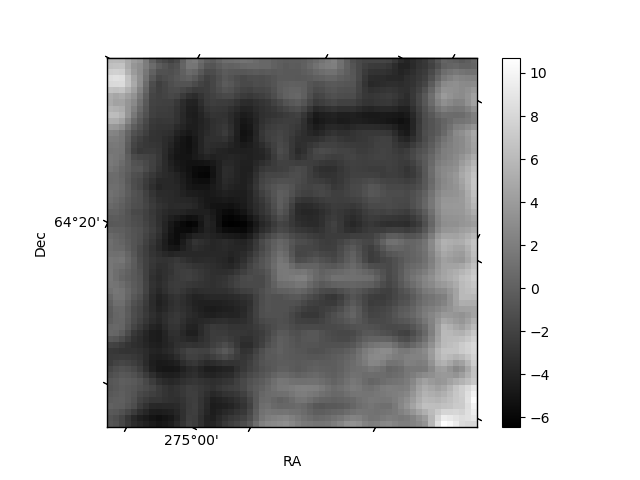
Histogram calculated using DETX and DETY for each event in the final _common_clean file
| Quadrant A |  |
 |
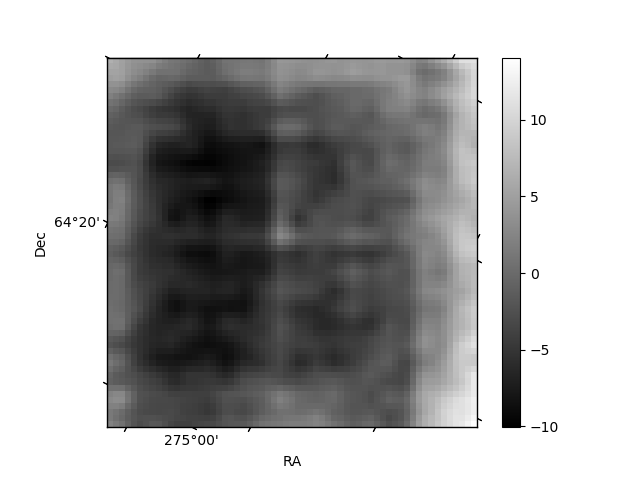
Quadrant B |
|---|---|---|---|
| Quadrant D | 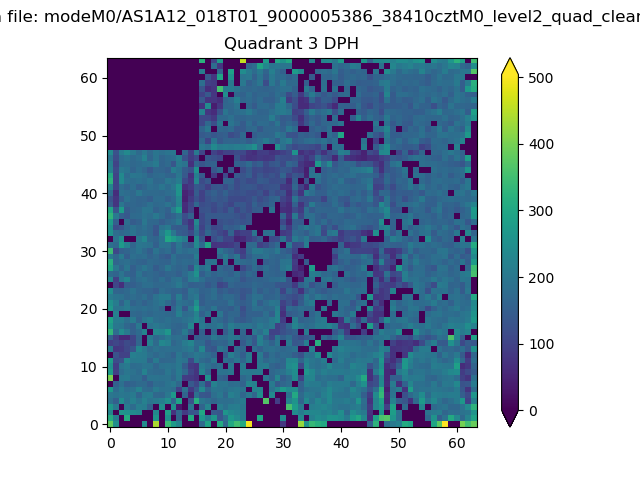 |
 |
Quadrant C |
| Plot type | Count rate plots | Images |
|---|---|---|
| Comparison with Poisson distribution Blue bars denote a histogram of data divided into 1 sec bins. Red curve is a Poisson curve with rate = median count rate of data. |
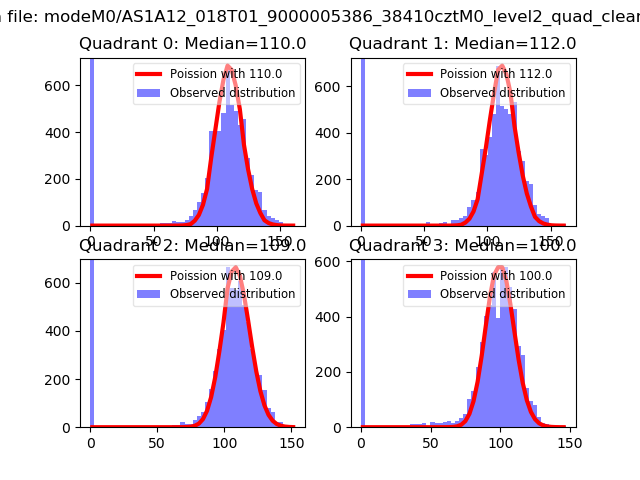 |
 |
| Quadrant-wise count rates Data is divided into 100 sec bins |
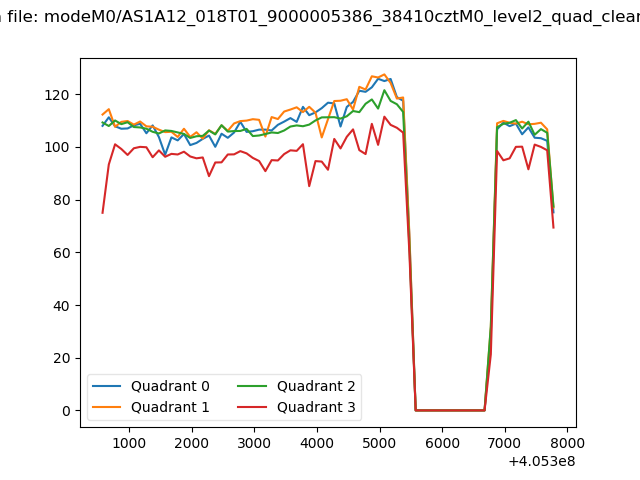 |
|
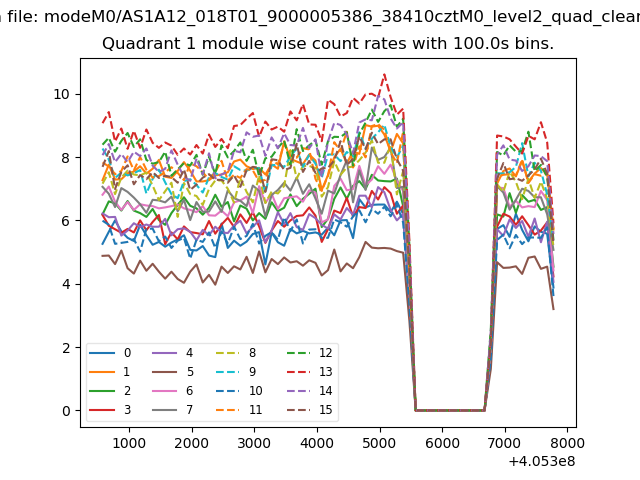
| Module-wise count rates for Quadrant A Data is divided into 100 sec bins |
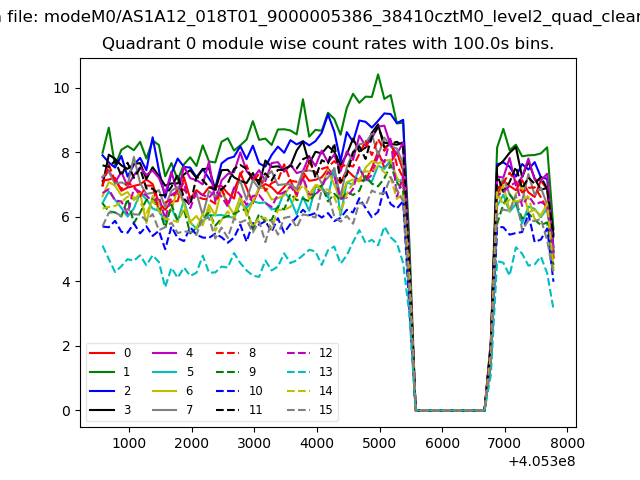 |
 |
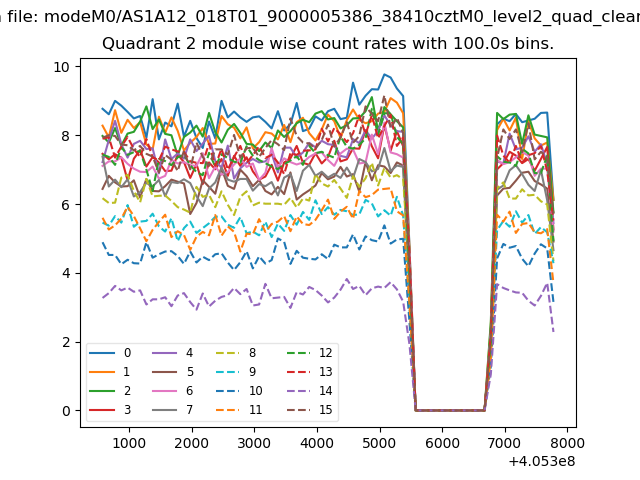
| Module-wise count rates for Quadrant B Data is divided into 100 sec bins |
 |
 |
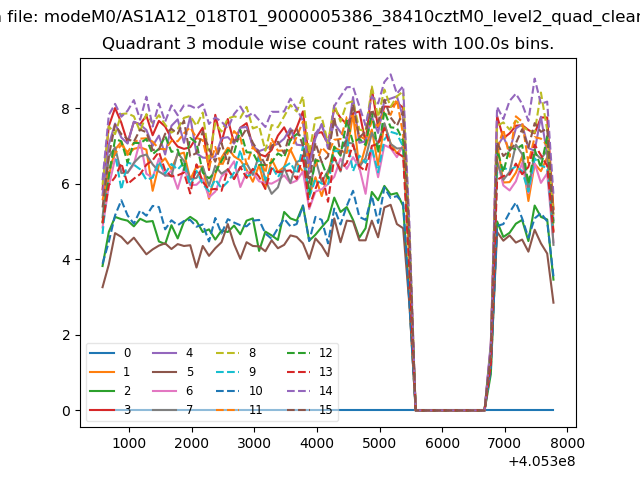
| Module-wise count rates for Quadrant C Data is divided into 100 sec bins |
 |
 |
| Module-wise count rates for Quadrant D Data is divided into 100 sec bins |
 |
 |
| Parameter | Plot |
|---|---|
| CZT HV Monitor | 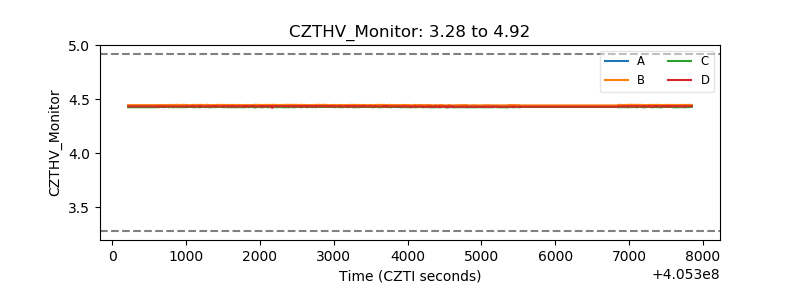 |
| D_VDD | 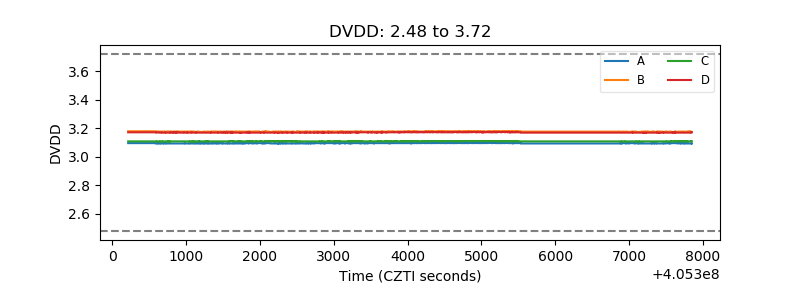 |
| Temperature 1 | 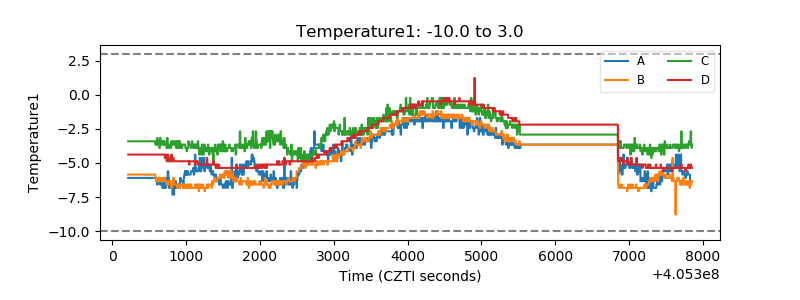 |
| Veto HV Monitor | 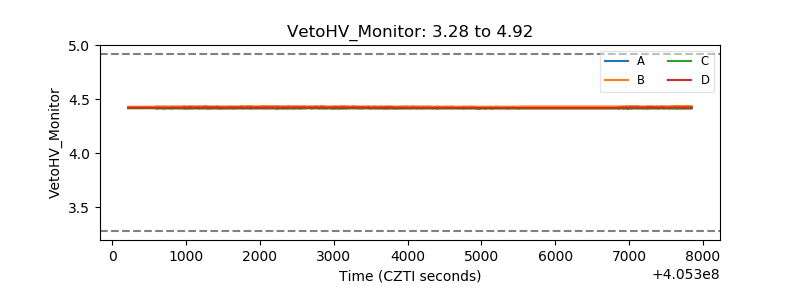 |
| Veto LLD | 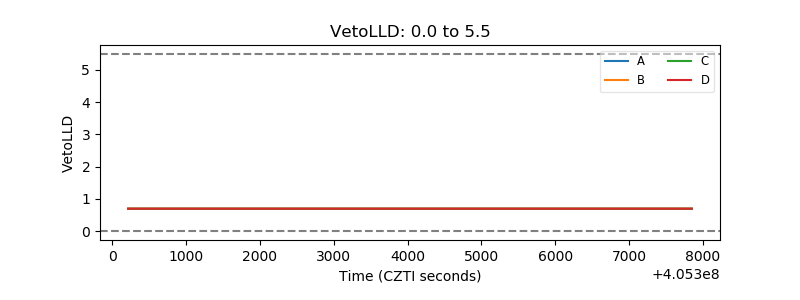 |
| Alpha Counter | 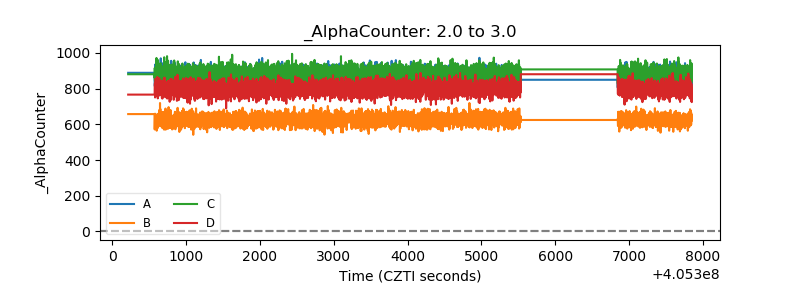 |
| _CPM_Rate | 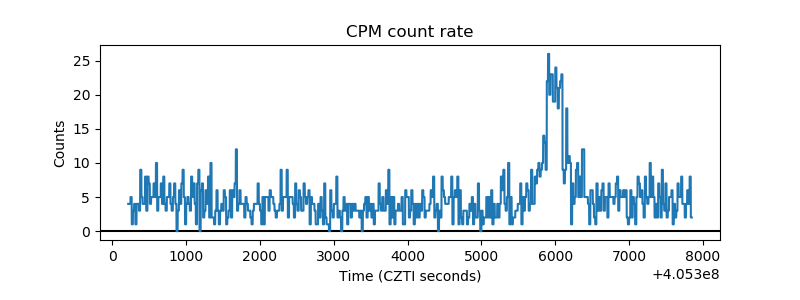 |
| CZT Counter | 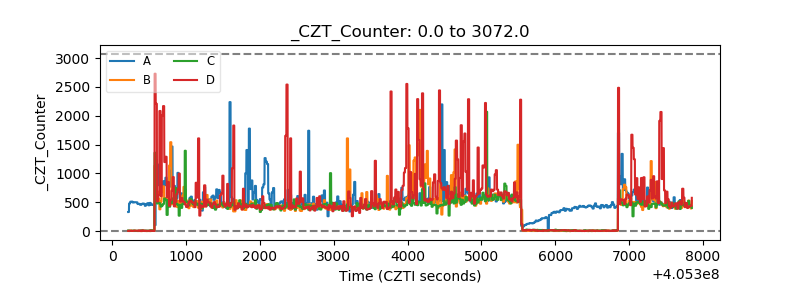 |
| +2.5 Volts monitor | 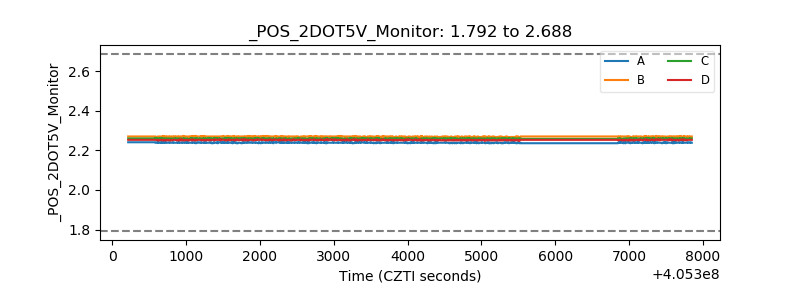 |
| +5 Volts monitor | 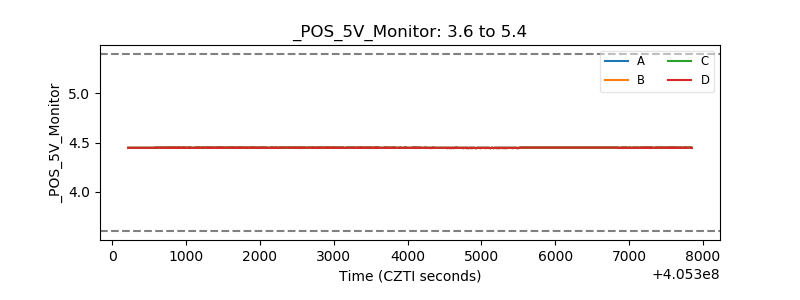 |
| _ROLL_ROT | 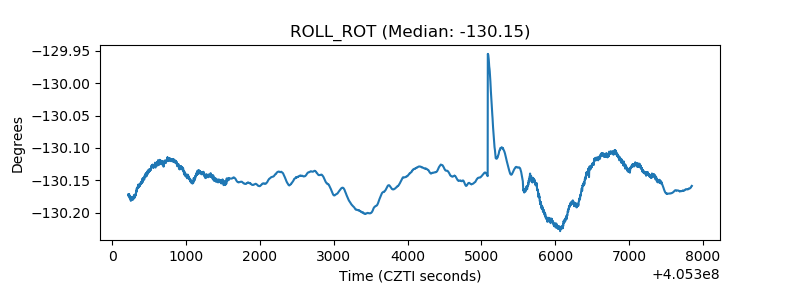 |
| _Roll_DEC | 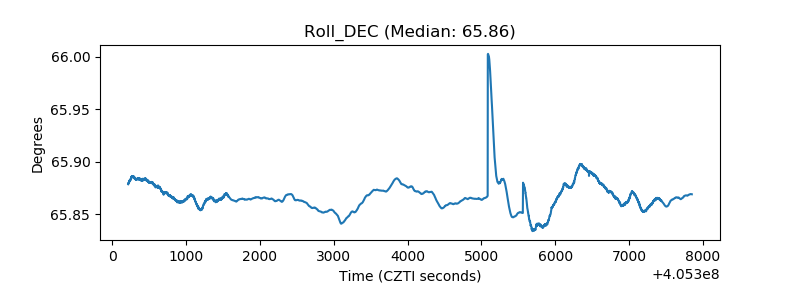 |
| _Roll_RA | 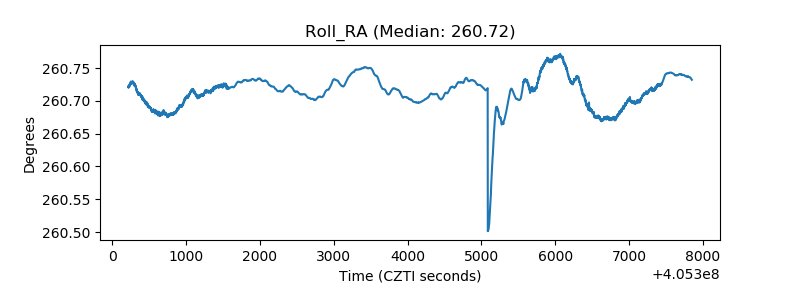 |
| Veto Counter | 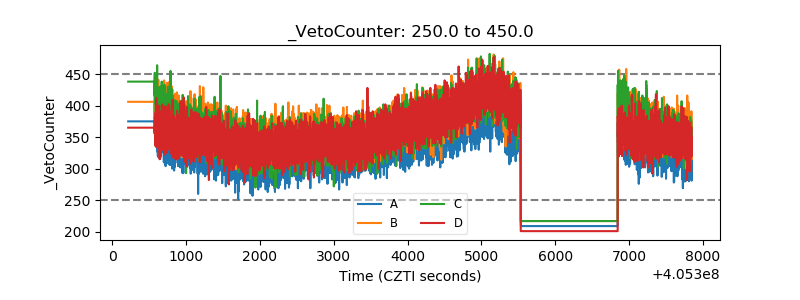 |