| Param | Original file | Final file |
|---|---|---|
| Filename | modeM0/AS1A12_018T01_9000005386_38412cztM0_level2.fits | modeM0/AS1A12_018T01_9000005386_38412cztM0_level2_quad_clean.evt |
| Size (bytes) | 670,429,440 | 175,538,880 |
| Size | 639.4 MB | 167.4 MB |
| Events in quadrant A | 5,820,548 | 1,171,823 |
| Events in quadrant B | 5,400,026 | 1,200,951 |
| Events in quadrant C | 5,024,580 | 1,159,942 |
| Events in quadrant D | 7,740,670 | 1,039,316 |
| Mode SS | |||
|---|---|---|---|
| Quadrant | BADHDUFLAG | Total packets | Discarded packets |
| A | 0 | 220 | 0 |
| B | 0 | 220 | 0 |
| C | 0 | 220 | 0 |
| D | 0 | 220 | 0 |
| Mode M9 | |||
|---|---|---|---|
| Quadrant | BADHDUFLAG | Total packets | Discarded packets |
| A | 0 | 36 | 0 |
| B | 0 | 36 | 0 |
| C | 0 | 36 | 0 |
| D | 0 | 37 | 0 |
| Mode M0 | |||
|---|---|---|---|
| Quadrant | BADHDUFLAG | Total packets | Discarded packets |
| A | 0 | 23871 | 4 |
| B | 0 | 23245 | 3 |
| C | 0 | 21709 | 3 |
| D | 0 | 30495 | 3 |
| Quadrant | Total seconds | Saturated seconds | Saturation percentage |
|---|---|---|---|
| A | 10722 | 76 | 0.708823% |
| B | 10722 | 52 | 0.484984% |
| C | 10722 | 6 | 0.055960% |
| D | 10722 | 372 | 3.469502% |
Noise dominated data is calculated using 1-second bins in cleaned event files. If a bin has >2000 counts, and if more than 50% of those come from <1% of pixels, then it is considered to be noise-dominated and hence unusable.
| Quadrant | # 1 sec bins | Bins with >0 counts | Bins with >2000 counts | High rate bins dominated by noise | Noise dominated (total time) | Noise dominated (detector-on time) | Marked lightcurve |
|---|---|---|---|---|---|---|---|
| A | 13558 | 10724 | 52 | 52 | 0.38% | 0.48% | 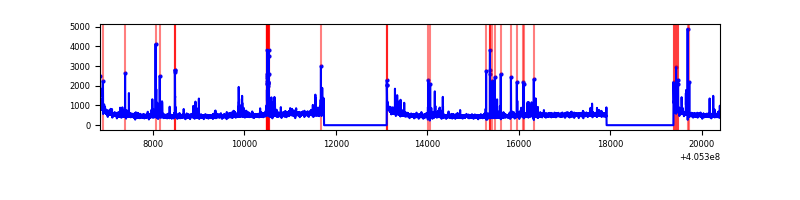 |
| B | 13558 | 10724 | 21 | 21 | 0.15% | 0.20% | 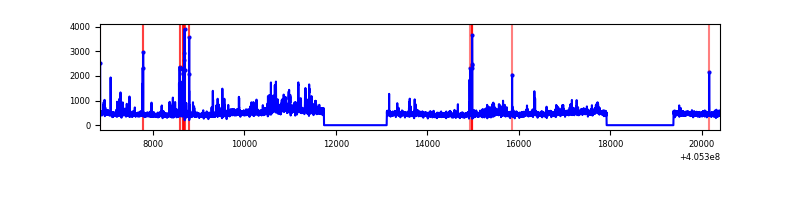 |
| C | 13558 | 10724 | 0 | 0 | 0.00% | 0.00% | 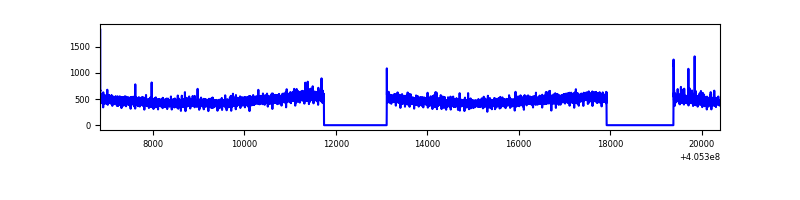 |
| D | 13558 | 10724 | 286 | 286 | 2.11% | 2.67% | 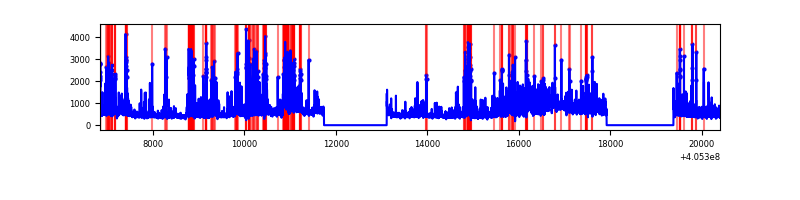 |
Top three noisy pixels from each quadrant. If the there are fewer than three noisy pixels in the level2.evt file, extra rows are filled as -1
| Pixel properties | Quadrant properties | ||||||
|---|---|---|---|---|---|---|---|
| Quadrant | DetID | PixID | Counts | Sigma | Mean | Median | Sigma |
| A | 10 | 83 | 727109 | 3010.38 | 1192 | 1166 | 241.1 |
| A | 9 | 143 | 241106 | 995.0 | 1192 | 1166 | 241.1 |
| A | 13 | 248 | 87101 | 356.36 | 1192 | 1166 | 241.1 |
| B | 0 | 183 | 275353 | 1203.37 | 1186 | 1151 | 227.9 |
| B | 4 | 171 | 129551 | 563.5 | 1186 | 1151 | 227.9 |
| B | 0 | 230 | 116126 | 504.58 | 1186 | 1151 | 227.9 |
| C | 15 | 214 | 453493 | 1653.78 | 1164 | 1169 | 273.5 |
| C | 0 | 10 | 12704 | 42.17 | 1164 | 1169 | 273.5 |
| C | 5 | 250 | 8544 | 26.96 | 1164 | 1169 | 273.5 |
| D | 12 | 235 | 959437 | 3437.4 | 1148 | 1116 | 278.8 |
| D | 2 | 250 | 579581 | 2074.89 | 1148 | 1116 | 278.8 |
| D | 2 | 153 | 371914 | 1330.01 | 1148 | 1116 | 278.8 |
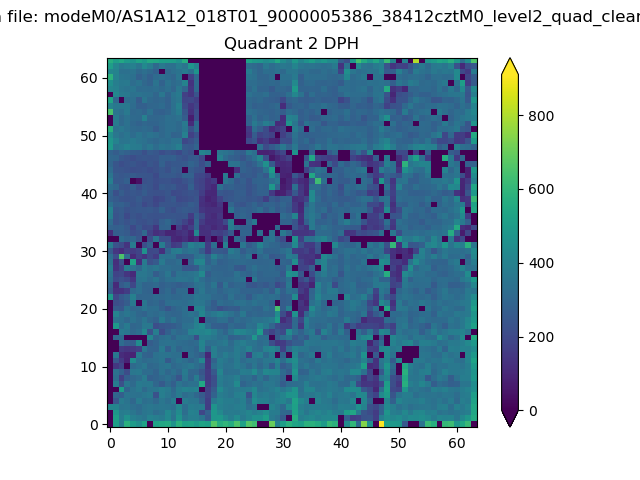
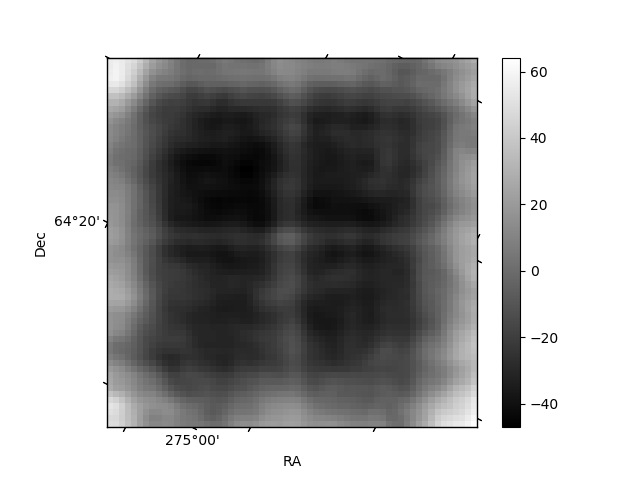
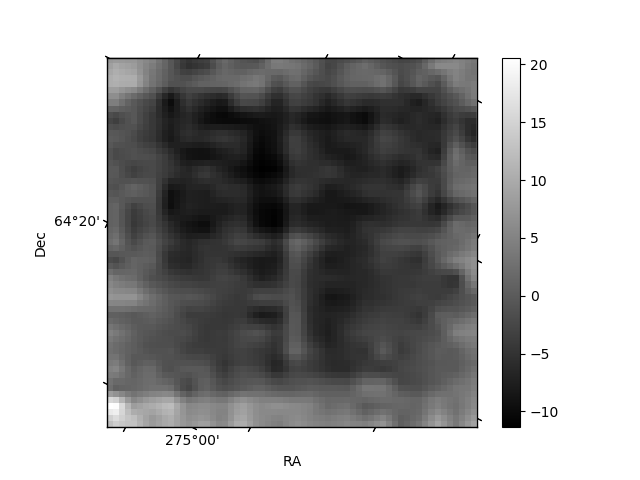
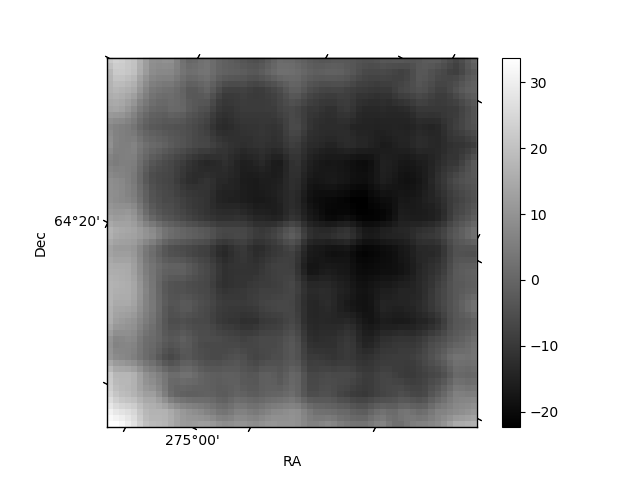
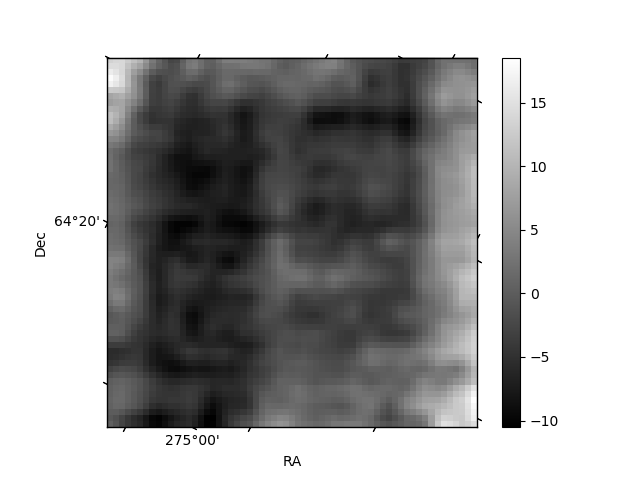
Histogram calculated using DETX and DETY for each event in the final _common_clean file
| Quadrant A | 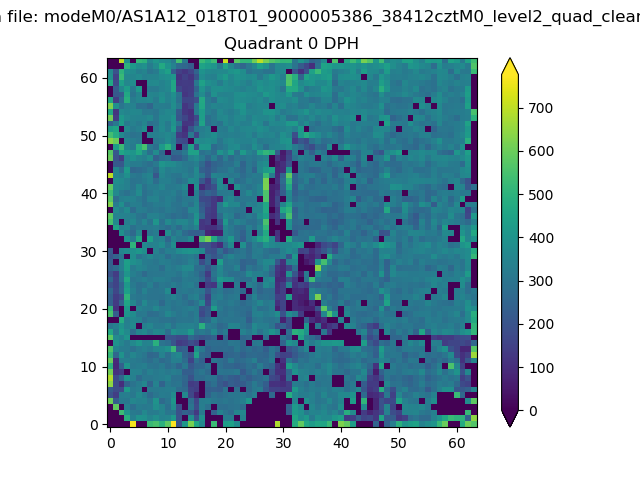 |
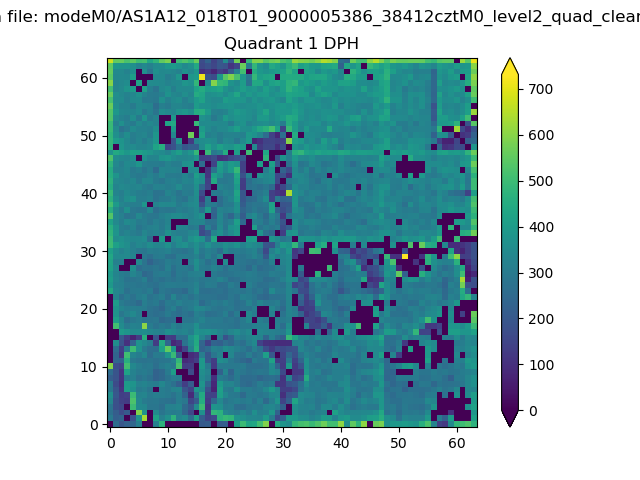 |
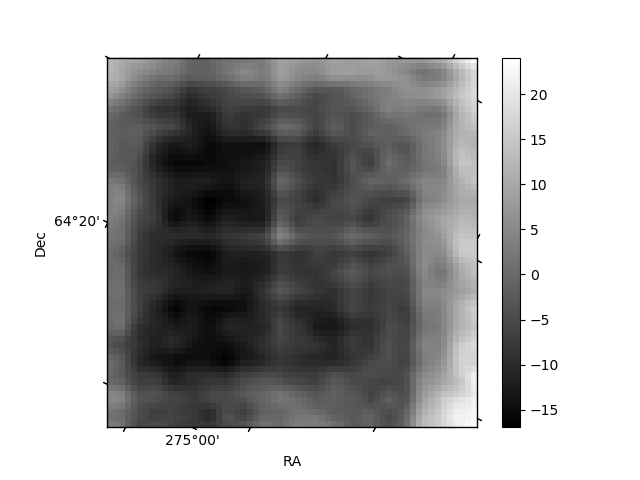
Quadrant B |
|---|---|---|---|
| Quadrant D | 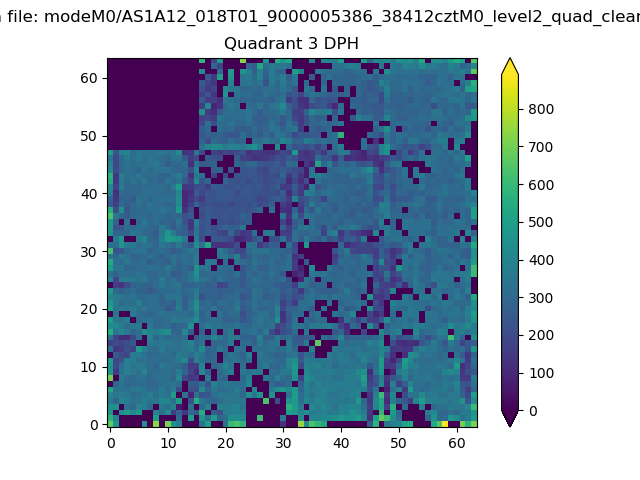 |
 |
Quadrant C |
| Plot type | Count rate plots | Images |
|---|---|---|
| Comparison with Poisson distribution Blue bars denote a histogram of data divided into 1 sec bins. Red curve is a Poisson curve with rate = median count rate of data. |
 |
 |
| Quadrant-wise count rates Data is divided into 100 sec bins |
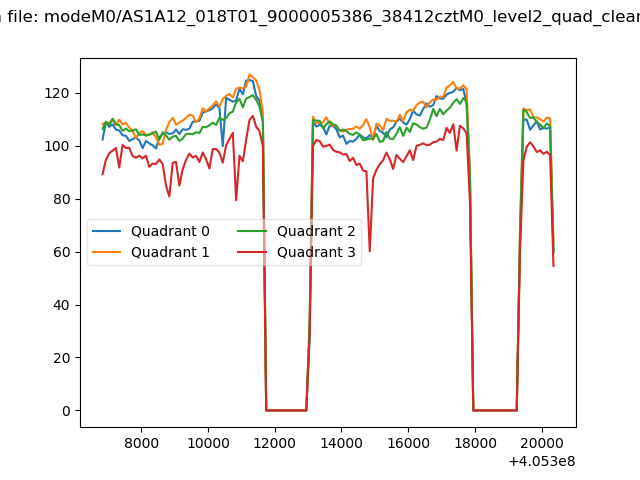 |
|
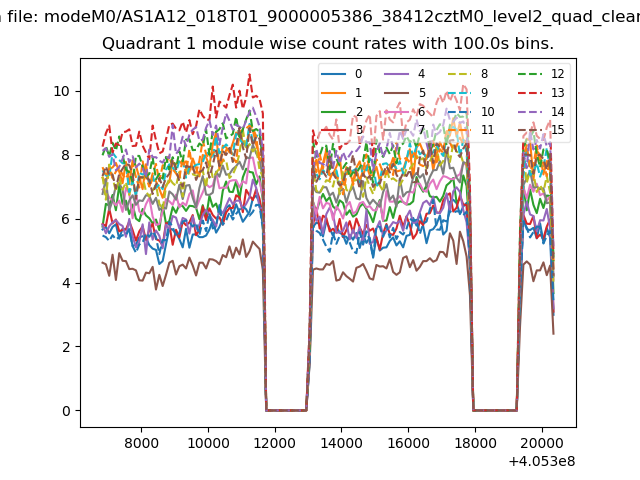
| Module-wise count rates for Quadrant A Data is divided into 100 sec bins |
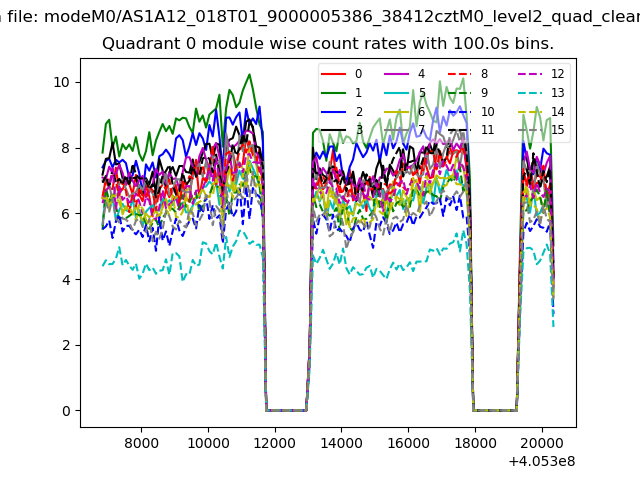 |
 |
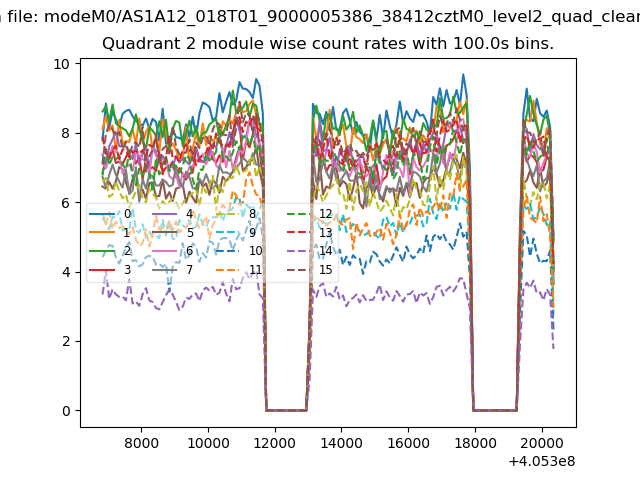
| Module-wise count rates for Quadrant B Data is divided into 100 sec bins |
 |
 |
| Module-wise count rates for Quadrant C Data is divided into 100 sec bins |
 |
 |
| Module-wise count rates for Quadrant D Data is divided into 100 sec bins |
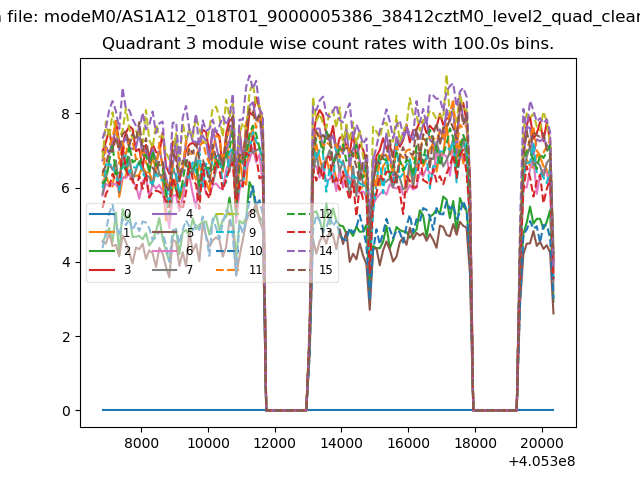 |
 |
| Parameter | Plot |
|---|---|
| CZT HV Monitor | 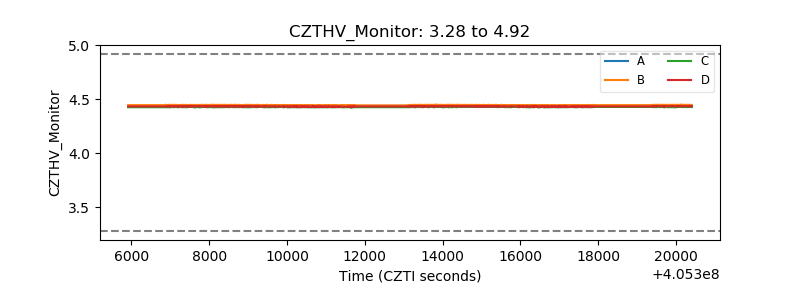 |
| D_VDD | 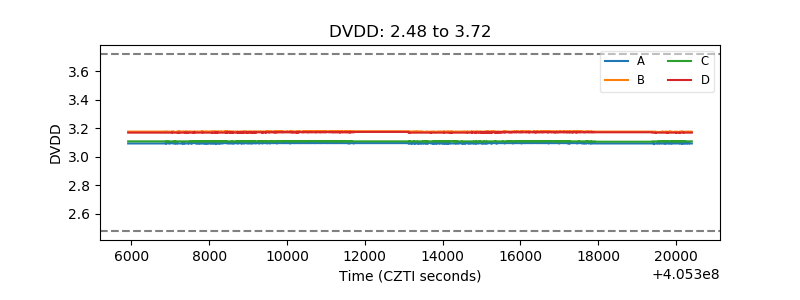 |
| Temperature 1 | 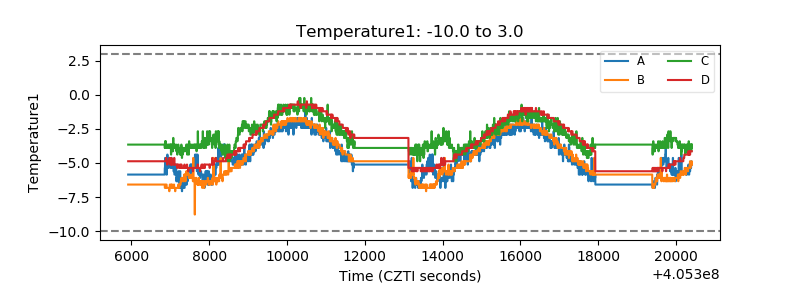 |
| Veto HV Monitor | 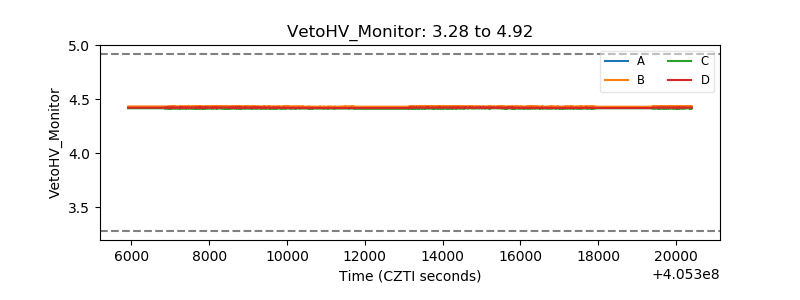 |
| Veto LLD | 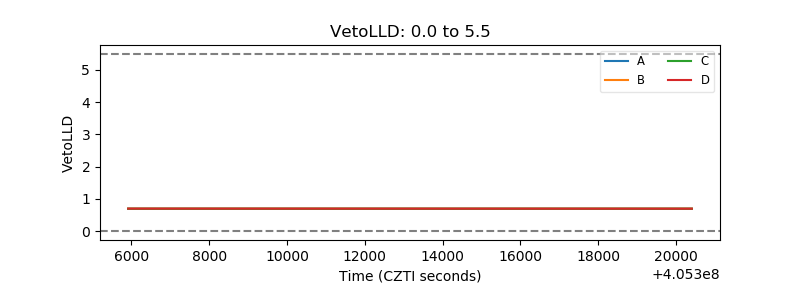 |
| Alpha Counter | 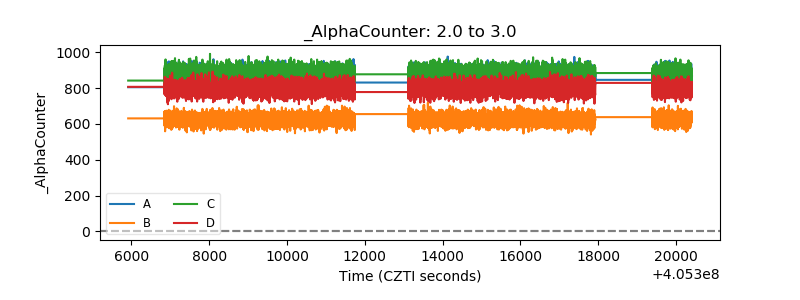 |
| _CPM_Rate | 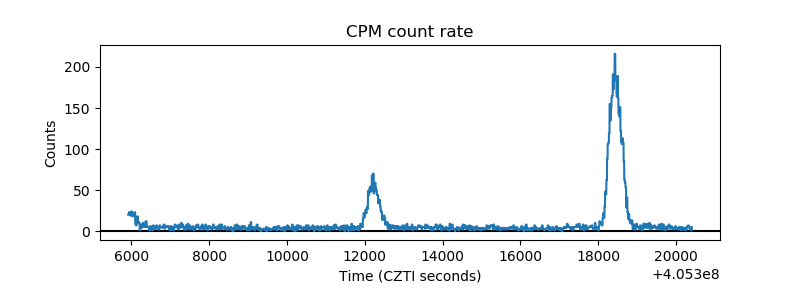 |
| CZT Counter | 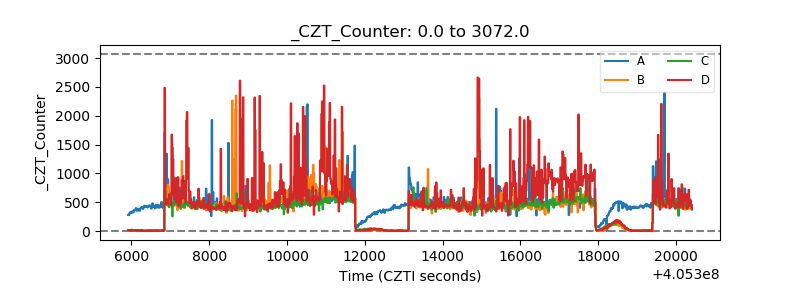 |
| +2.5 Volts monitor | 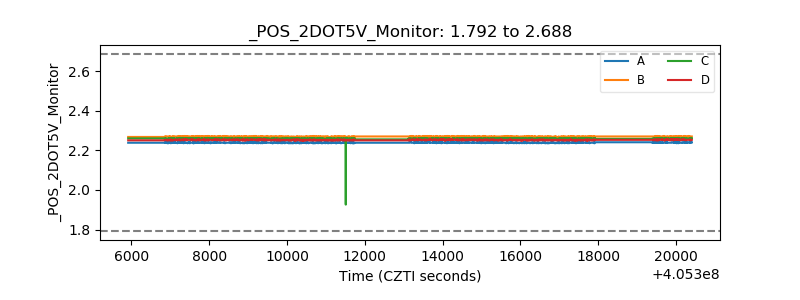 |
| +5 Volts monitor | 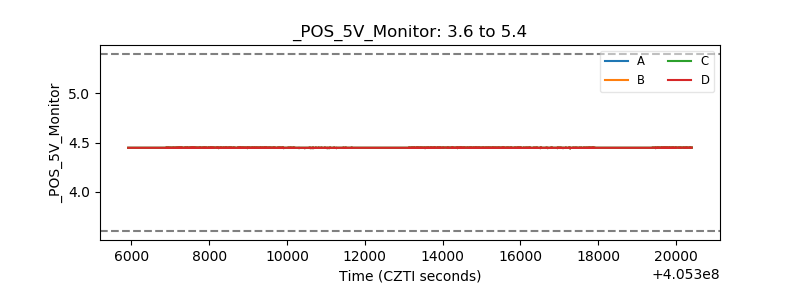 |
| _ROLL_ROT | 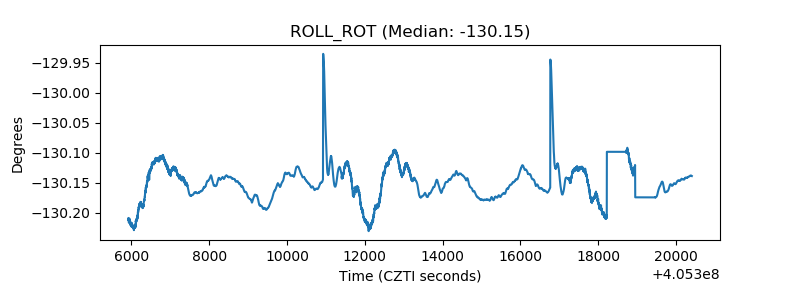 |
| _Roll_DEC | 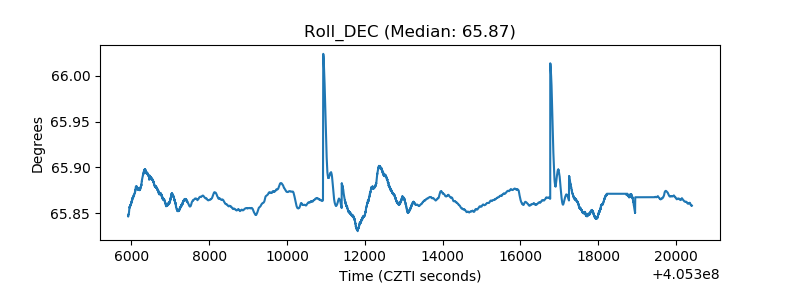 |
| _Roll_RA | 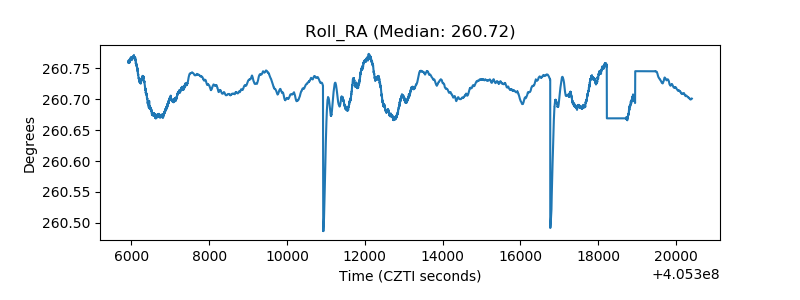 |
| Veto Counter | 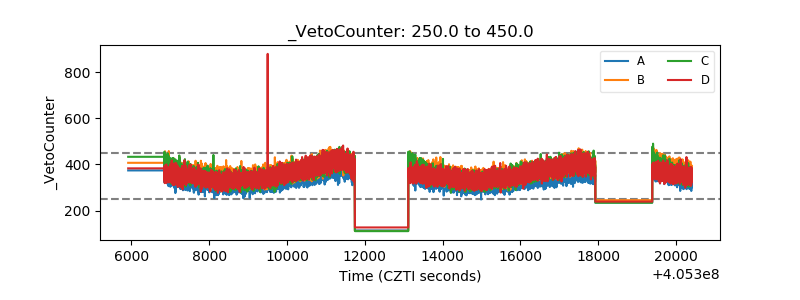 |