| Param | Original file | Final file |
|---|---|---|
| Filename | modeM0/AS1A12_018T01_9000005386_38413cztM0_level2.fits | modeM0/AS1A12_018T01_9000005386_38413cztM0_level2_quad_clean.evt |
| Size (bytes) | 355,184,640 | 91,880,640 |
| Size | 338.7 MB | 87.6 MB |
| Events in quadrant A | 2,997,151 | 622,419 |
| Events in quadrant B | 2,682,132 | 632,339 |
| Events in quadrant C | 2,601,977 | 605,239 |
| Events in quadrant D | 4,435,053 | 534,391 |
| Mode SS | |||
|---|---|---|---|
| Quadrant | BADHDUFLAG | Total packets | Discarded packets |
| A | 0 | 112 | 0 |
| B | 0 | 112 | 0 |
| C | 0 | 112 | 0 |
| D | 0 | 112 | 0 |
| Mode M9 | |||
|---|---|---|---|
| Quadrant | BADHDUFLAG | Total packets | Discarded packets |
| A | 0 | 16 | 0 |
| B | 0 | 16 | 0 |
| C | 0 | 16 | 0 |
| D | 0 | 16 | 0 |
| Mode M0 | |||
|---|---|---|---|
| Quadrant | BADHDUFLAG | Total packets | Discarded packets |
| A | 0 | 12282 | 2 |
| B | 0 | 11665 | 1 |
| C | 0 | 11203 | 1 |
| D | 0 | 17048 | 1 |
| Quadrant | Total seconds | Saturated seconds | Saturation percentage |
|---|---|---|---|
| A | 5542 | 31 | 0.559365% |
| B | 5542 | 43 | 0.775893% |
| C | 5542 | 4 | 0.072176% |
| D | 5542 | 364 | 6.568026% |
Noise dominated data is calculated using 1-second bins in cleaned event files. If a bin has >2000 counts, and if more than 50% of those come from <1% of pixels, then it is considered to be noise-dominated and hence unusable.
| Quadrant | # 1 sec bins | Bins with >0 counts | Bins with >2000 counts | High rate bins dominated by noise | Noise dominated (total time) | Noise dominated (detector-on time) | Marked lightcurve |
|---|---|---|---|---|---|---|---|
| A | 7155 | 5543 | 18 | 18 | 0.25% | 0.32% | 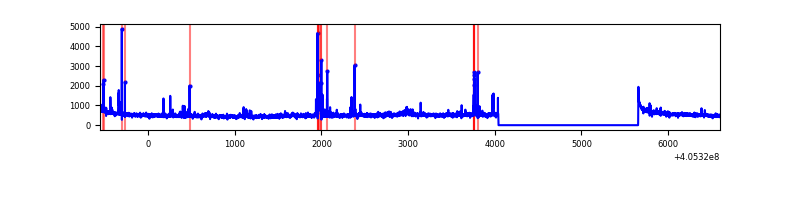 |
| B | 7155 | 5543 | 20 | 20 | 0.28% | 0.36% | 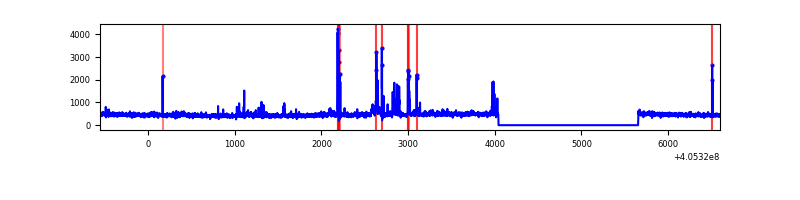 |
| C | 7155 | 5543 | 0 | 0 | 0.00% | 0.00% | 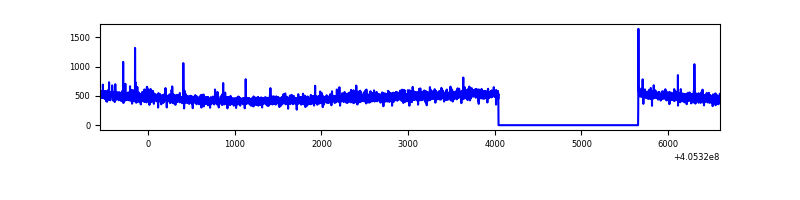 |
| D | 7155 | 5543 | 346 | 346 | 4.84% | 6.24% | 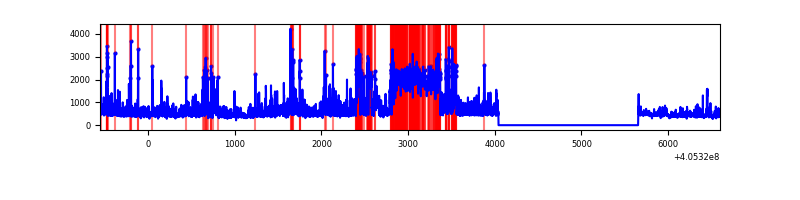 |
Top three noisy pixels from each quadrant. If the there are fewer than three noisy pixels in the level2.evt file, extra rows are filled as -1
| Pixel properties | Quadrant properties | ||||||
|---|---|---|---|---|---|---|---|
| Quadrant | DetID | PixID | Counts | Sigma | Mean | Median | Sigma |
| A | 10 | 83 | 375039 | 2983.97 | 619 | 607 | 125.5 |
| A | 9 | 143 | 99325 | 786.72 | 619 | 607 | 125.5 |
| A | 12 | 189 | 62255 | 491.29 | 619 | 607 | 125.5 |
| B | 4 | 232 | 134765 | 1120.73 | 615 | 598 | 119.7 |
| B | 0 | 183 | 34207 | 280.74 | 615 | 598 | 119.7 |
| B | 10 | 245 | 30454 | 249.39 | 615 | 598 | 119.7 |
| C | 15 | 214 | 237397 | 1694.49 | 598 | 601 | 139.7 |
| C | 5 | 250 | 11174 | 75.66 | 598 | 601 | 139.7 |
| C | 15 | 159 | 8119 | 53.8 | 598 | 601 | 139.7 |
| D | 13 | 249 | 942466 | 6544.7 | 592 | 575 | 143.9 |
| D | 12 | 235 | 648795 | 4504.14 | 592 | 575 | 143.9 |
| D | 2 | 250 | 219304 | 1519.83 | 592 | 575 | 143.9 |
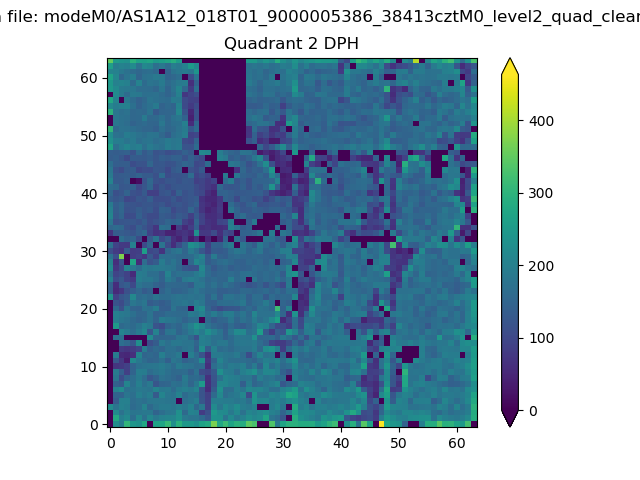
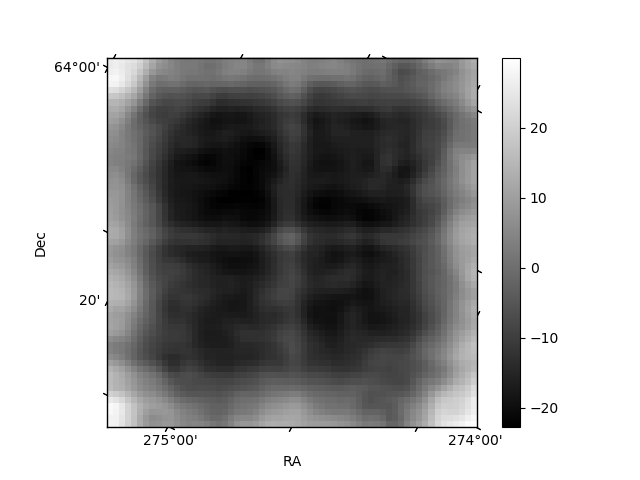
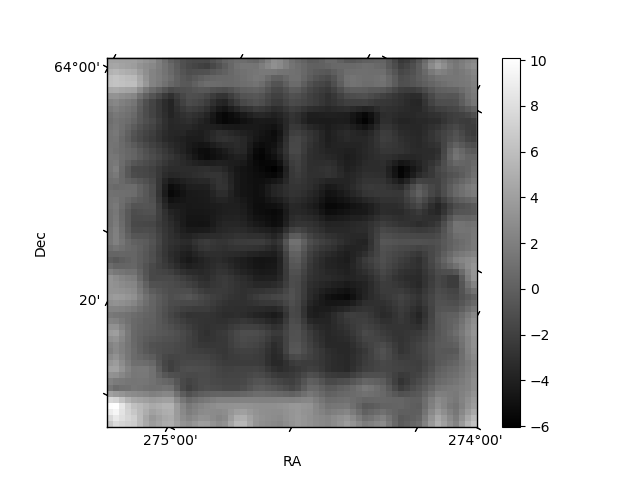
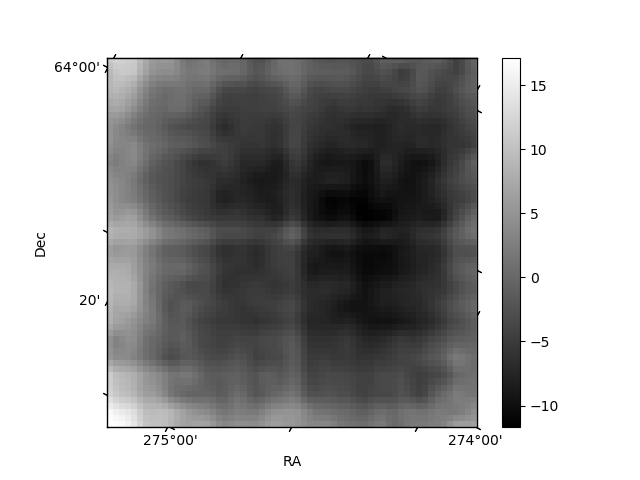
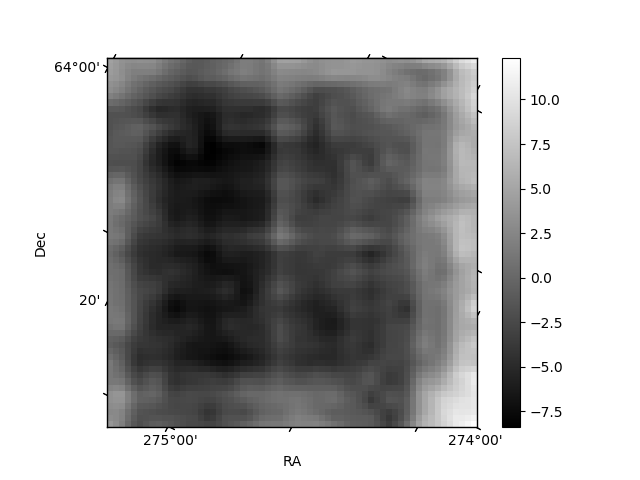
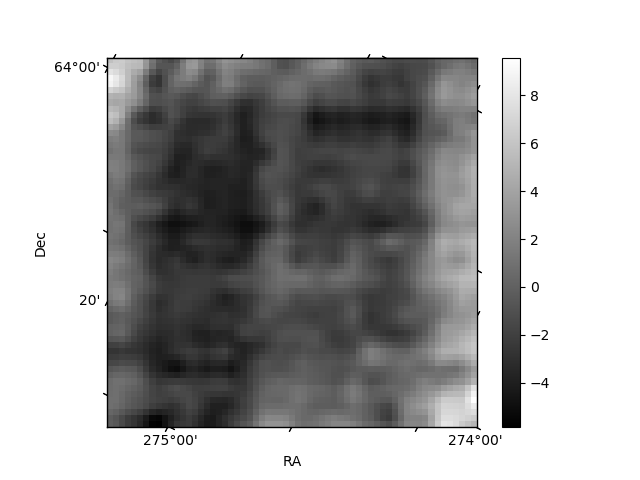
Histogram calculated using DETX and DETY for each event in the final _common_clean file
| Quadrant A | 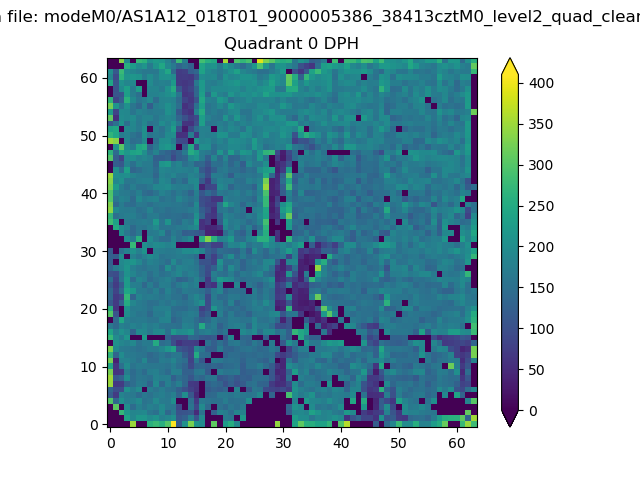 |
 |
Quadrant B |
|---|---|---|---|
| Quadrant D | 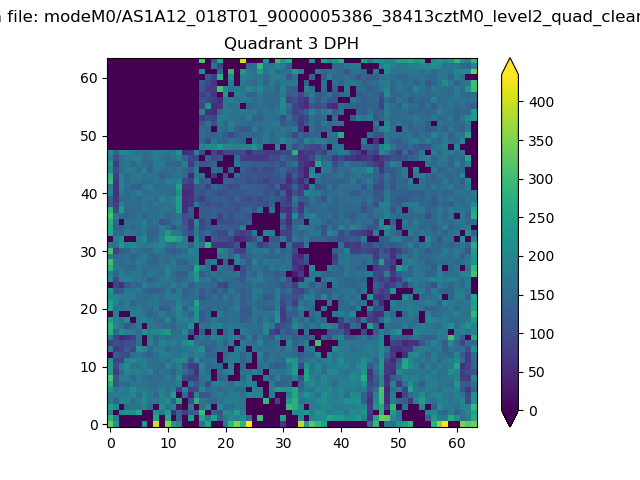 |
 |
Quadrant C |
| Plot type | Count rate plots | Images |
|---|---|---|
| Comparison with Poisson distribution Blue bars denote a histogram of data divided into 1 sec bins. Red curve is a Poisson curve with rate = median count rate of data. |
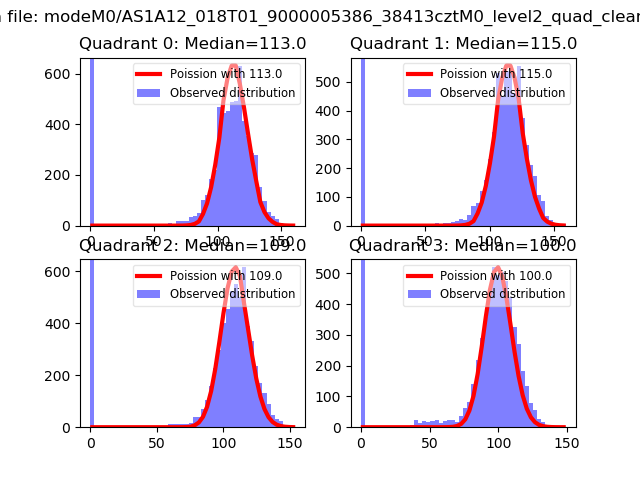 |
 |
| Quadrant-wise count rates Data is divided into 100 sec bins |
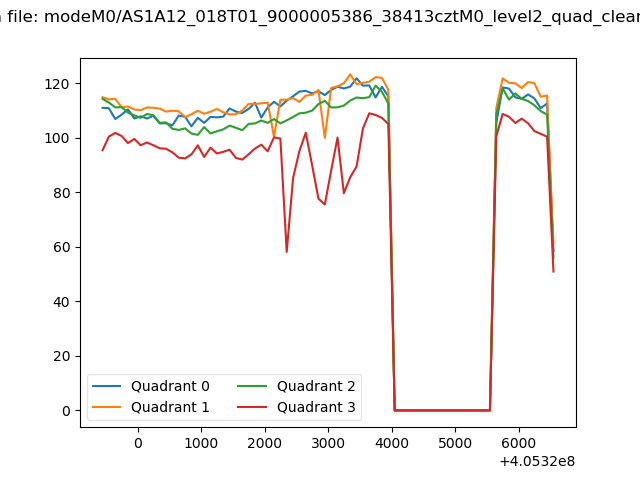 |
|
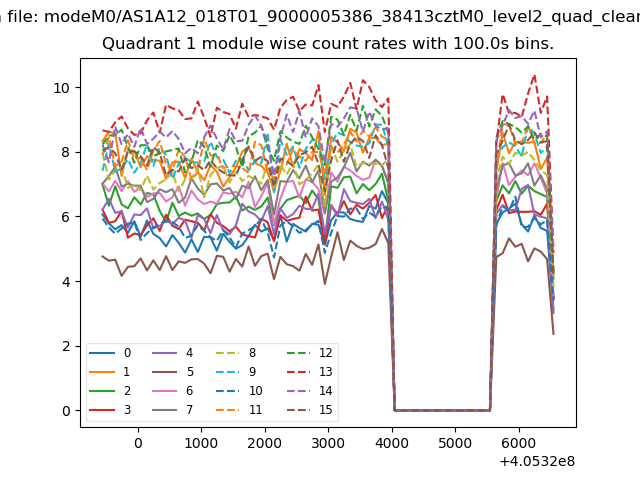
| Module-wise count rates for Quadrant A Data is divided into 100 sec bins |
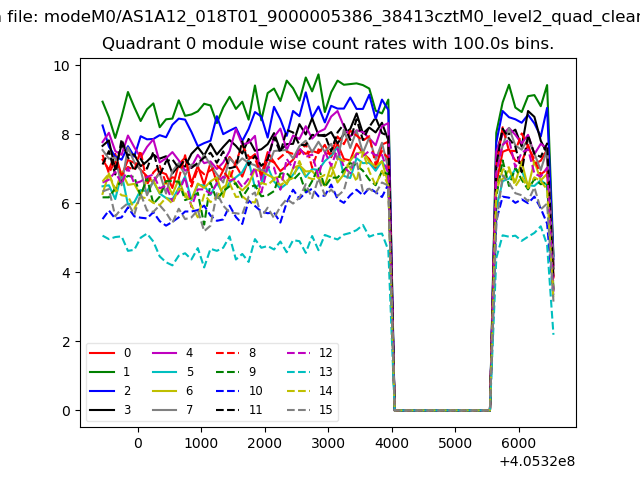 |
 |
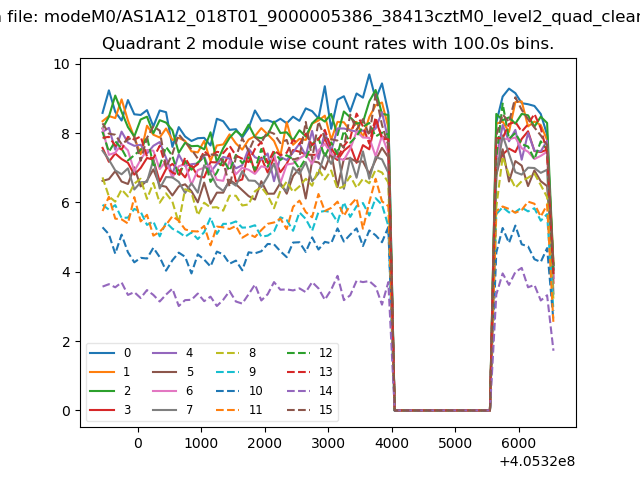
| Module-wise count rates for Quadrant B Data is divided into 100 sec bins |
 |
 |
| Module-wise count rates for Quadrant C Data is divided into 100 sec bins |
 |
 |
| Module-wise count rates for Quadrant D Data is divided into 100 sec bins |
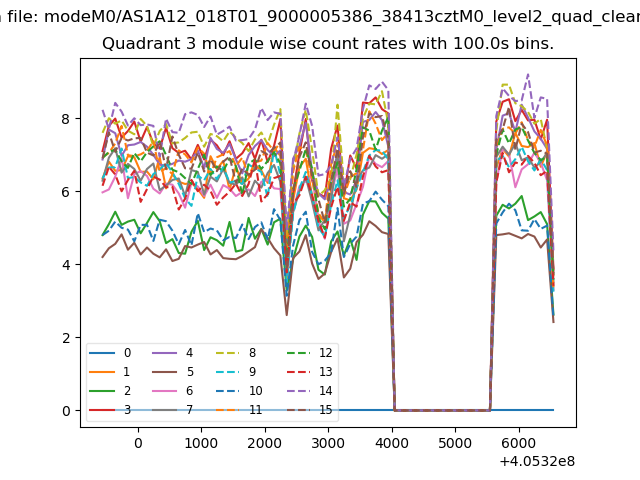 |
 |
| Parameter | Plot |
|---|---|
| CZT HV Monitor | 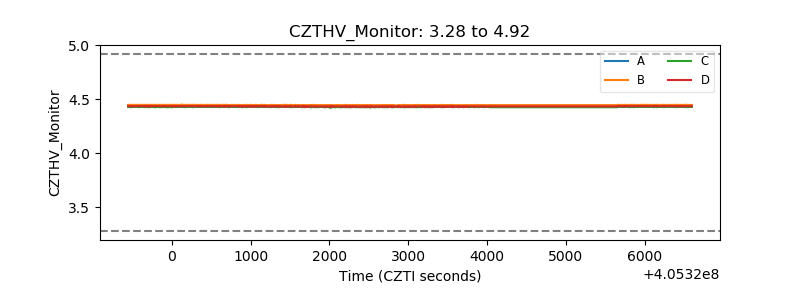 |
| D_VDD | 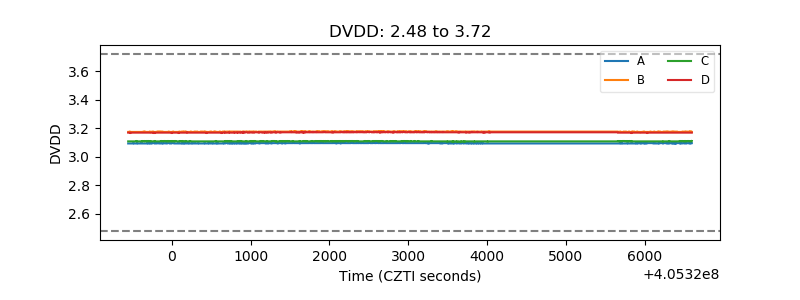 |
| Temperature 1 | 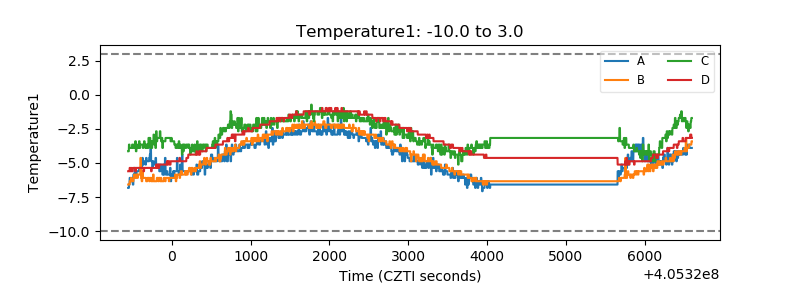 |
| Veto HV Monitor | 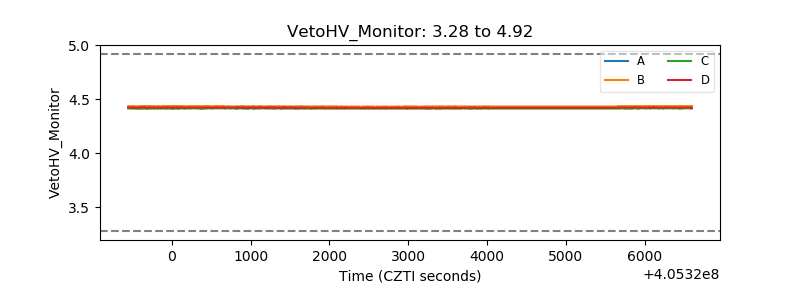 |
| Veto LLD | 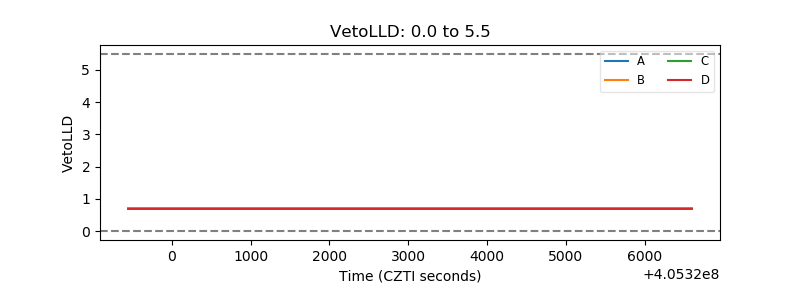 |
| Alpha Counter | 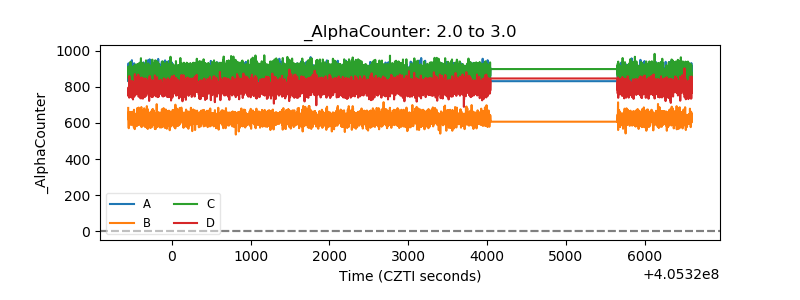 |
| _CPM_Rate | 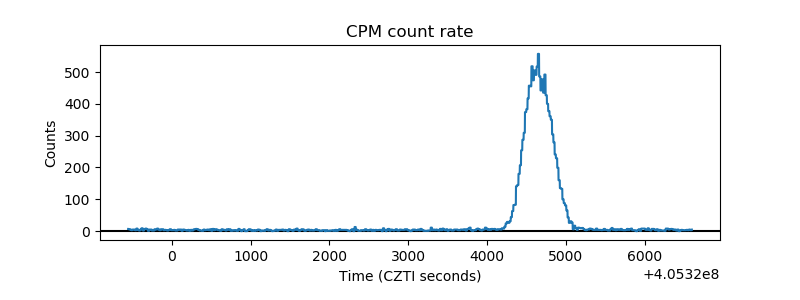 |
| CZT Counter | 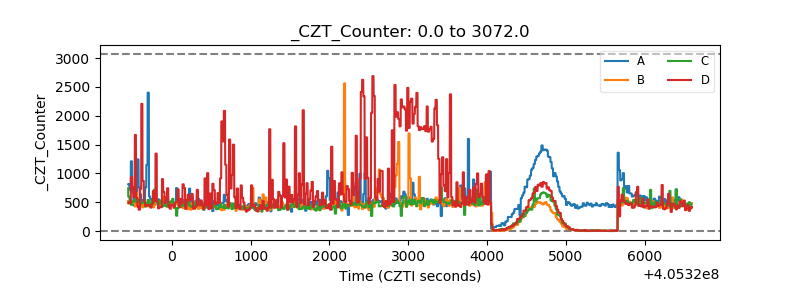 |
| +2.5 Volts monitor | 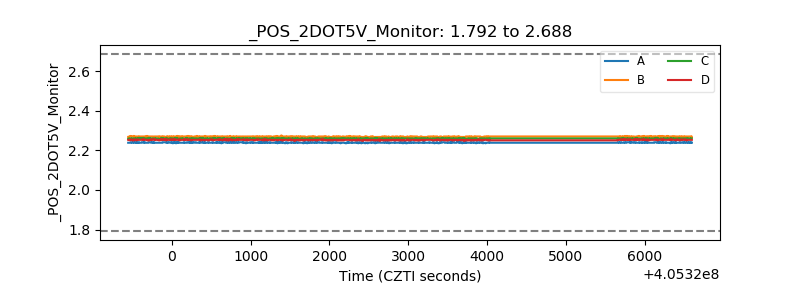 |
| +5 Volts monitor | 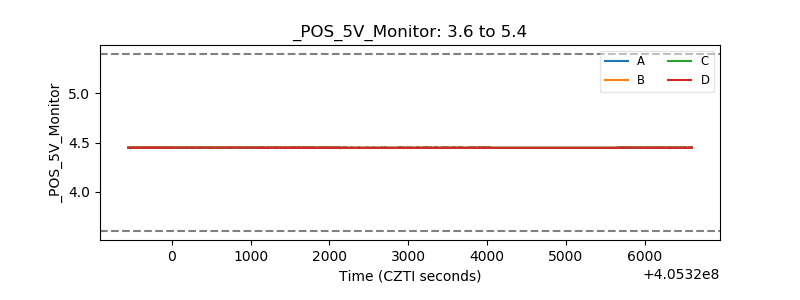 |
| _ROLL_ROT | 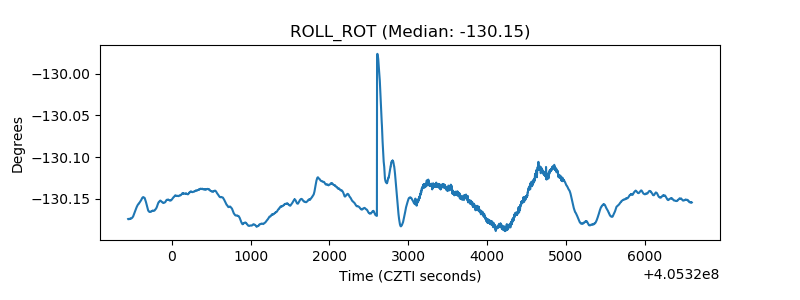 |
| _Roll_DEC | 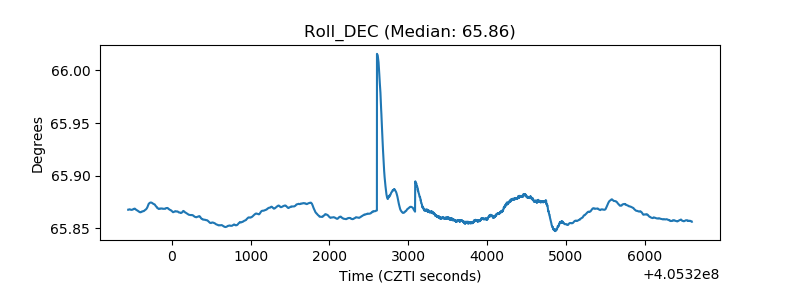 |
| _Roll_RA | 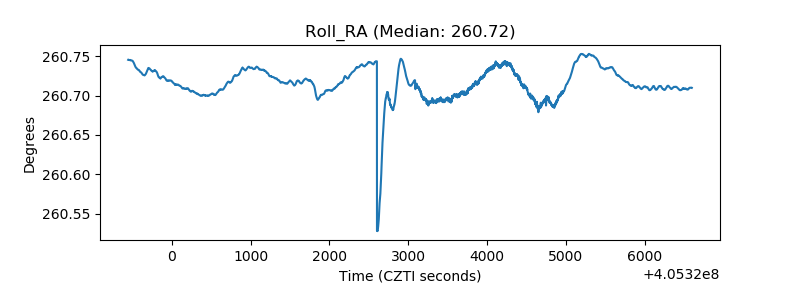 |
| Veto Counter | 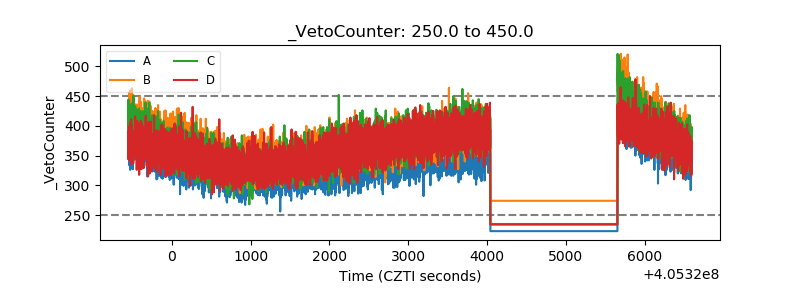 |