| Param | Original file | Final file |
|---|---|---|
| Filename | modeM0/AS1A12_018T01_9000005386_38414cztM0_level2.fits | modeM0/AS1A12_018T01_9000005386_38414cztM0_level2_quad_clean.evt |
| Size (bytes) | 402,857,280 | 91,022,400 |
| Size | 384.2 MB | 86.8 MB |
| Events in quadrant A | 3,118,233 | 632,589 |
| Events in quadrant B | 2,799,530 | 646,058 |
| Events in quadrant C | 2,589,017 | 610,837 |
| Events in quadrant D | 5,980,138 | 483,655 |
| Mode SS | |||
|---|---|---|---|
| Quadrant | BADHDUFLAG | Total packets | Discarded packets |
| A | 0 | 112 | 0 |
| B | 0 | 112 | 0 |
| C | 0 | 112 | 0 |
| D | 0 | 112 | 0 |
| Mode M9 | |||
|---|---|---|---|
| Quadrant | BADHDUFLAG | Total packets | Discarded packets |
| A | 0 | 22 | 0 |
| B | 0 | 22 | 0 |
| C | 0 | 22 | 0 |
| D | 0 | 23 | 0 |
| Mode M0 | |||
|---|---|---|---|
| Quadrant | BADHDUFLAG | Total packets | Discarded packets |
| A | 0 | 12581 | 3 |
| B | 0 | 11916 | 2 |
| C | 0 | 11070 | 2 |
| D | 0 | 21642 | 2 |
| Quadrant | Total seconds | Saturated seconds | Saturation percentage |
|---|---|---|---|
| A | 5470 | 62 | 1.133455% |
| B | 5470 | 61 | 1.115174% |
| C | 5470 | 4 | 0.073126% |
| D | 5470 | 899 | 16.435101% |
Noise dominated data is calculated using 1-second bins in cleaned event files. If a bin has >2000 counts, and if more than 50% of those come from <1% of pixels, then it is considered to be noise-dominated and hence unusable.
| Quadrant | # 1 sec bins | Bins with >0 counts | Bins with >2000 counts | High rate bins dominated by noise | Noise dominated (total time) | Noise dominated (detector-on time) | Marked lightcurve |
|---|---|---|---|---|---|---|---|
| A | 7173 | 5471 | 32 | 32 | 0.45% | 0.58% | 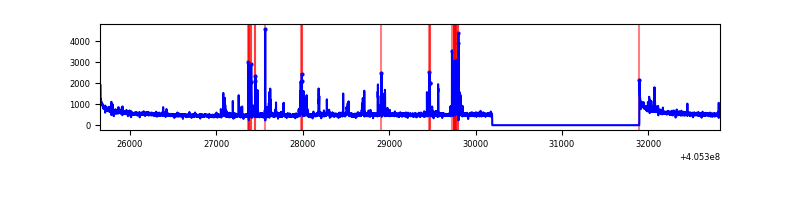 |
| B | 7173 | 5471 | 32 | 32 | 0.45% | 0.58% | 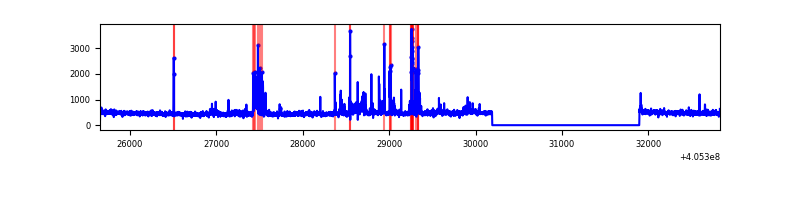 |
| C | 7173 | 5471 | 1 | 1 | 0.01% | 0.02% | 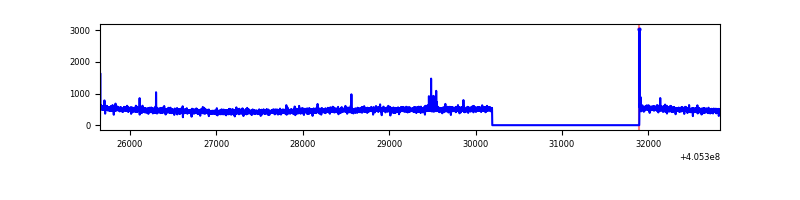 |
| D | 7173 | 5471 | 806 | 806 | 11.24% | 14.73% | 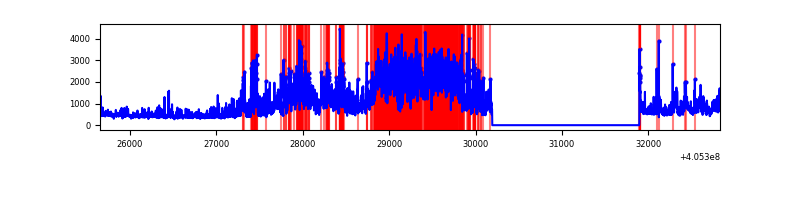 |
Top three noisy pixels from each quadrant. If the there are fewer than three noisy pixels in the level2.evt file, extra rows are filled as -1
| Pixel properties | Quadrant properties | ||||||
|---|---|---|---|---|---|---|---|
| Quadrant | DetID | PixID | Counts | Sigma | Mean | Median | Sigma |
| A | 10 | 83 | 407476 | 3224.09 | 618 | 605 | 126.2 |
| A | 13 | 248 | 196978 | 1556.08 | 618 | 605 | 126.2 |
| A | 9 | 143 | 94201 | 741.67 | 618 | 605 | 126.2 |
| B | 4 | 232 | 198977 | 1704.45 | 610 | 593 | 116.4 |
| B | 4 | 171 | 104113 | 889.41 | 610 | 593 | 116.4 |
| B | 0 | 183 | 28774 | 242.12 | 610 | 593 | 116.4 |
| C | 15 | 214 | 236253 | 1712.16 | 594 | 598 | 137.6 |
| C | 0 | 10 | 11671 | 80.45 | 594 | 598 | 137.6 |
| C | 14 | 254 | 8406 | 56.73 | 594 | 598 | 137.6 |
| D | 12 | 235 | 3001980 | 21372.68 | 568 | 550 | 140.4 |
| D | 2 | 153 | 291505 | 2071.84 | 568 | 550 | 140.4 |
| D | 13 | 249 | 219306 | 1557.72 | 568 | 550 | 140.4 |
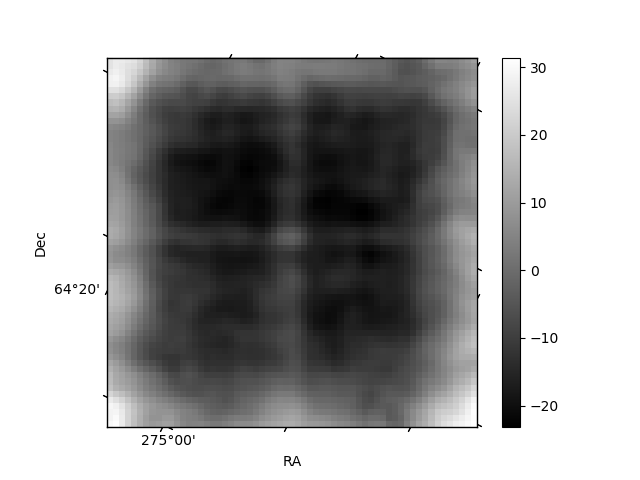
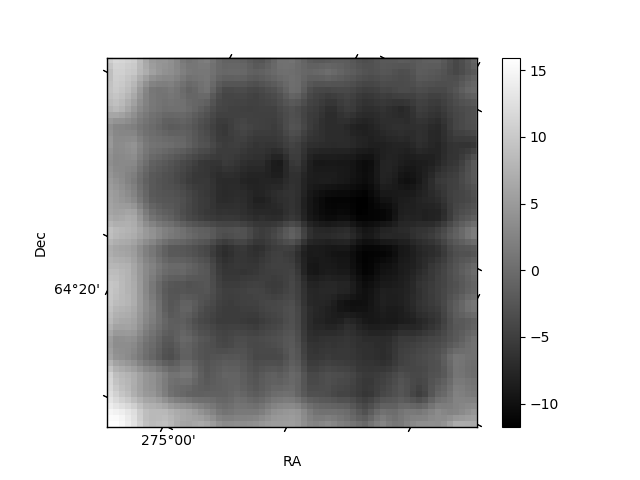
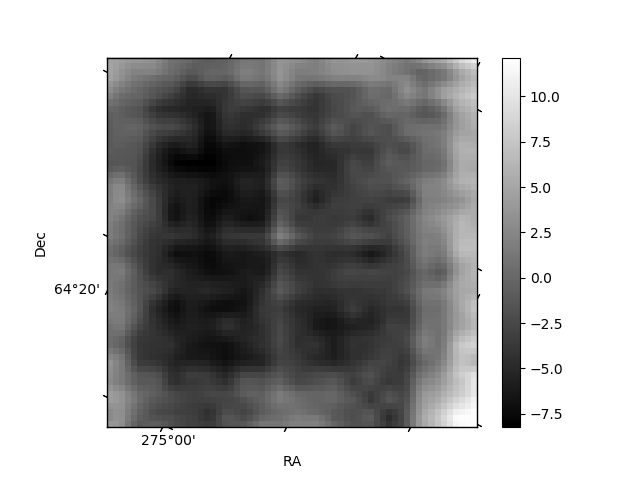
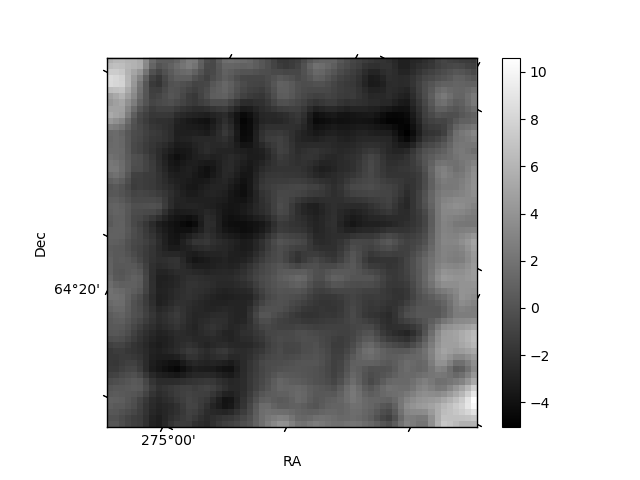
Histogram calculated using DETX and DETY for each event in the final _common_clean file
| Quadrant A | 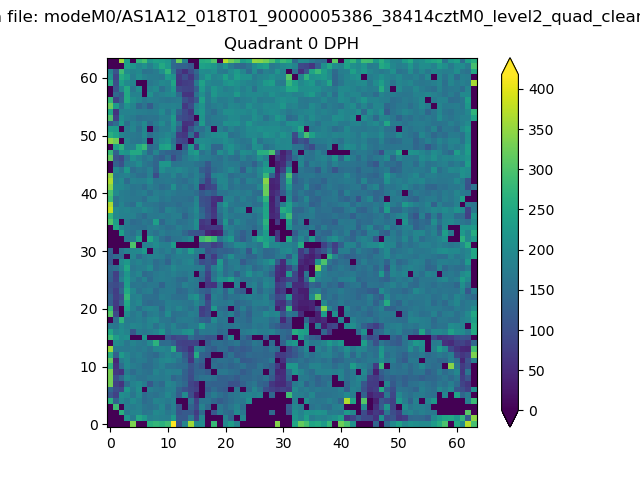 |
 |
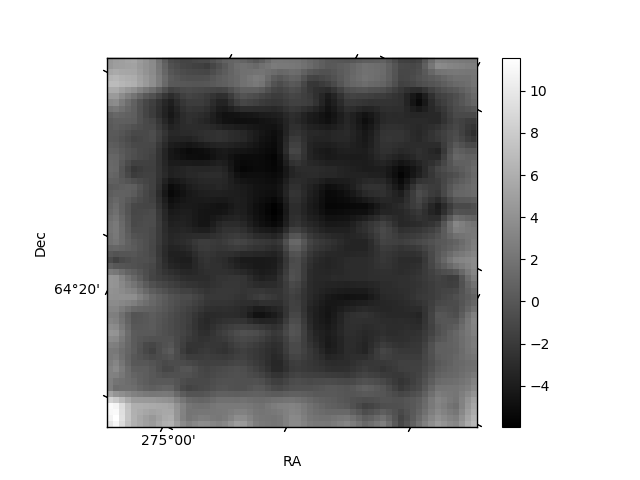
Quadrant B |
|---|---|---|---|
| Quadrant D | 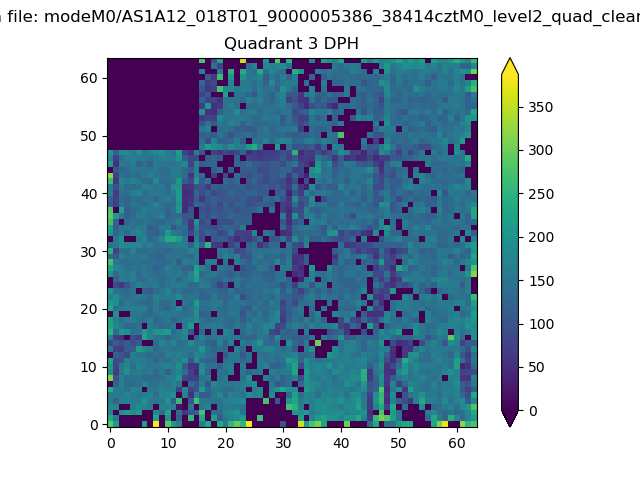 |
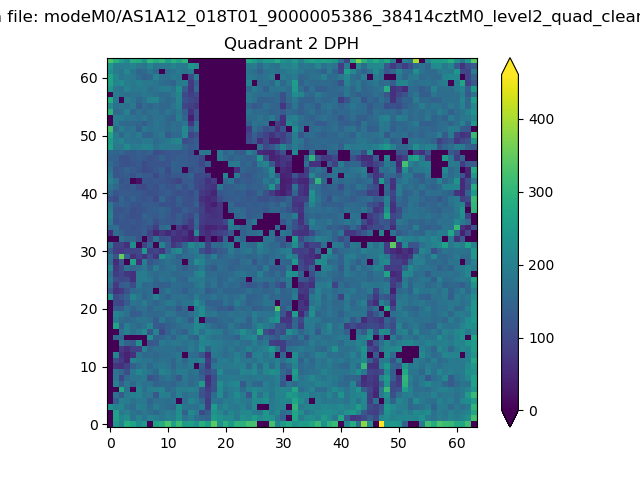 |
Quadrant C |
| Plot type | Count rate plots | Images |
|---|---|---|
| Comparison with Poisson distribution Blue bars denote a histogram of data divided into 1 sec bins. Red curve is a Poisson curve with rate = median count rate of data. |
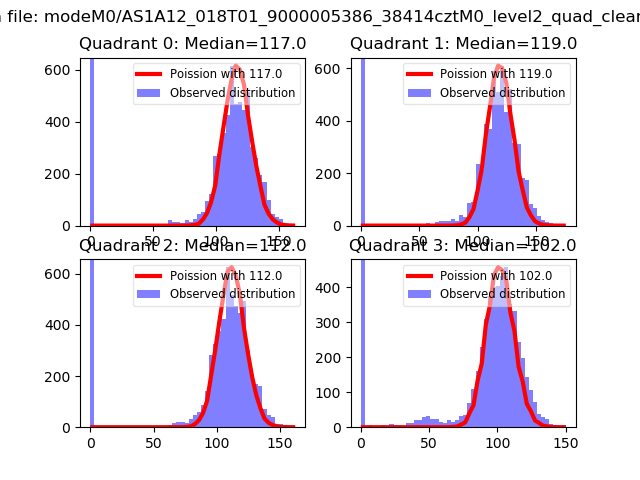 |
 |
| Quadrant-wise count rates Data is divided into 100 sec bins |
 |
|
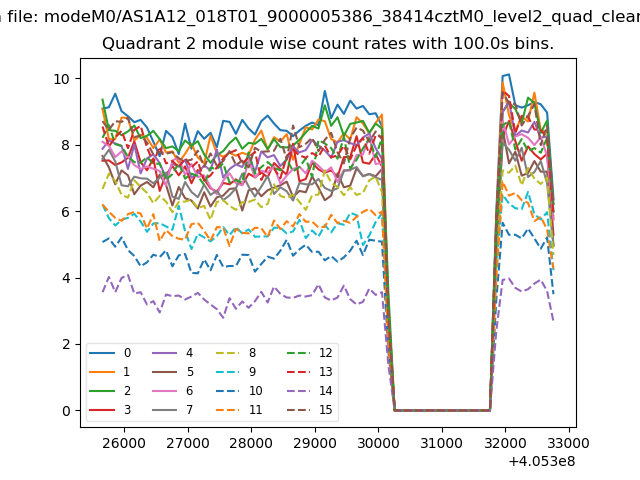
| Module-wise count rates for Quadrant A Data is divided into 100 sec bins |
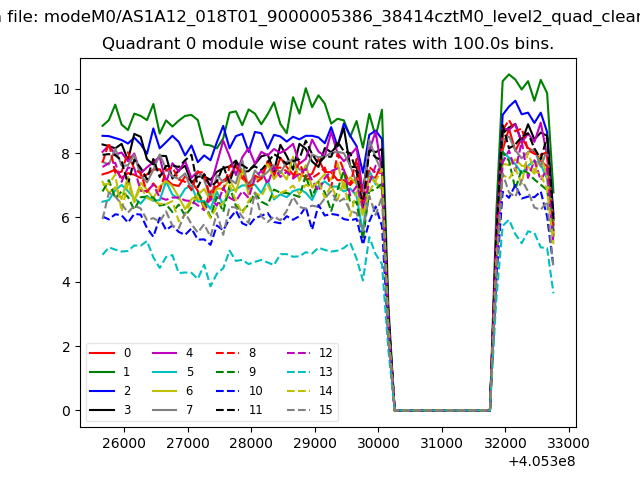 |
 |
| Module-wise count rates for Quadrant B Data is divided into 100 sec bins |
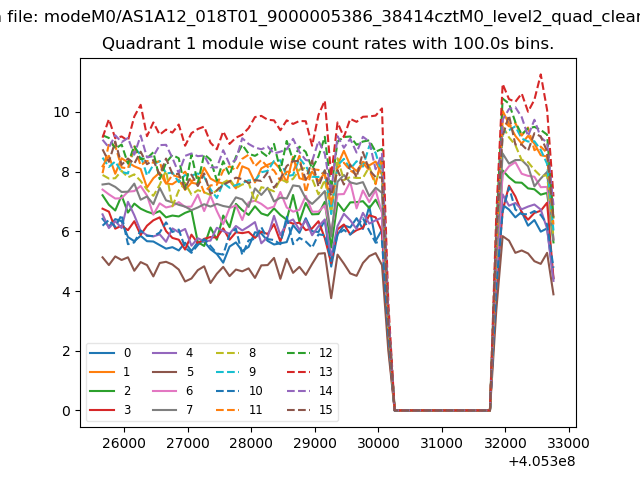 |
 |
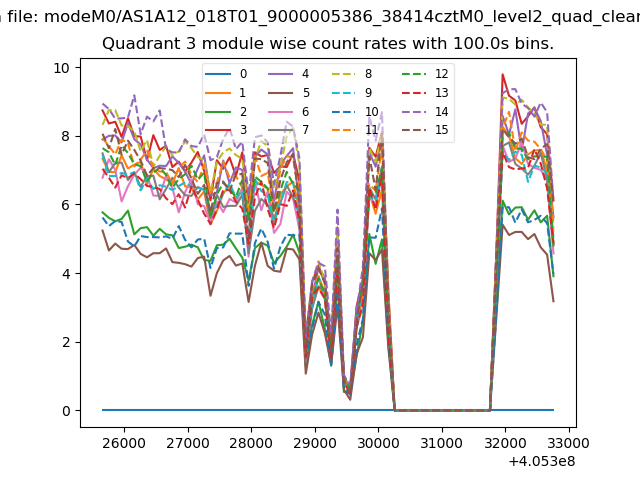
| Module-wise count rates for Quadrant C Data is divided into 100 sec bins |
 |
 |
| Module-wise count rates for Quadrant D Data is divided into 100 sec bins |
 |
 |
| Parameter | Plot |
|---|---|
| CZT HV Monitor | 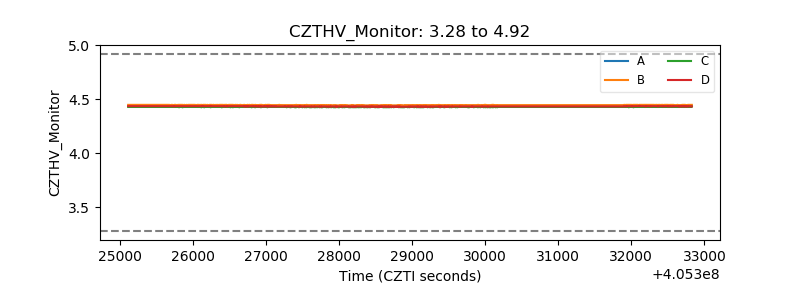 |
| D_VDD | 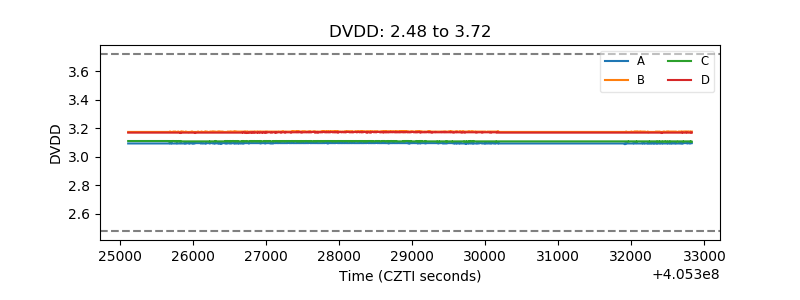 |
| Temperature 1 | 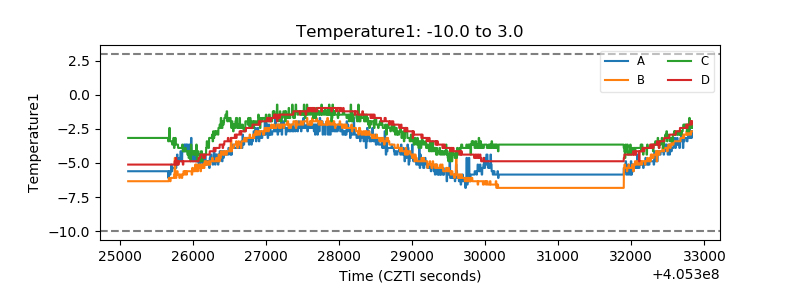 |
| Veto HV Monitor | 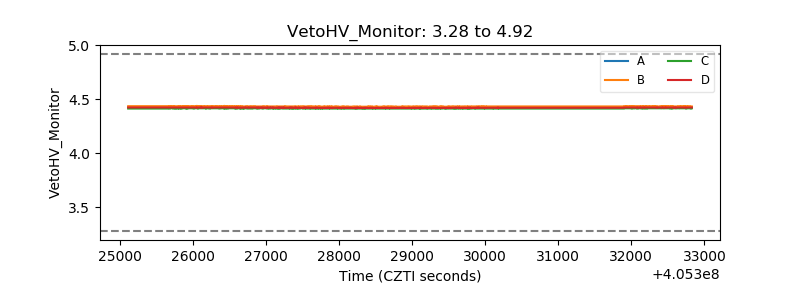 |
| Veto LLD | 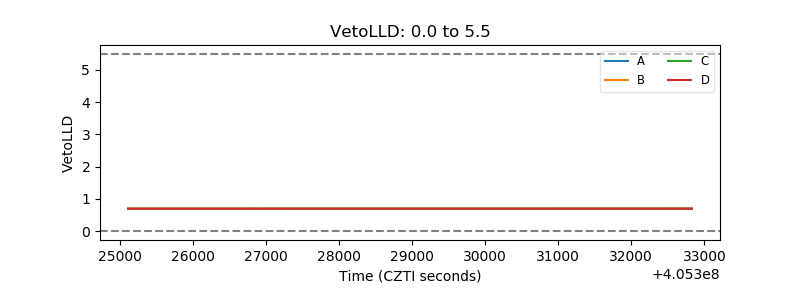 |
| Alpha Counter | 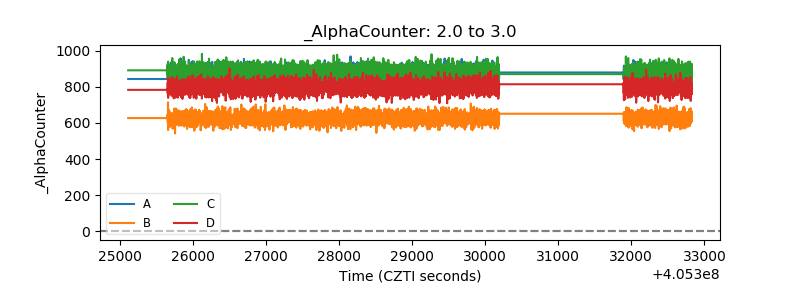 |
| _CPM_Rate |  |
| CZT Counter | 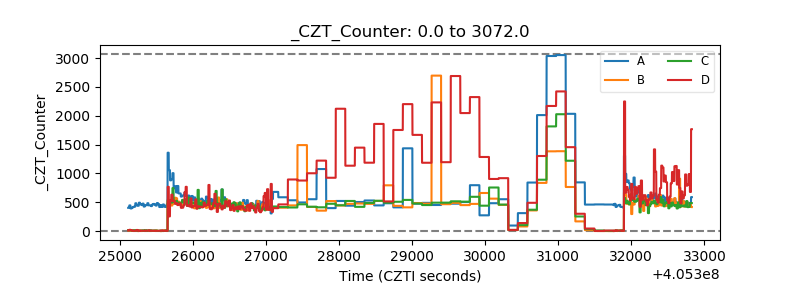 |
| +2.5 Volts monitor |  |
| +5 Volts monitor | 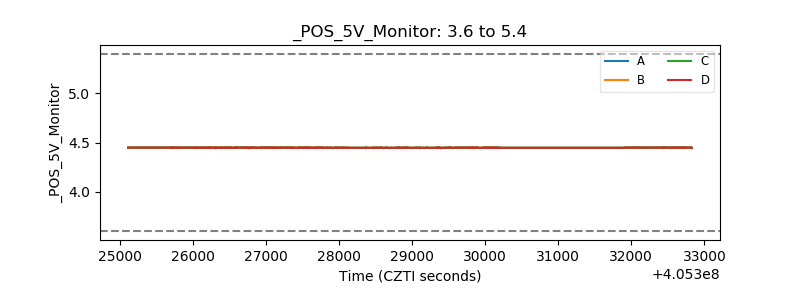 |
| _ROLL_ROT | 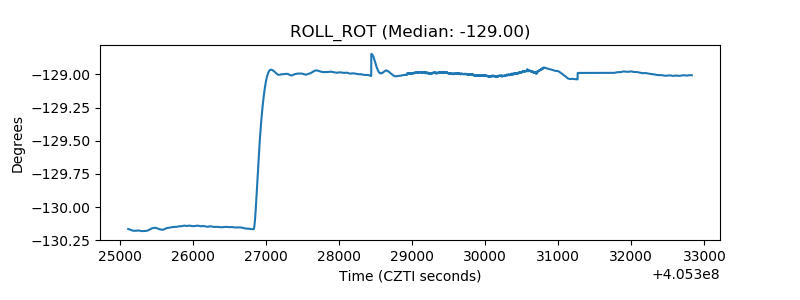 |
| _Roll_DEC | 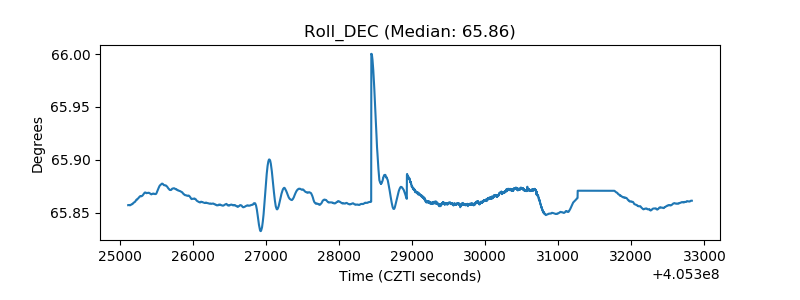 |
| _Roll_RA | 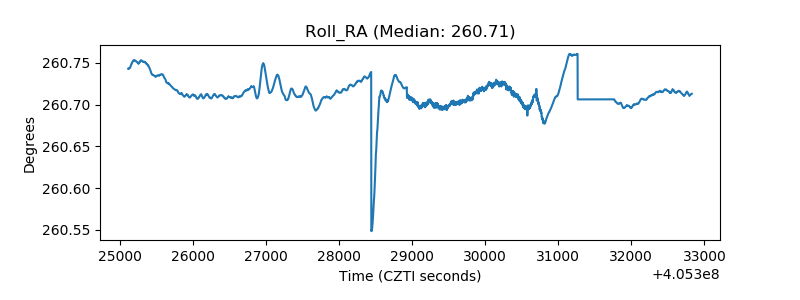 |
| Veto Counter | 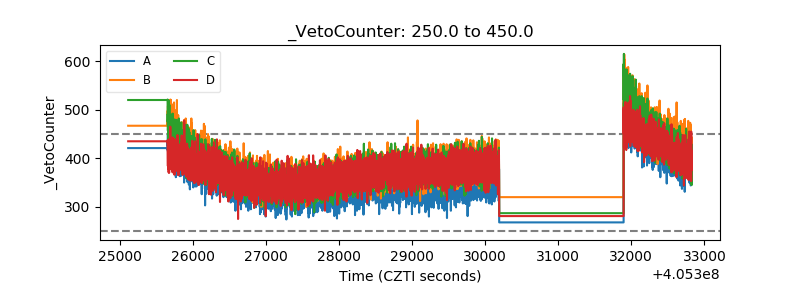 |