| Param | Original file | Final file |
|---|---|---|
| Filename | modeM0/AS1A12_018T01_9000005386_38416cztM0_level2.fits | modeM0/AS1A12_018T01_9000005386_38416cztM0_level2_quad_clean.evt |
| Size (bytes) | 444,119,040 | 89,579,520 |
| Size | 423.5 MB | 85.4 MB |
| Events in quadrant A | 2,949,007 | 647,268 |
| Events in quadrant B | 2,791,840 | 659,513 |
| Events in quadrant C | 2,599,971 | 616,922 |
| Events in quadrant D | 7,686,417 | 416,896 |
| Mode SS | |||
|---|---|---|---|
| Quadrant | BADHDUFLAG | Total packets | Discarded packets |
| A | 0 | 110 | 0 |
| B | 0 | 110 | 0 |
| C | 0 | 110 | 0 |
| D | 0 | 110 | 0 |
| Mode M9 | |||
|---|---|---|---|
| Quadrant | BADHDUFLAG | Total packets | Discarded packets |
| A | 0 | 18 | 0 |
| B | 0 | 18 | 0 |
| C | 0 | 18 | 0 |
| D | 0 | 19 | 0 |
| Mode M0 | |||
|---|---|---|---|
| Quadrant | BADHDUFLAG | Total packets | Discarded packets |
| A | 0 | 11921 | 3 |
| B | 0 | 11612 | 2 |
| C | 0 | 10917 | 2 |
| D | 0 | 26516 | 2 |
| Quadrant | Total seconds | Saturated seconds | Saturation percentage |
|---|---|---|---|
| A | 5305 | 41 | 0.772856% |
| B | 5305 | 57 | 1.074458% |
| C | 5305 | 12 | 0.226202% |
| D | 5305 | 1664 | 31.366635% |
Noise dominated data is calculated using 1-second bins in cleaned event files. If a bin has >2000 counts, and if more than 50% of those come from <1% of pixels, then it is considered to be noise-dominated and hence unusable.
| Quadrant | # 1 sec bins | Bins with >0 counts | Bins with >2000 counts | High rate bins dominated by noise | Noise dominated (total time) | Noise dominated (detector-on time) | Marked lightcurve |
|---|---|---|---|---|---|---|---|
| A | 7127 | 5306 | 25 | 25 | 0.35% | 0.47% | 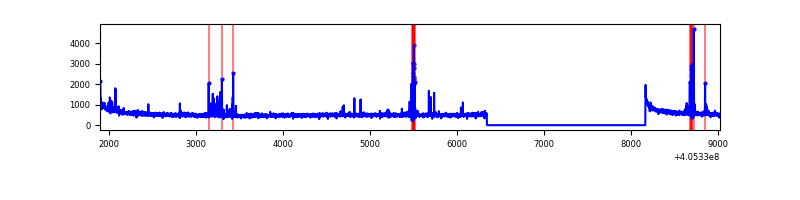 |
| B | 7127 | 5306 | 31 | 31 | 0.43% | 0.58% | 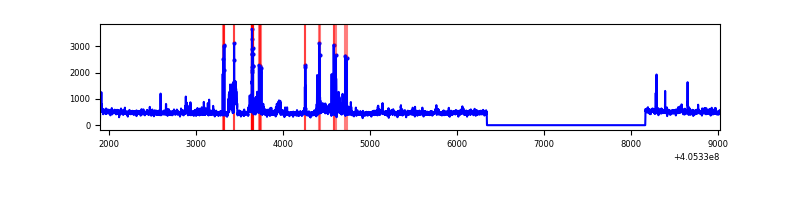 |
| C | 7127 | 5306 | 9 | 9 | 0.13% | 0.17% | 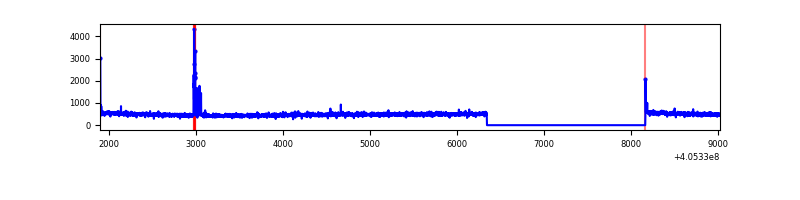 |
| D | 7127 | 5306 | 1584 | 1584 | 22.23% | 29.85% | 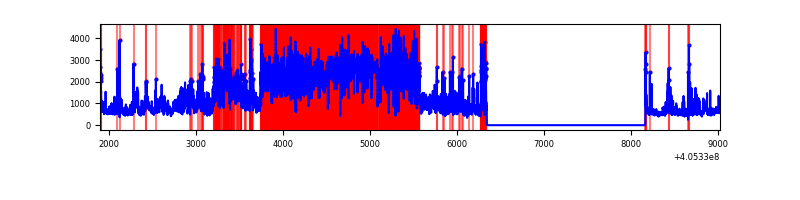 |
Top three noisy pixels from each quadrant. If the there are fewer than three noisy pixels in the level2.evt file, extra rows are filled as -1
| Pixel properties | Quadrant properties | ||||||
|---|---|---|---|---|---|---|---|
| Quadrant | DetID | PixID | Counts | Sigma | Mean | Median | Sigma |
| A | 10 | 83 | 395320 | 3195.99 | 613 | 602 | 123.5 |
| A | 13 | 248 | 107405 | 864.77 | 613 | 602 | 123.5 |
| A | 9 | 143 | 41167 | 328.45 | 613 | 602 | 123.5 |
| B | 4 | 232 | 219527 | 1908.51 | 605 | 589 | 114.7 |
| B | 0 | 183 | 74103 | 640.83 | 605 | 589 | 114.7 |
| B | 4 | 171 | 44034 | 378.72 | 605 | 589 | 114.7 |
| C | 15 | 214 | 227831 | 1672.99 | 588 | 591 | 135.8 |
| C | 14 | 254 | 59035 | 430.28 | 588 | 591 | 135.8 |
| C | 0 | 10 | 15460 | 109.47 | 588 | 591 | 135.8 |
| D | 12 | 235 | 4528844 | 35397.53 | 522 | 507 | 127.9 |
| D | 12 | 2 | 386321 | 3015.87 | 522 | 507 | 127.9 |
| D | 2 | 250 | 296010 | 2309.92 | 522 | 507 | 127.9 |
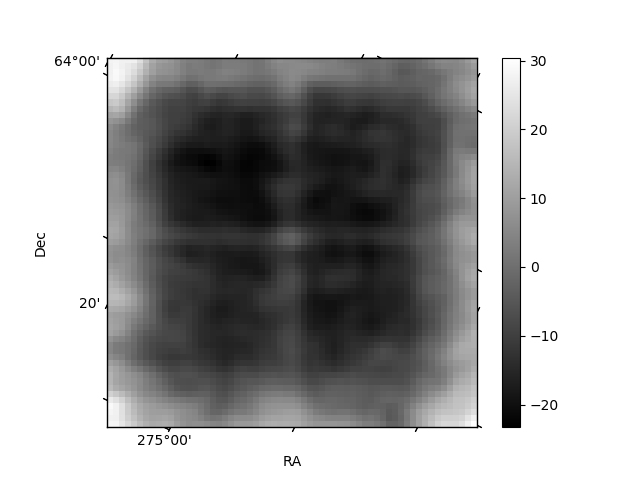
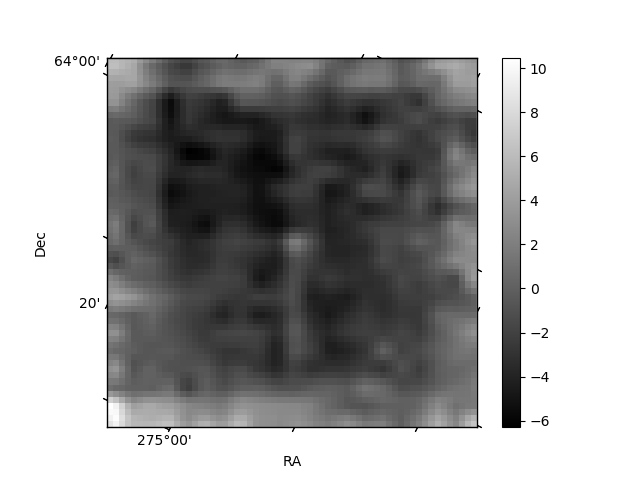
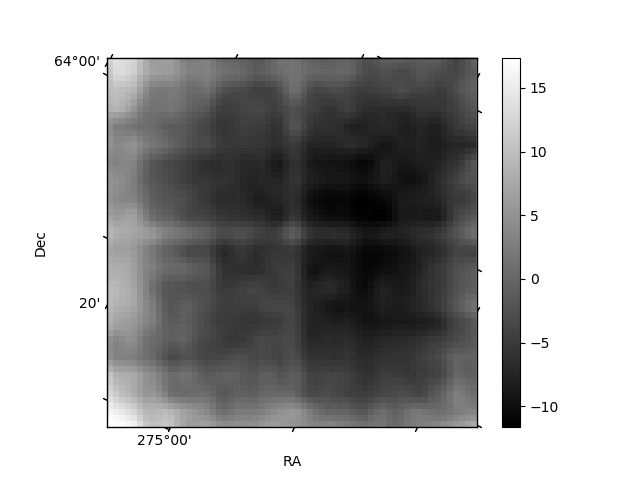
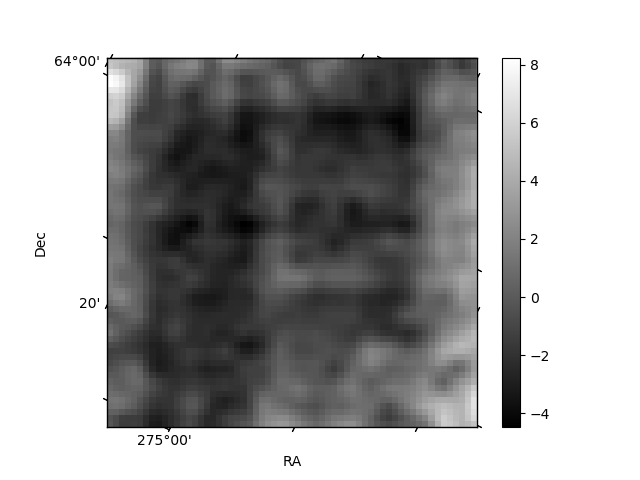
Histogram calculated using DETX and DETY for each event in the final _common_clean file
| Quadrant A | 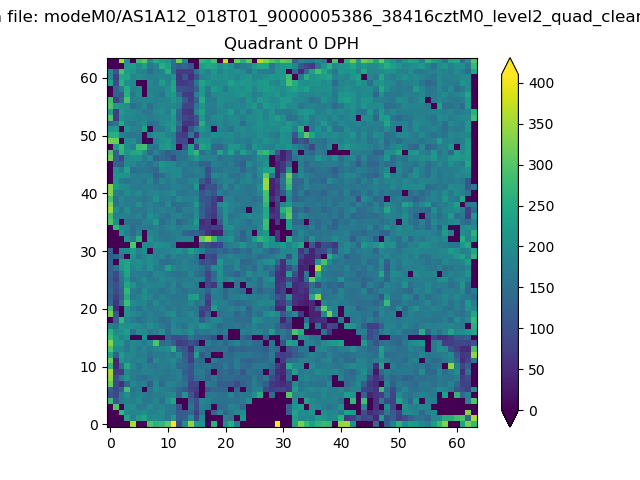 |
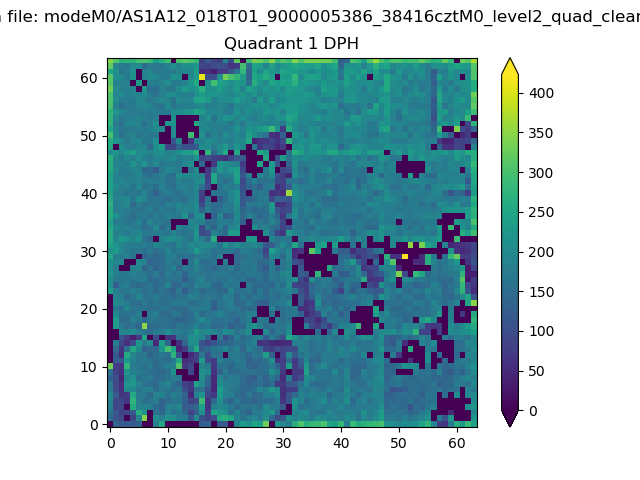 |
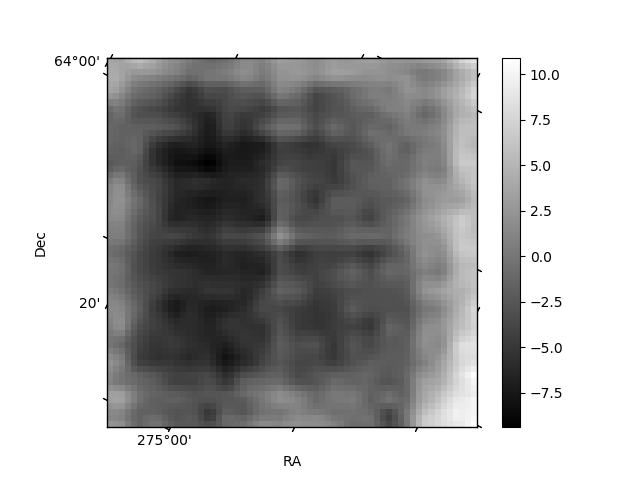
Quadrant B |
|---|---|---|---|
| Quadrant D | 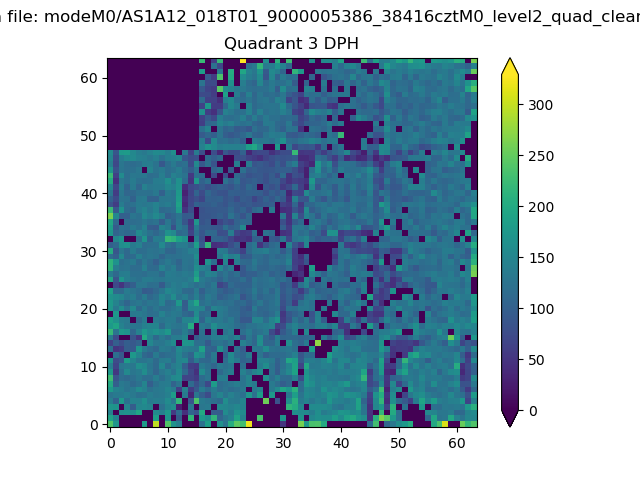 |
 |
Quadrant C |
| Plot type | Count rate plots | Images |
|---|---|---|
| Comparison with Poisson distribution Blue bars denote a histogram of data divided into 1 sec bins. Red curve is a Poisson curve with rate = median count rate of data. |
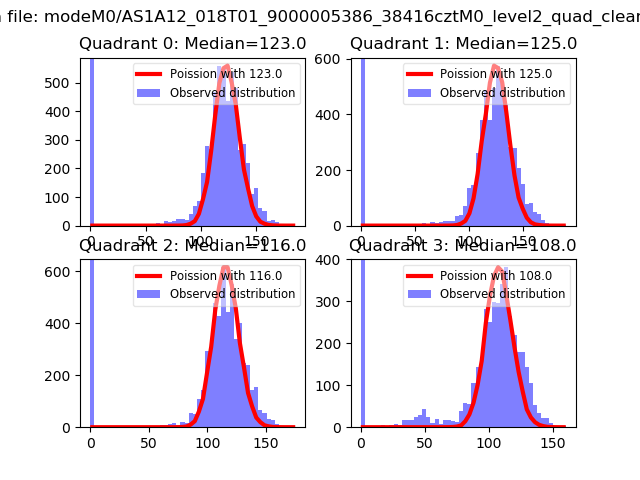 |
 |
| Quadrant-wise count rates Data is divided into 100 sec bins |
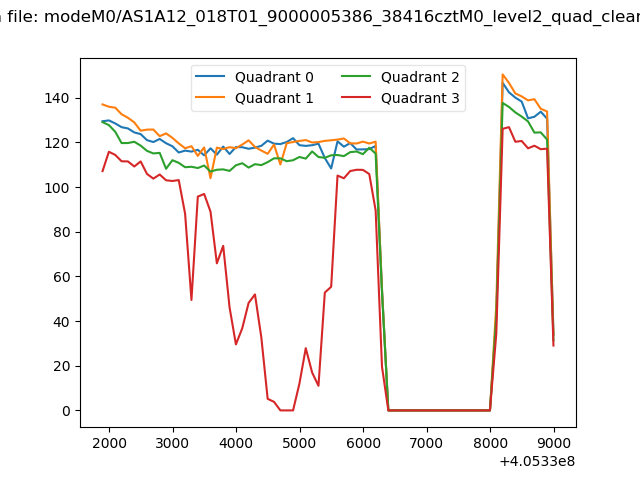 |
|
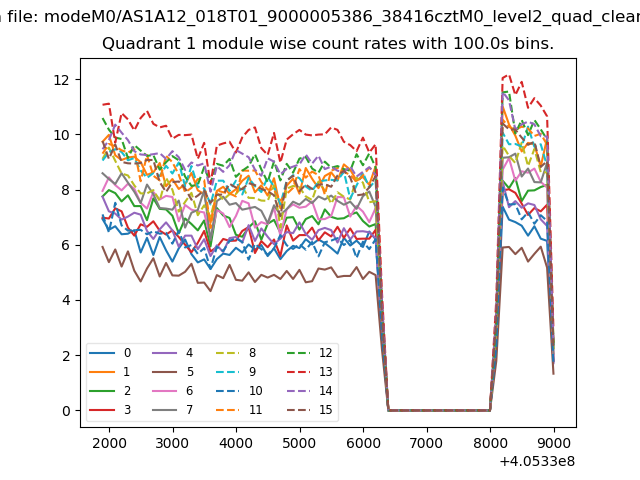
| Module-wise count rates for Quadrant A Data is divided into 100 sec bins |
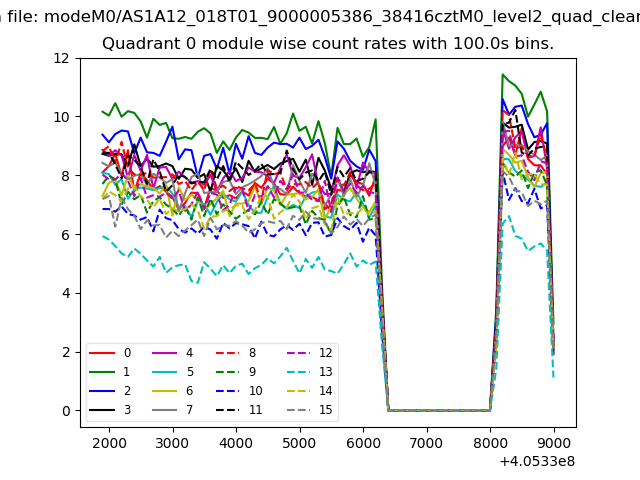 |
 |
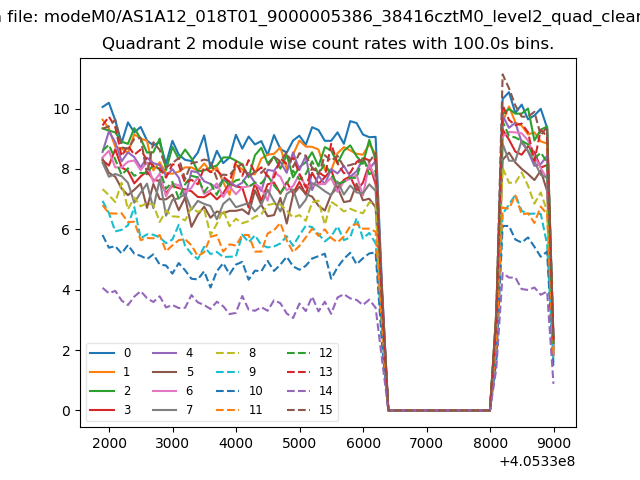
| Module-wise count rates for Quadrant B Data is divided into 100 sec bins |
 |
 |
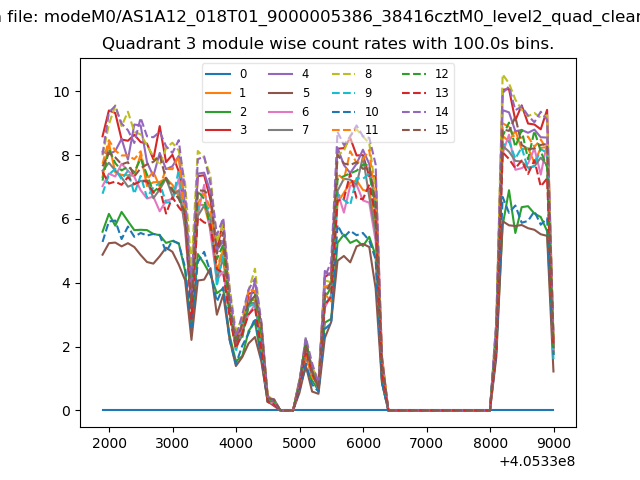
| Module-wise count rates for Quadrant C Data is divided into 100 sec bins |
 |
 |
| Module-wise count rates for Quadrant D Data is divided into 100 sec bins |
 |
 |
| Parameter | Plot |
|---|---|
| CZT HV Monitor | 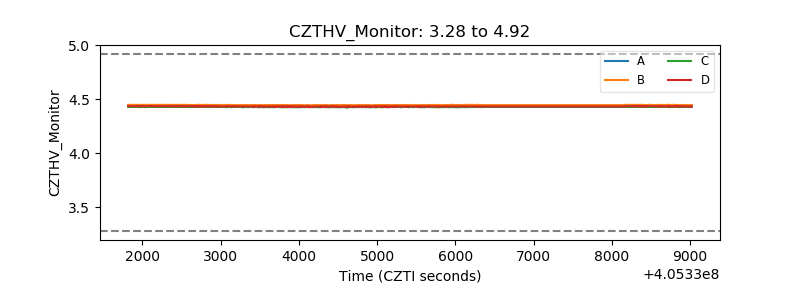 |
| D_VDD | 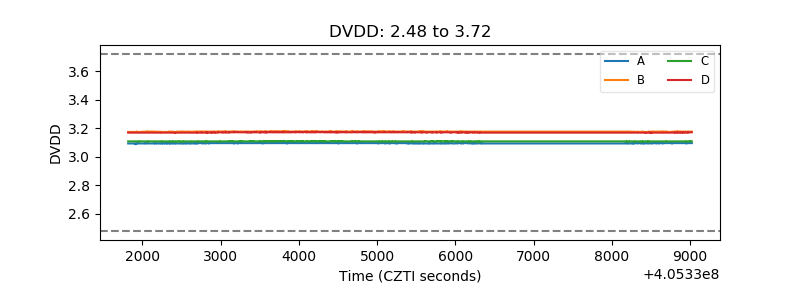 |
| Temperature 1 | 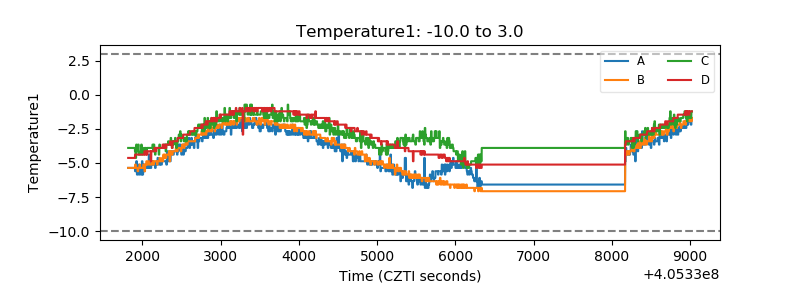 |
| Veto HV Monitor |  |
| Veto LLD | 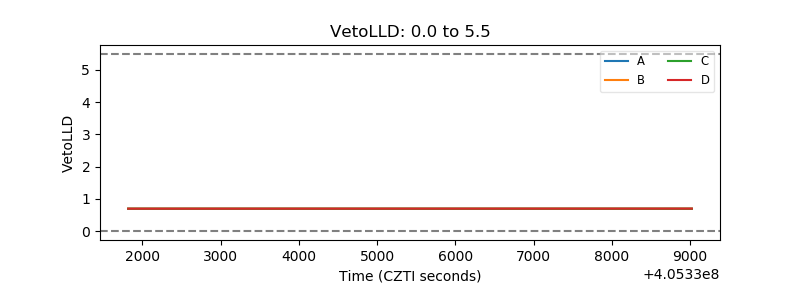 |
| Alpha Counter | 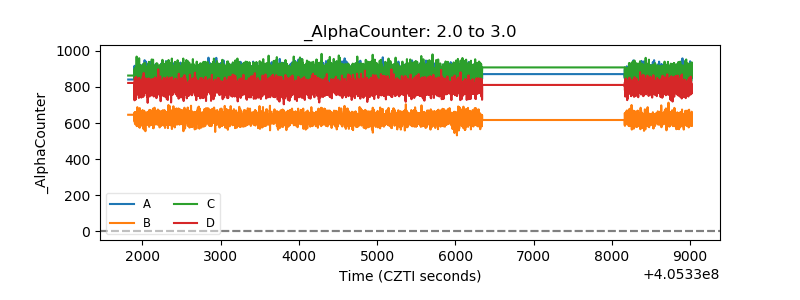 |
| _CPM_Rate | 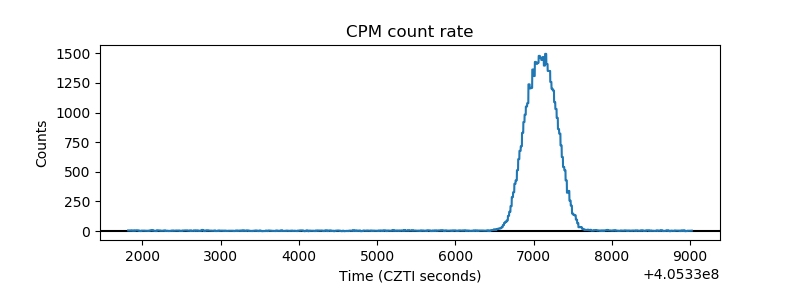 |
| CZT Counter |  |
| +2.5 Volts monitor |  |
| +5 Volts monitor | 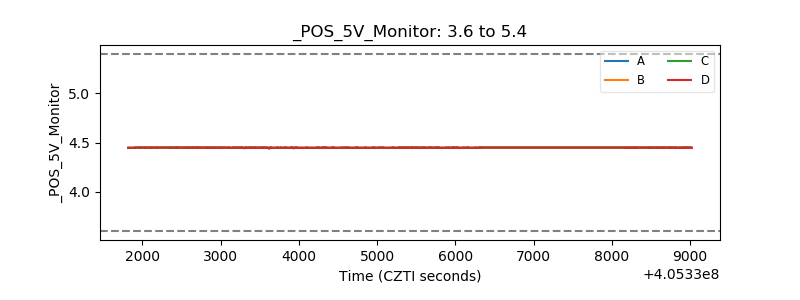 |
| _ROLL_ROT | 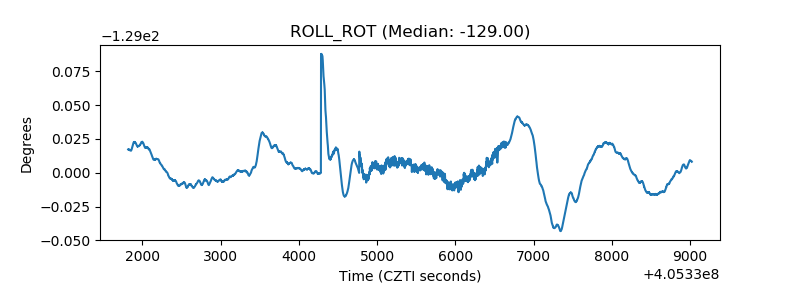 |
| _Roll_DEC |  |
| _Roll_RA | 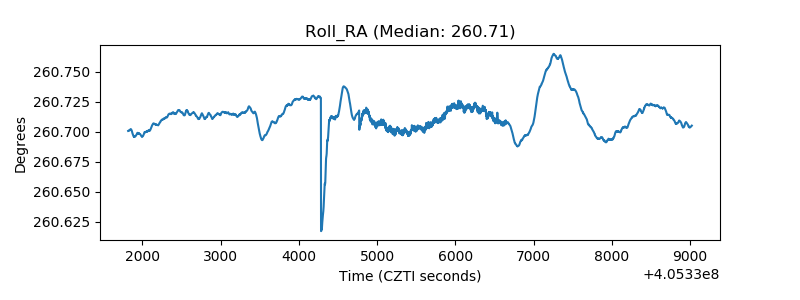 |
| Veto Counter | 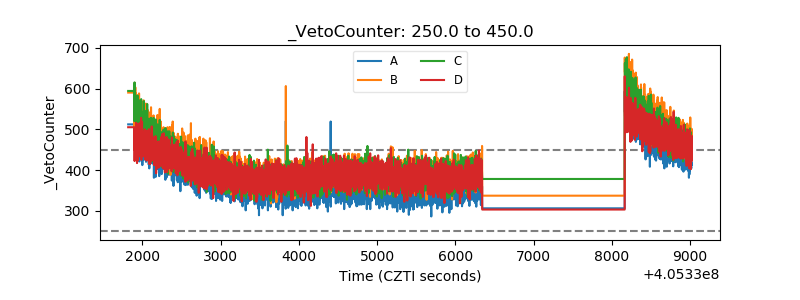 |