| Param | Original file | Final file |
|---|---|---|
| Filename | modeM0/AS1A12_018T01_9000005386_38417cztM0_level2.fits | modeM0/AS1A12_018T01_9000005386_38417cztM0_level2_quad_clean.evt |
| Size (bytes) | 724,766,400 | 156,332,160 |
| Size | 691.2 MB | 149.1 MB |
| Events in quadrant A | 4,985,891 | 1,116,541 |
| Events in quadrant B | 4,797,173 | 1,131,776 |
| Events in quadrant C | 4,451,416 | 1,063,036 |
| Events in quadrant D | 11,894,291 | 795,832 |
| Mode SS | |||
|---|---|---|---|
| Quadrant | BADHDUFLAG | Total packets | Discarded packets |
| A | 0 | 184 | 0 |
| B | 0 | 184 | 0 |
| C | 0 | 184 | 0 |
| D | 0 | 184 | 0 |
| Mode M9 | |||
|---|---|---|---|
| Quadrant | BADHDUFLAG | Total packets | Discarded packets |
| A | 0 | 38 | 0 |
| B | 0 | 38 | 0 |
| C | 0 | 38 | 0 |
| D | 0 | 38 | 0 |
| Mode M0 | |||
|---|---|---|---|
| Quadrant | BADHDUFLAG | Total packets | Discarded packets |
| A | 0 | 20136 | 3 |
| B | 0 | 19948 | 2 |
| C | 0 | 18640 | 4 |
| D | 0 | 41617 | 2 |
| Quadrant | Total seconds | Saturated seconds | Saturation percentage |
|---|---|---|---|
| A | 9033 | 87 | 0.963135% |
| B | 9033 | 99 | 1.095981% |
| C | 9032 | 30 | 0.332152% |
| D | 9033 | 2067 | 22.882763% |
Noise dominated data is calculated using 1-second bins in cleaned event files. If a bin has >2000 counts, and if more than 50% of those come from <1% of pixels, then it is considered to be noise-dominated and hence unusable.
| Quadrant | # 1 sec bins | Bins with >0 counts | Bins with >2000 counts | High rate bins dominated by noise | Noise dominated (total time) | Noise dominated (detector-on time) | Marked lightcurve |
|---|---|---|---|---|---|---|---|
| A | 12828 | 9035 | 57 | 57 | 0.44% | 0.63% | 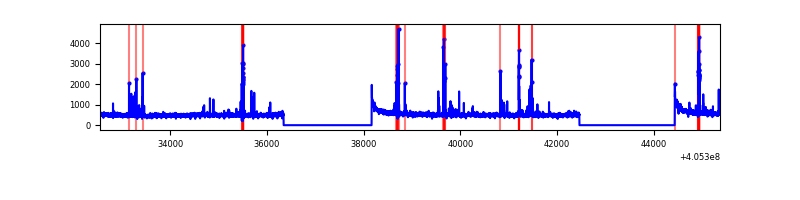 |
| B | 12828 | 9035 | 59 | 59 | 0.46% | 0.65% |  |
| C | 12828 | 9035 | 26 | 26 | 0.20% | 0.29% | 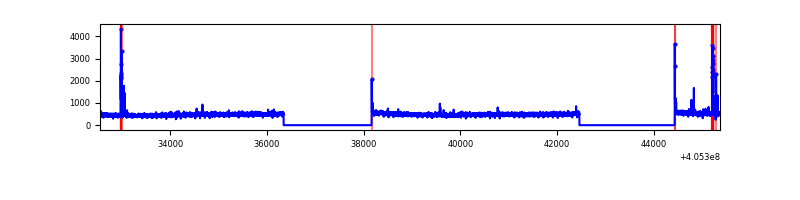 |
| D | 12828 | 9035 | 1940 | 1940 | 15.12% | 21.47% | 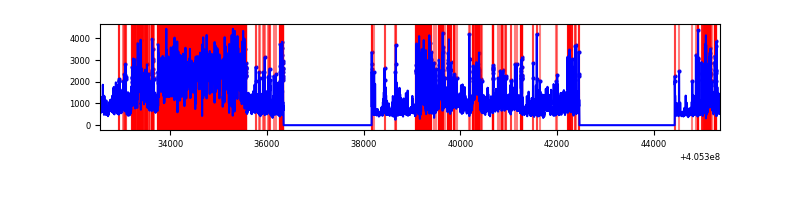 |
Top three noisy pixels from each quadrant. If the there are fewer than three noisy pixels in the level2.evt file, extra rows are filled as -1
| Pixel properties | Quadrant properties | ||||||
|---|---|---|---|---|---|---|---|
| Quadrant | DetID | PixID | Counts | Sigma | Mean | Median | Sigma |
| A | 10 | 83 | 585683 | 2823.36 | 1042 | 1022 | 207.1 |
| A | 13 | 248 | 261666 | 1258.67 | 1042 | 1022 | 207.1 |
| A | 9 | 143 | 51350 | 243.04 | 1042 | 1022 | 207.1 |
| B | 4 | 232 | 377290 | 1957.77 | 1028 | 1002 | 192.2 |
| B | 0 | 183 | 143979 | 743.89 | 1028 | 1002 | 192.2 |
| B | 4 | 171 | 83527 | 429.37 | 1028 | 1002 | 192.2 |
| C | 15 | 214 | 378172 | 1638.37 | 1007 | 1012 | 230.2 |
| C | 14 | 254 | 121050 | 521.44 | 1007 | 1012 | 230.2 |
| C | 0 | 10 | 19101 | 78.58 | 1007 | 1012 | 230.2 |
| D | 12 | 235 | 5481839 | 24475.95 | 930 | 902 | 223.9 |
| D | 12 | 2 | 864934 | 3858.47 | 930 | 902 | 223.9 |
| D | 2 | 250 | 526968 | 2349.23 | 930 | 902 | 223.9 |
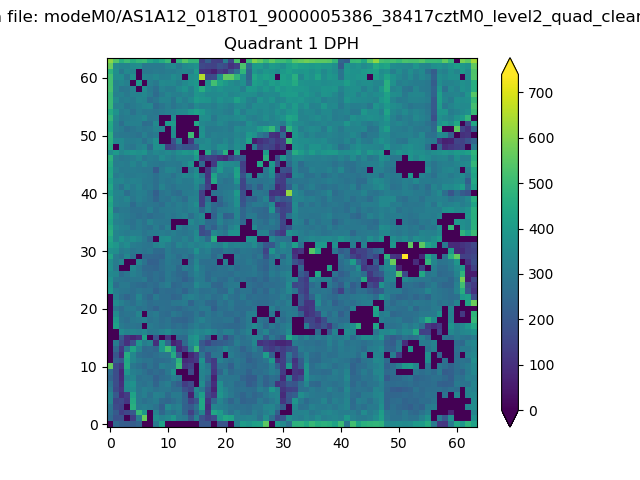
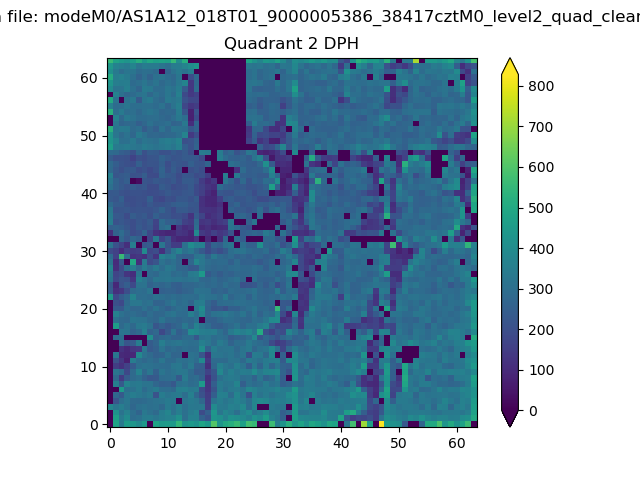
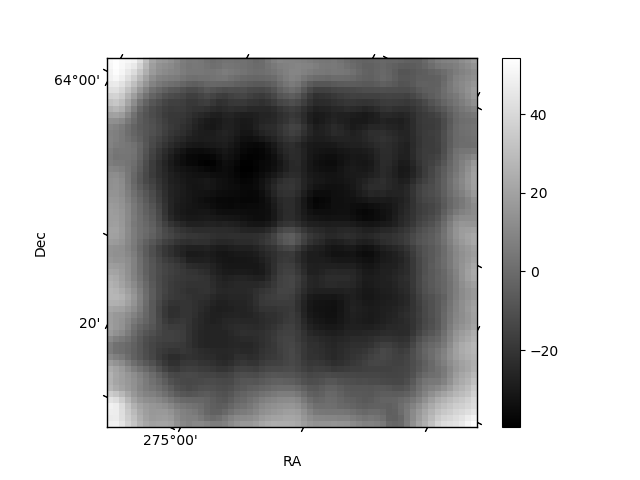
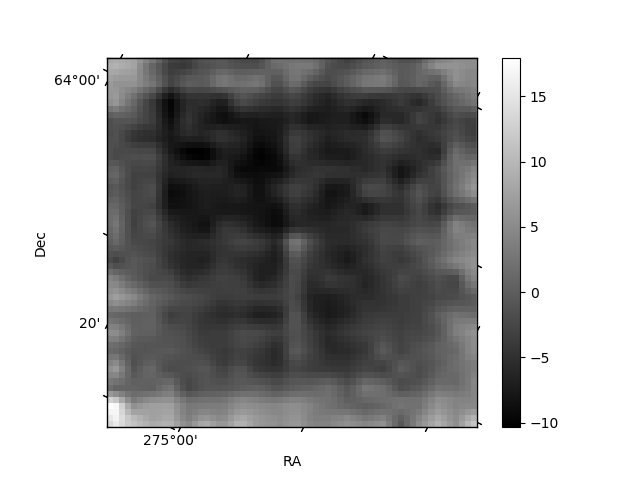
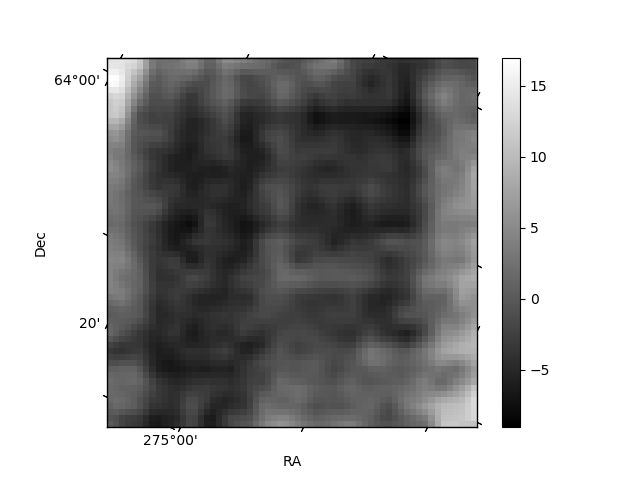
Histogram calculated using DETX and DETY for each event in the final _common_clean file
| Quadrant A | 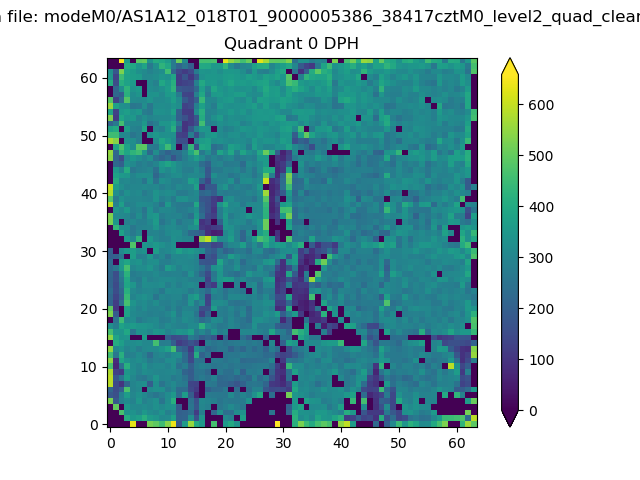 |
 |
Quadrant B |
|---|---|---|---|
| Quadrant D | 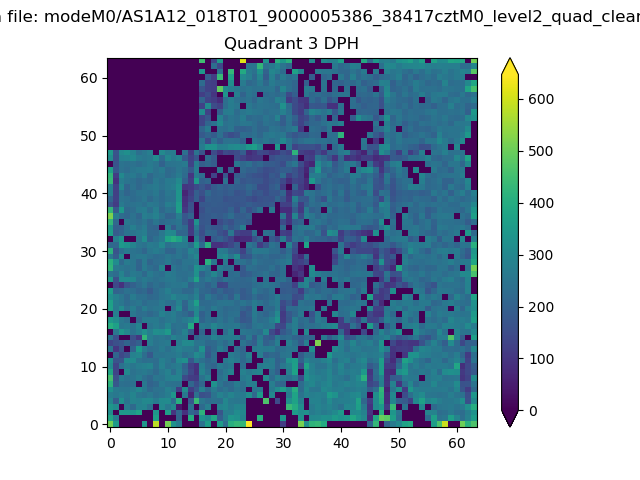 |
 |
Quadrant C |
| Plot type | Count rate plots | Images |
|---|---|---|
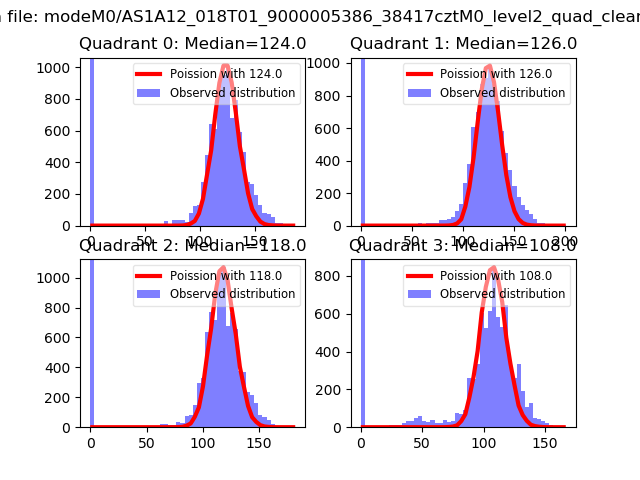
| Comparison with Poisson distribution Blue bars denote a histogram of data divided into 1 sec bins. Red curve is a Poisson curve with rate = median count rate of data. |
 |
 |
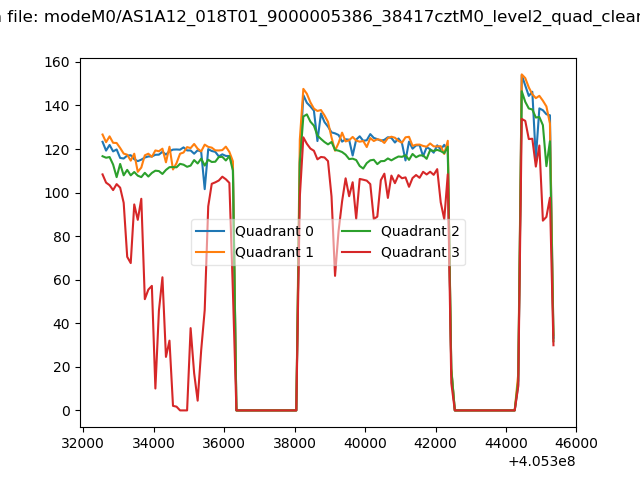
| Quadrant-wise count rates Data is divided into 100 sec bins |
 |
|
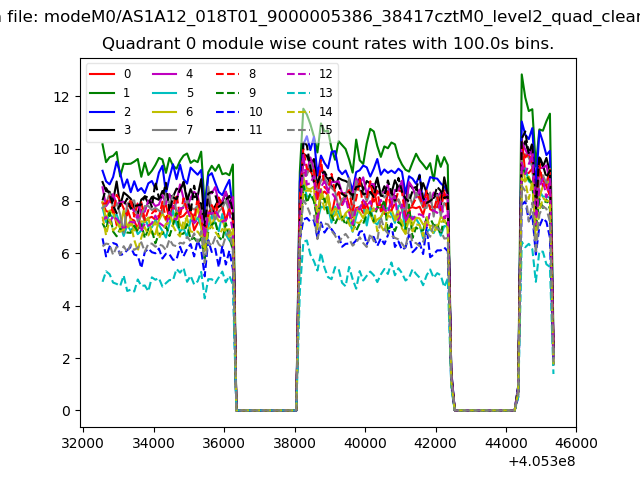
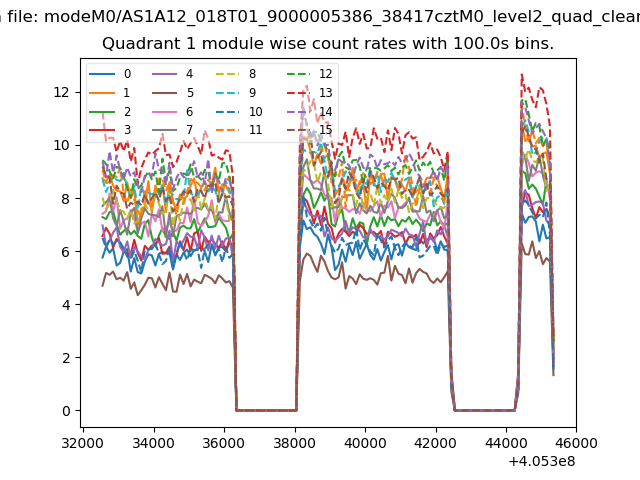
| Module-wise count rates for Quadrant A Data is divided into 100 sec bins |
 |
 |
| Module-wise count rates for Quadrant B Data is divided into 100 sec bins |
 |
 |
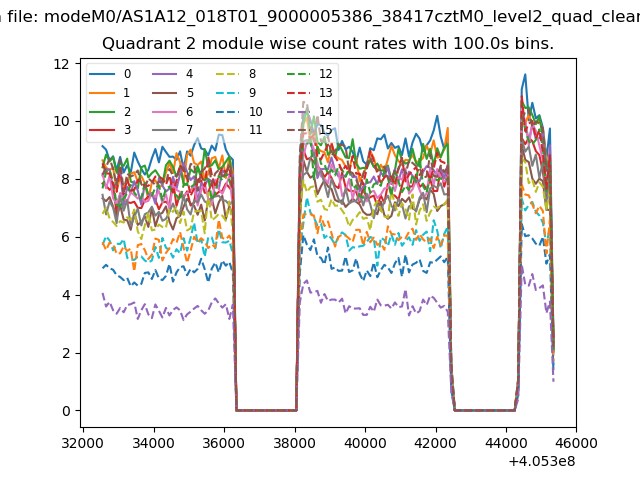
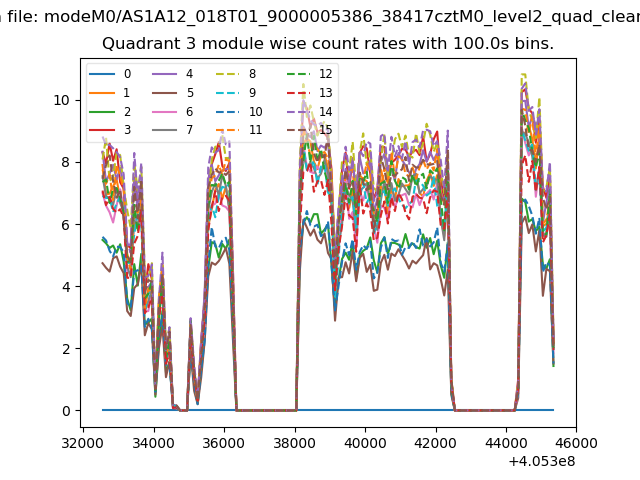
| Module-wise count rates for Quadrant C Data is divided into 100 sec bins |
 |
 |
| Module-wise count rates for Quadrant D Data is divided into 100 sec bins |
 |
 |
| Parameter | Plot |
|---|---|
| CZT HV Monitor | 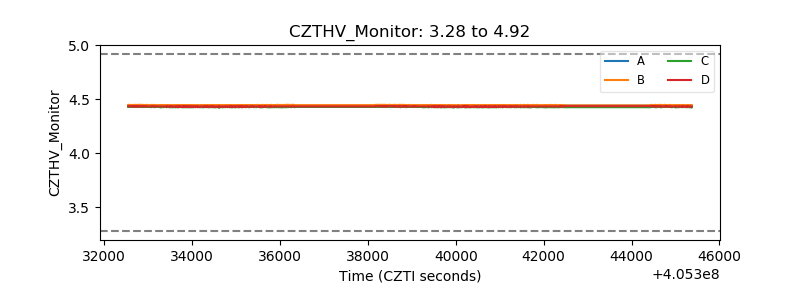 |
| D_VDD | 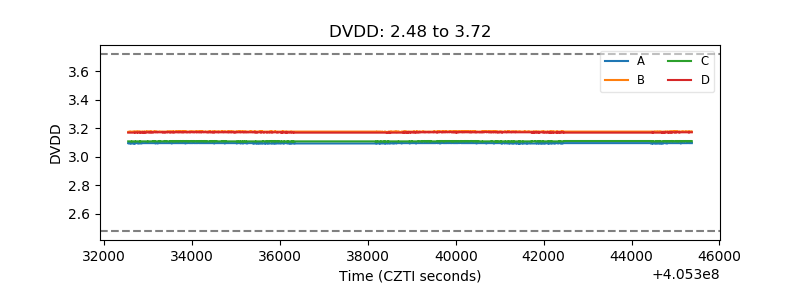 |
| Temperature 1 | 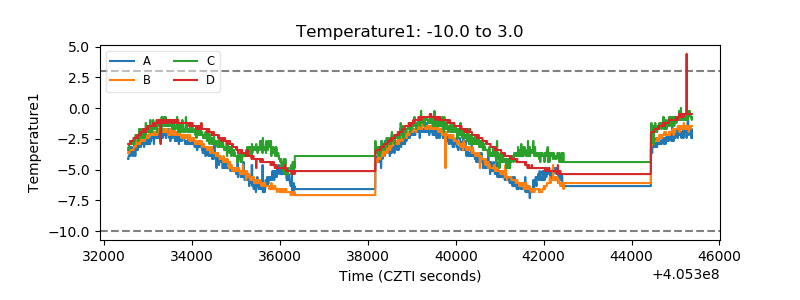 |
| Veto HV Monitor | 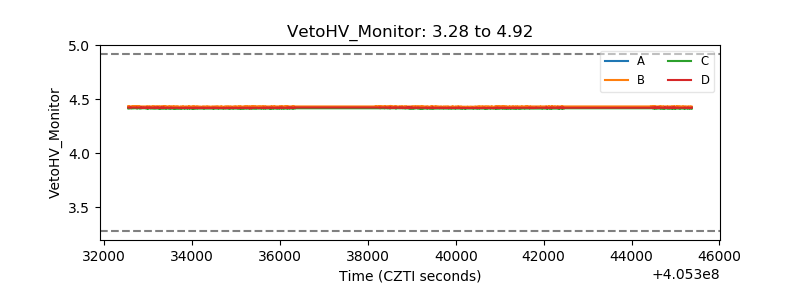 |
| Veto LLD | 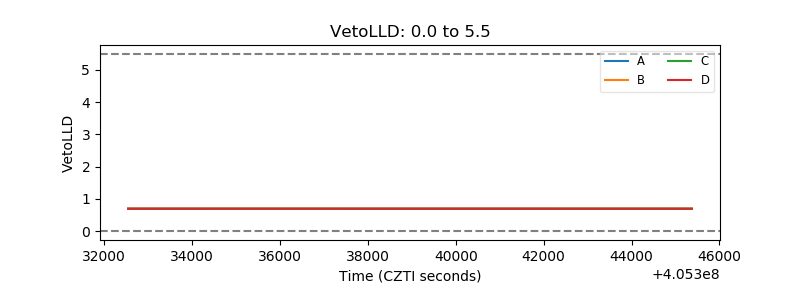 |
| Alpha Counter | 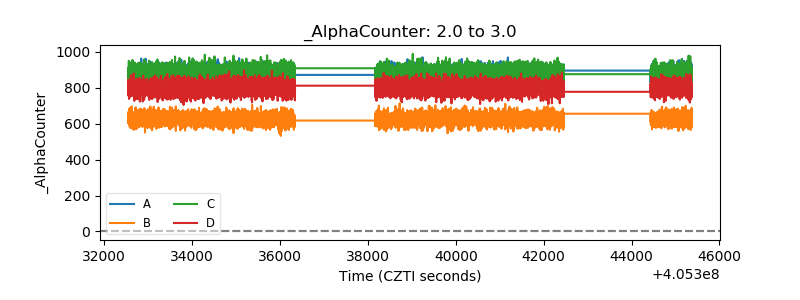 |
| _CPM_Rate | 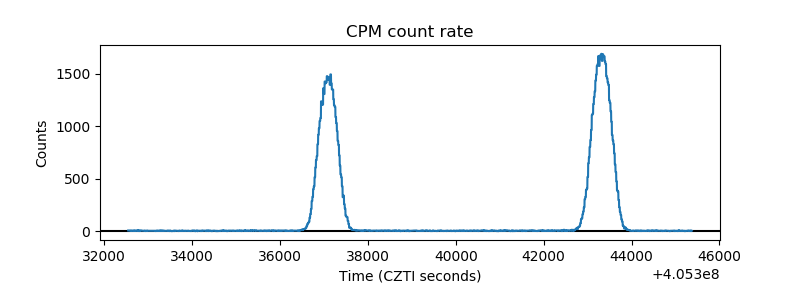 |
| CZT Counter | 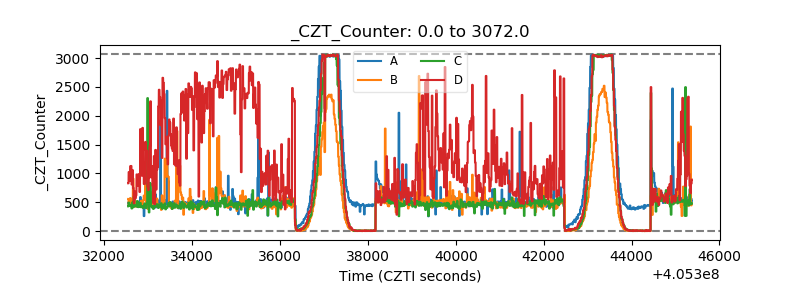 |
| +2.5 Volts monitor | 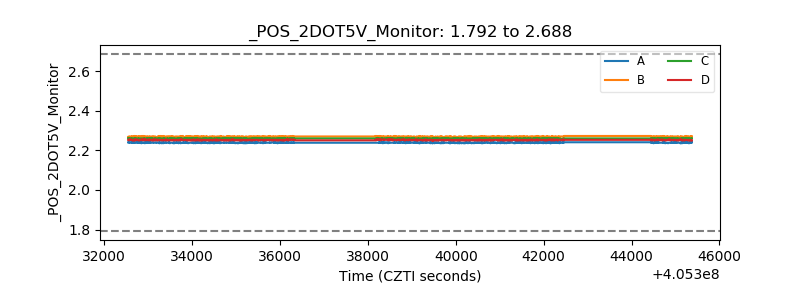 |
| +5 Volts monitor | 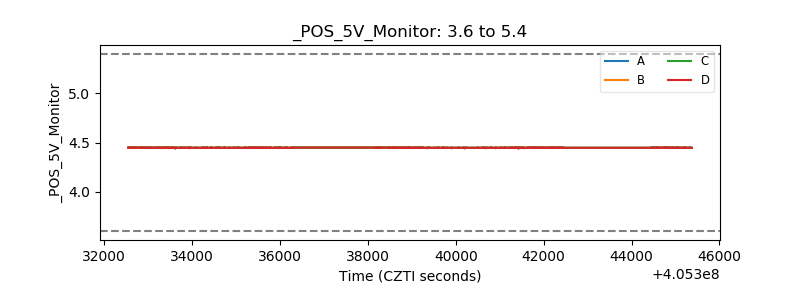 |
| _ROLL_ROT | 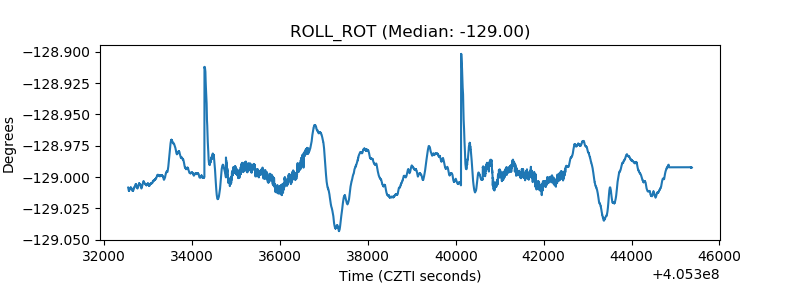 |
| _Roll_DEC | 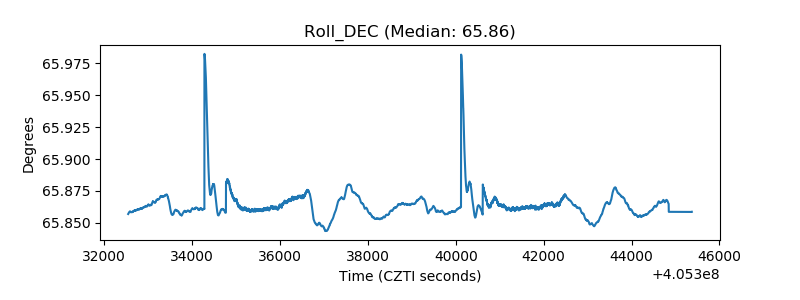 |
| _Roll_RA | 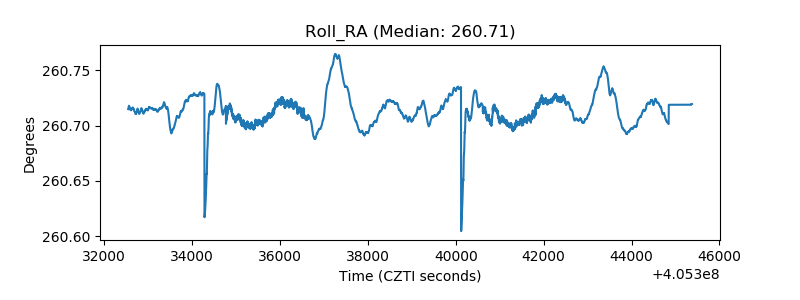 |
| Veto Counter | 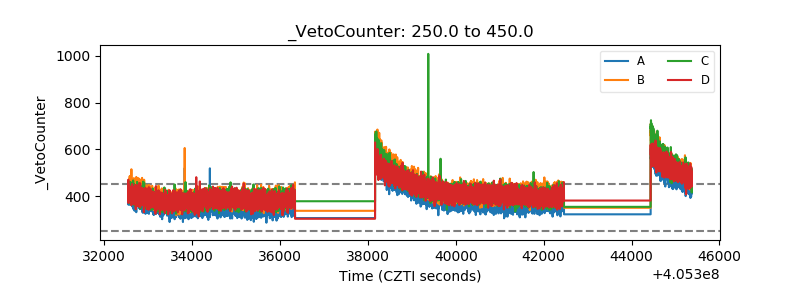 |