| Param | Original file | Final file |
|---|---|---|
| Filename | modeM0/AS1A12_018T01_9000005386_38418cztM0_level2.fits | modeM0/AS1A12_018T01_9000005386_38418cztM0_level2_quad_clean.evt |
| Size (bytes) | 451,082,880 | 97,145,280 |
| Size | 430.2 MB | 92.6 MB |
| Events in quadrant A | 3,255,412 | 685,475 |
| Events in quadrant B | 2,839,364 | 705,282 |
| Events in quadrant C | 2,773,224 | 663,141 |
| Events in quadrant D | 7,417,330 | 516,034 |
| Mode SS | |||
|---|---|---|---|
| Quadrant | BADHDUFLAG | Total packets | Discarded packets |
| A | 0 | 108 | 0 |
| B | 0 | 108 | 0 |
| C | 0 | 108 | 0 |
| D | 0 | 108 | 0 |
| Mode M9 | |||
|---|---|---|---|
| Quadrant | BADHDUFLAG | Total packets | Discarded packets |
| A | 0 | 21 | 0 |
| B | 0 | 21 | 0 |
| C | 0 | 21 | 0 |
| D | 0 | 22 | 0 |
| Mode M0 | |||
|---|---|---|---|
| Quadrant | BADHDUFLAG | Total packets | Discarded packets |
| A | 0 | 12885 | 3 |
| B | 0 | 11710 | 2 |
| C | 0 | 11205 | 2 |
| D | 0 | 25708 | 2 |
| Quadrant | Total seconds | Saturated seconds | Saturation percentage |
|---|---|---|---|
| A | 5309 | 99 | 1.864758% |
| B | 5309 | 15 | 0.282539% |
| C | 5309 | 32 | 0.602750% |
| D | 5309 | 1207 | 22.734978% |
Noise dominated data is calculated using 1-second bins in cleaned event files. If a bin has >2000 counts, and if more than 50% of those come from <1% of pixels, then it is considered to be noise-dominated and hence unusable.
| Quadrant | # 1 sec bins | Bins with >0 counts | Bins with >2000 counts | High rate bins dominated by noise | Noise dominated (total time) | Noise dominated (detector-on time) | Marked lightcurve |
|---|---|---|---|---|---|---|---|
| A | 7371 | 5310 | 71 | 71 | 0.96% | 1.34% | 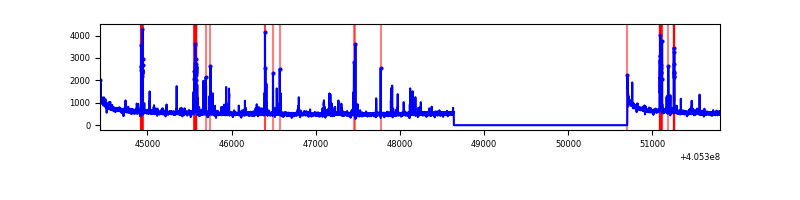 |
| B | 7371 | 5310 | 7 | 7 | 0.09% | 0.13% | 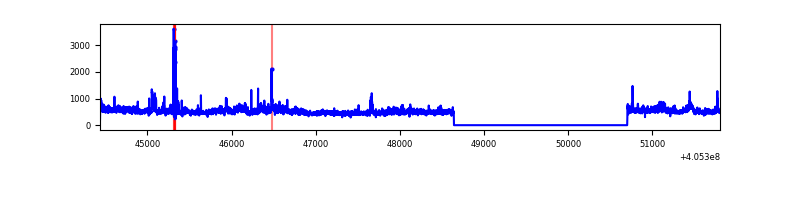 |
| C | 7371 | 5310 | 24 | 24 | 0.33% | 0.45% | 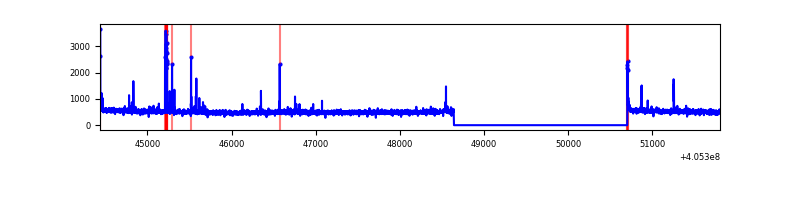 |
| D | 7371 | 5310 | 1172 | 1172 | 15.90% | 22.07% | 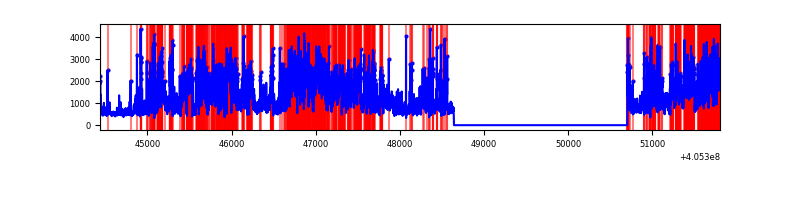 |
Top three noisy pixels from each quadrant. If the there are fewer than three noisy pixels in the level2.evt file, extra rows are filled as -1
| Pixel properties | Quadrant properties | ||||||
|---|---|---|---|---|---|---|---|
| Quadrant | DetID | PixID | Counts | Sigma | Mean | Median | Sigma |
| A | 10 | 83 | 416224 | 3305.59 | 631 | 619 | 125.7 |
| A | 13 | 248 | 289196 | 2295.25 | 631 | 619 | 125.7 |
| A | 9 | 143 | 41496 | 325.12 | 631 | 619 | 125.7 |
| B | 0 | 183 | 179352 | 1528.85 | 626 | 610 | 116.9 |
| B | 0 | 155 | 64762 | 548.71 | 626 | 610 | 116.9 |
| B | 4 | 232 | 56820 | 480.78 | 626 | 610 | 116.9 |
| C | 15 | 214 | 229038 | 1610.81 | 616 | 620 | 141.8 |
| C | 14 | 254 | 107629 | 754.63 | 616 | 620 | 141.8 |
| C | 0 | 10 | 26485 | 182.4 | 616 | 620 | 141.8 |
| D | 12 | 235 | 3968375 | 27968.02 | 585 | 569 | 141.9 |
| D | 2 | 250 | 457661 | 3221.92 | 585 | 569 | 141.9 |
| D | 12 | 233 | 260891 | 1834.94 | 585 | 569 | 141.9 |
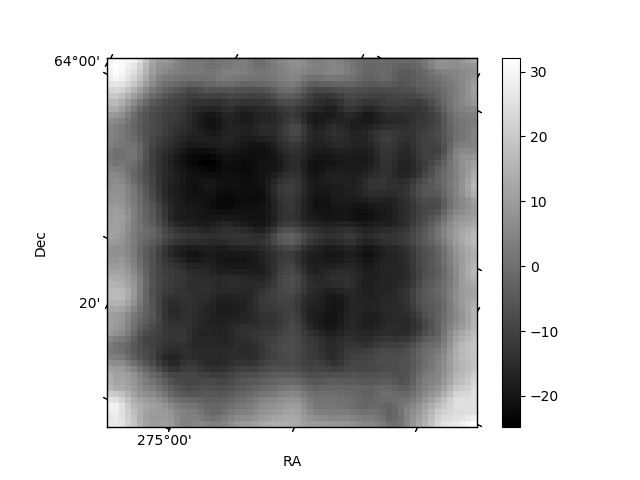
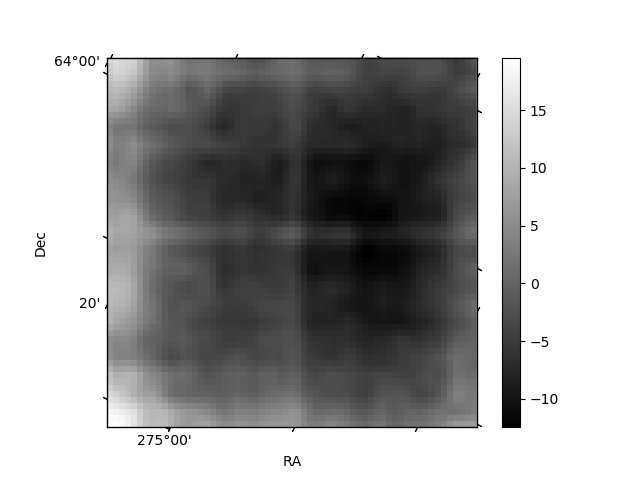
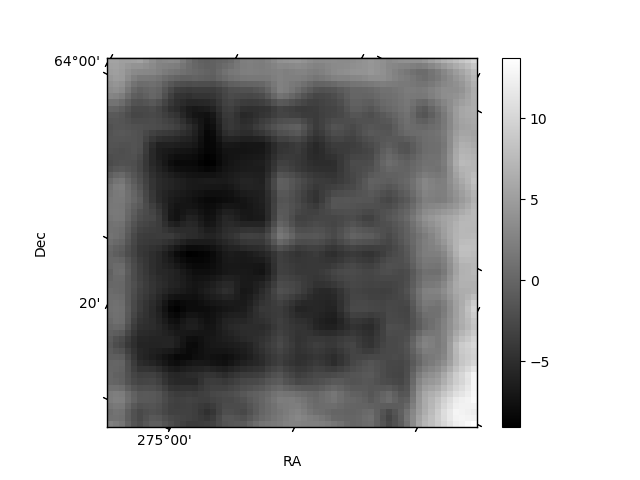
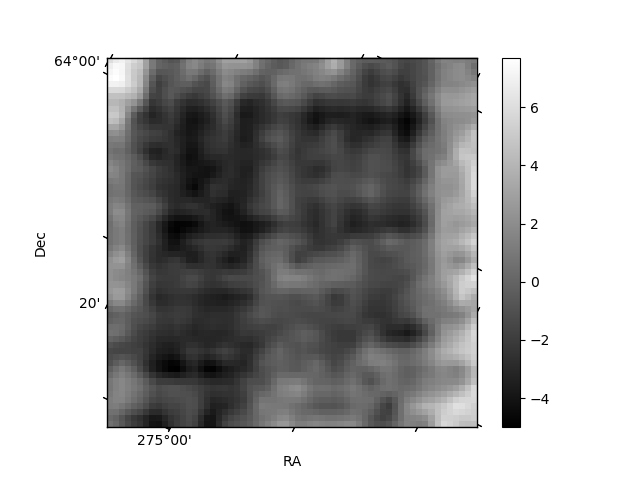
Histogram calculated using DETX and DETY for each event in the final _common_clean file
| Quadrant A | 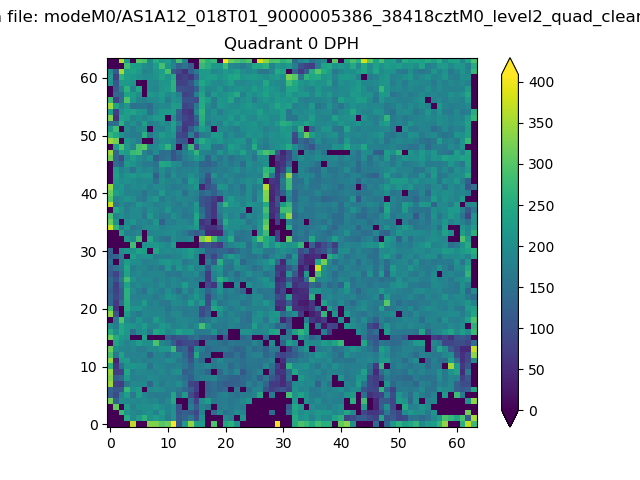 |
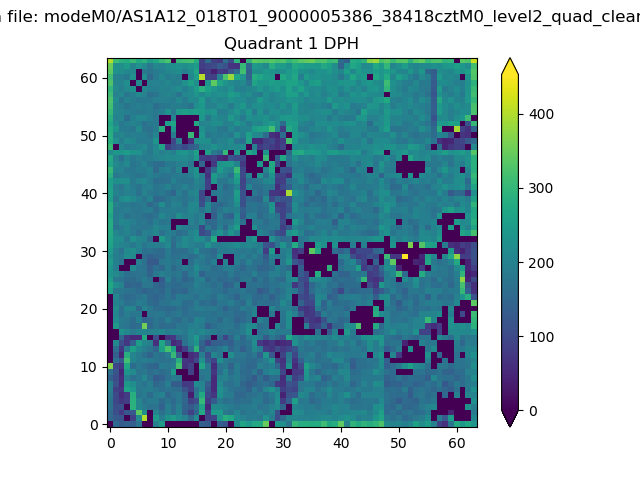 |
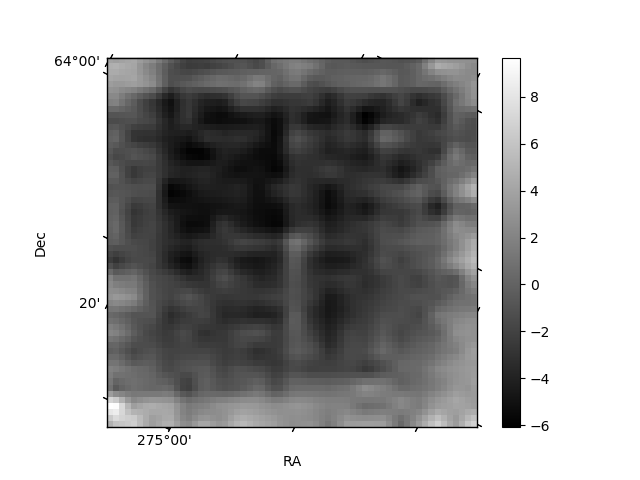
Quadrant B |
|---|---|---|---|
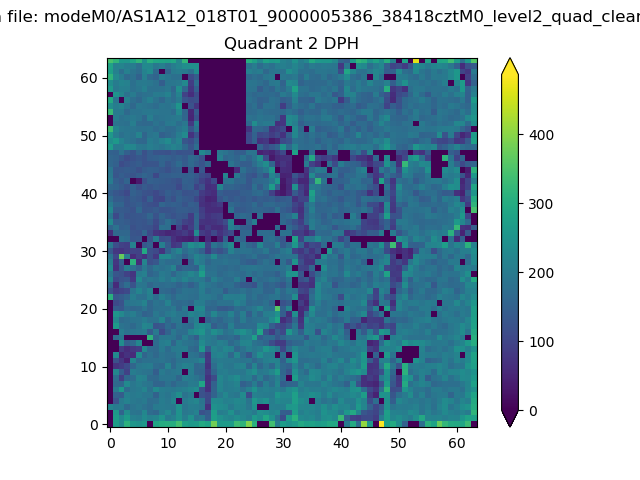
| Quadrant D | 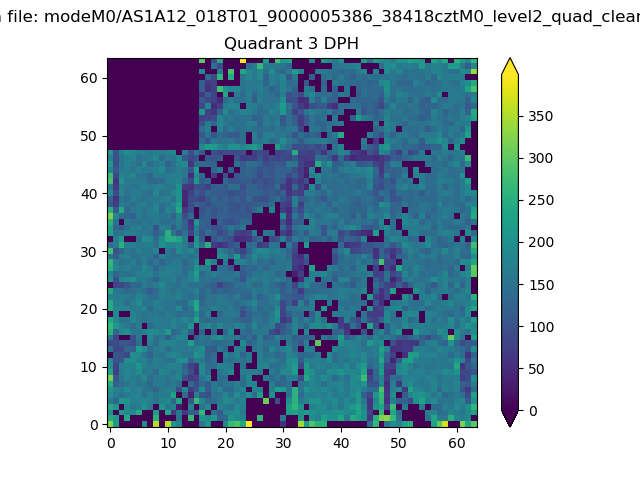 |
 |
Quadrant C |
| Plot type | Count rate plots | Images |
|---|---|---|
| Comparison with Poisson distribution Blue bars denote a histogram of data divided into 1 sec bins. Red curve is a Poisson curve with rate = median count rate of data. |
 |
 |
| Quadrant-wise count rates Data is divided into 100 sec bins |
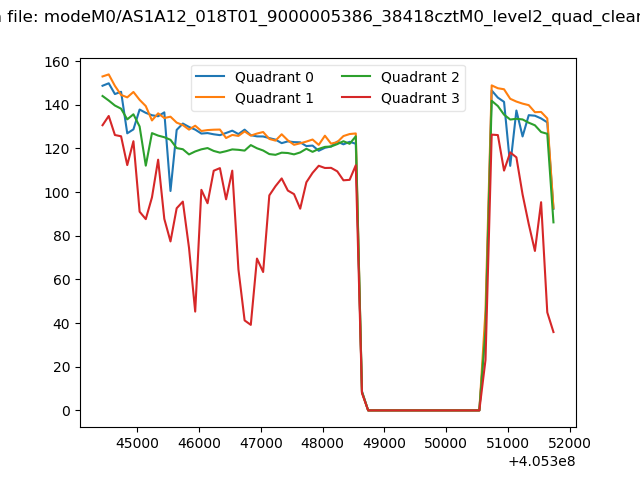 |
|
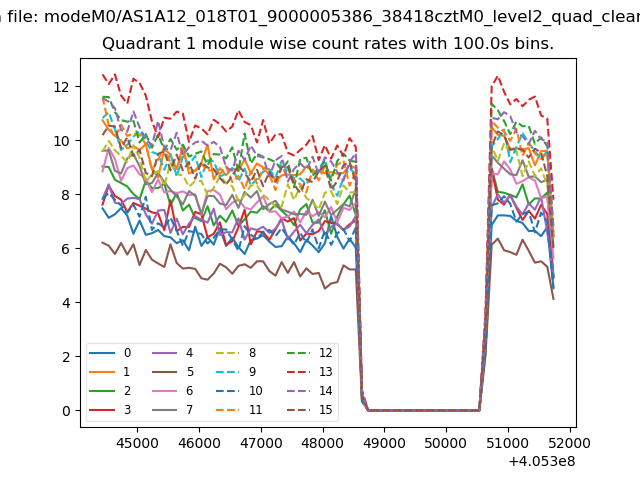
| Module-wise count rates for Quadrant A Data is divided into 100 sec bins |
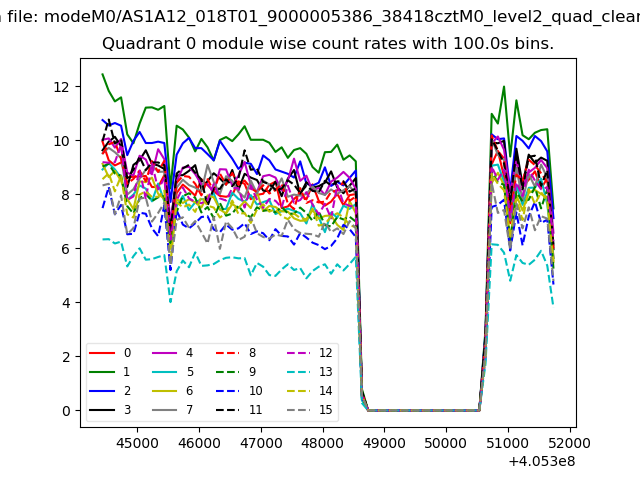 |
 |
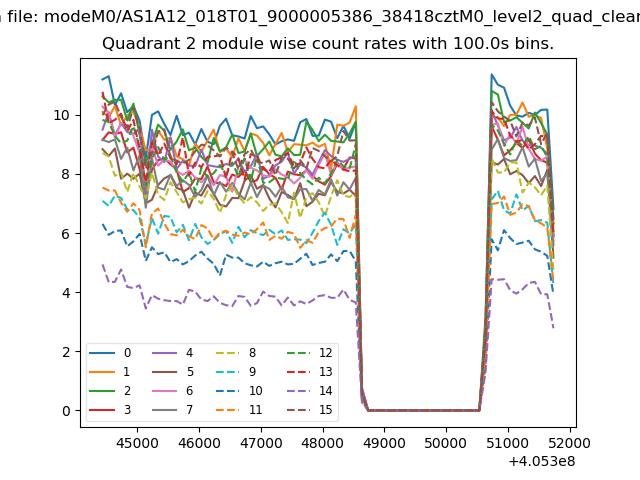
| Module-wise count rates for Quadrant B Data is divided into 100 sec bins |
 |
 |
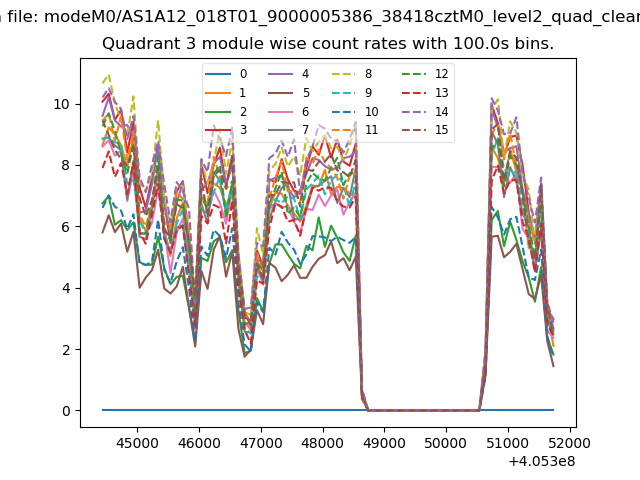
| Module-wise count rates for Quadrant C Data is divided into 100 sec bins |
 |
 |
| Module-wise count rates for Quadrant D Data is divided into 100 sec bins |
 |
 |
| Parameter | Plot |
|---|---|
| CZT HV Monitor | 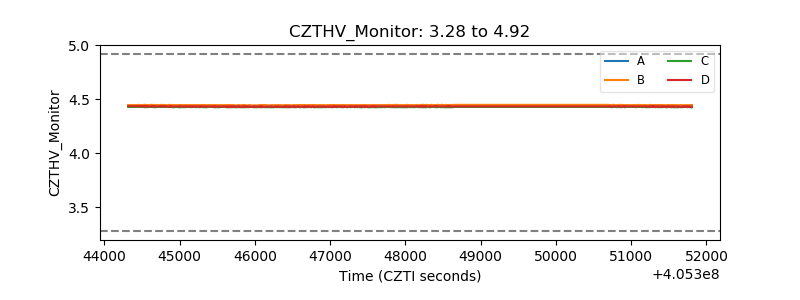 |
| D_VDD | 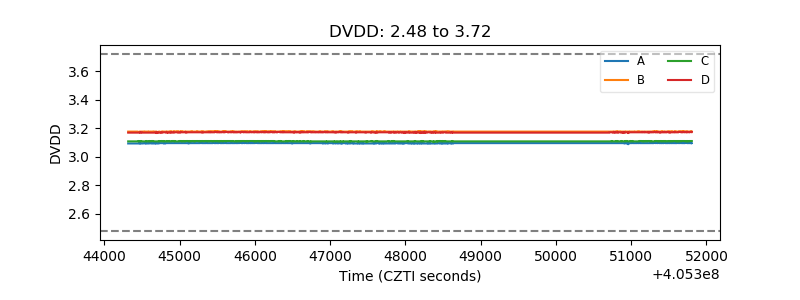 |
| Temperature 1 | 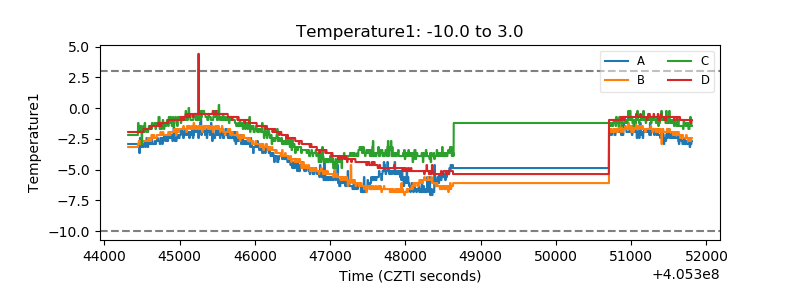 |
| Veto HV Monitor | 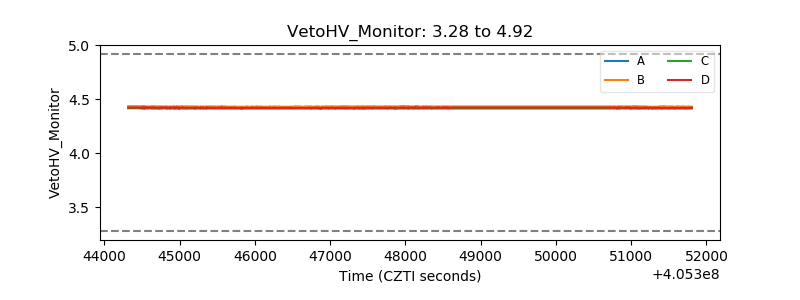 |
| Veto LLD | 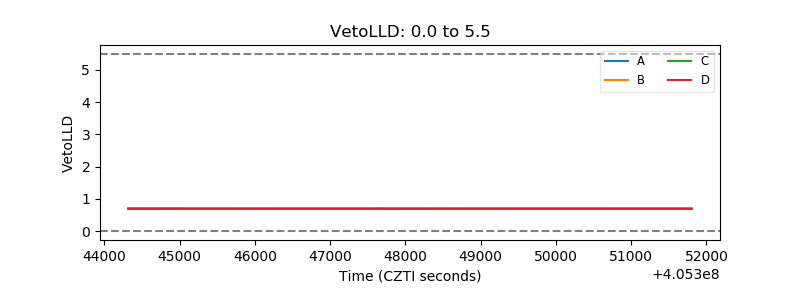 |
| Alpha Counter | 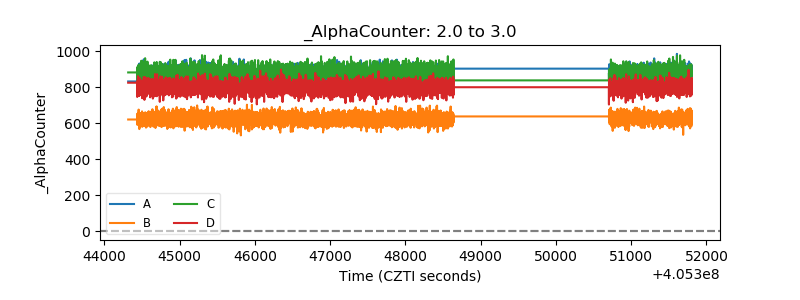 |
| _CPM_Rate | 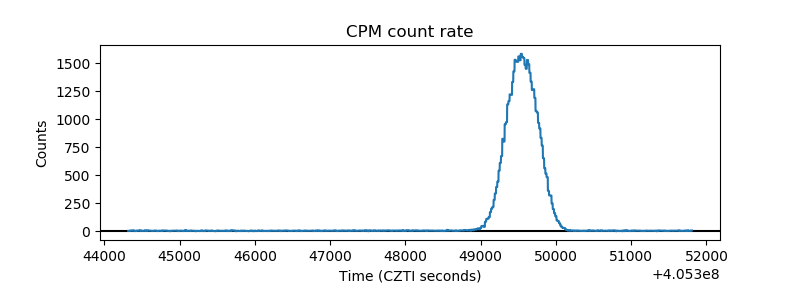 |
| CZT Counter | 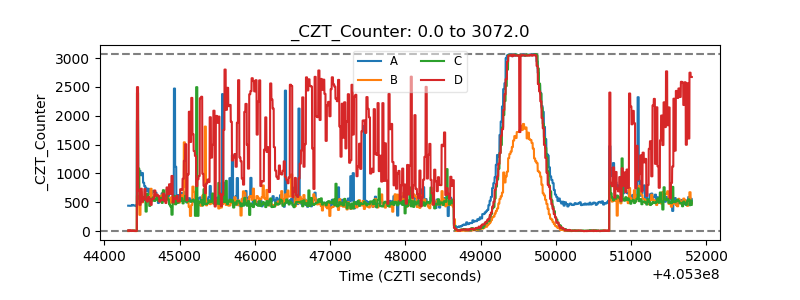 |
| +2.5 Volts monitor | 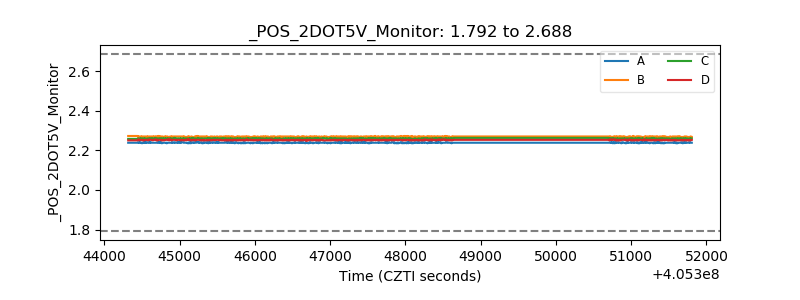 |
| +5 Volts monitor | 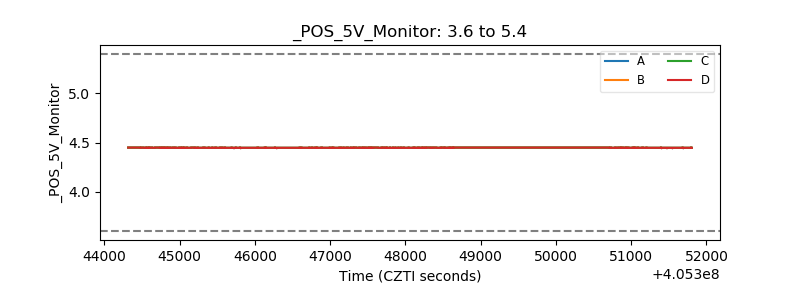 |
| _ROLL_ROT | 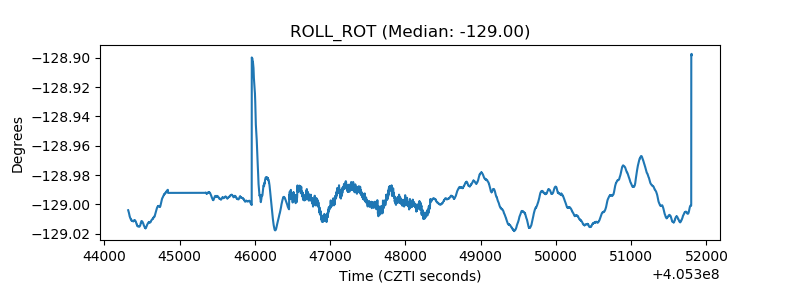 |
| _Roll_DEC | 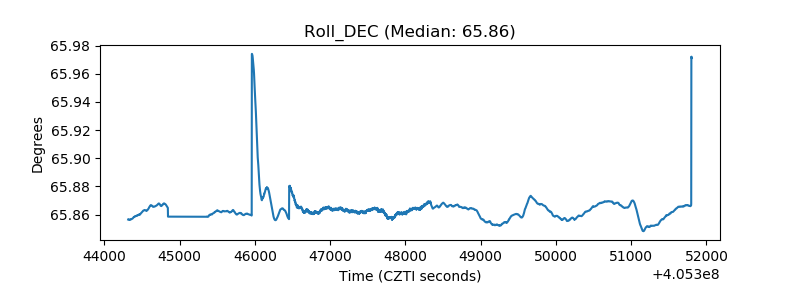 |
| _Roll_RA | 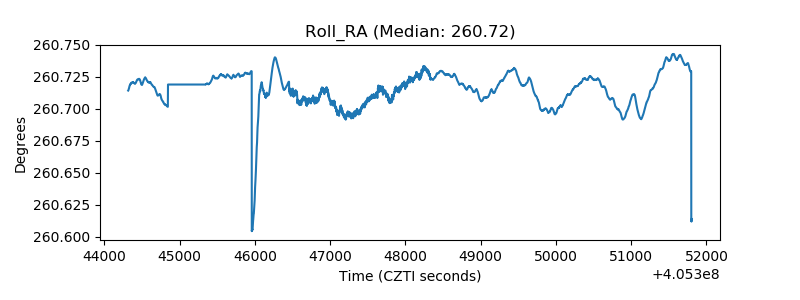 |
| Veto Counter | 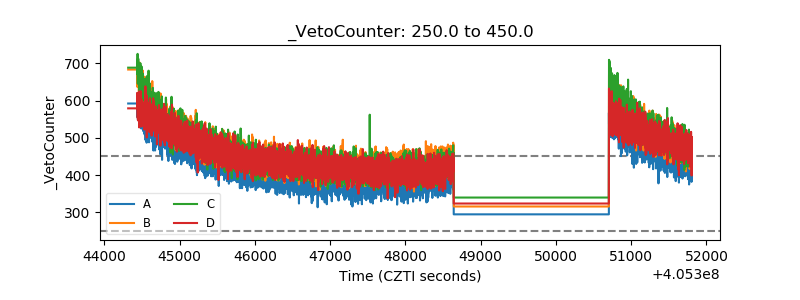 |