| Param | Original file | Final file |
|---|---|---|
| Filename | modeM0/AS1A12_018T01_9000005386_38419cztM0_level2.fits | modeM0/AS1A12_018T01_9000005386_38419cztM0_level2_quad_clean.evt |
| Size (bytes) | 1,408,504,320 | 306,480,960 |
| Size | 1.3 GB | 292.3 MB |
| Events in quadrant A | 10,017,488 | 2,176,567 |
| Events in quadrant B | 9,295,634 | 2,218,992 |
| Events in quadrant C | 8,710,949 | 2,097,955 |
| Events in quadrant D | 22,759,622 | 1,577,848 |
| Mode SS | |||
|---|---|---|---|
| Quadrant | BADHDUFLAG | Total packets | Discarded packets |
| A | 0 | 360 | 0 |
| B | 0 | 360 | 0 |
| C | 0 | 360 | 0 |
| D | 0 | 360 | 0 |
| Mode M9 | |||
|---|---|---|---|
| Quadrant | BADHDUFLAG | Total packets | Discarded packets |
| A | 0 | 79 | 0 |
| B | 0 | 79 | 0 |
| C | 0 | 79 | 0 |
| D | 0 | 79 | 0 |
| Mode M0 | |||
|---|---|---|---|
| Quadrant | BADHDUFLAG | Total packets | Discarded packets |
| A | 0 | 40182 | 5 |
| B | 0 | 38637 | 4 |
| C | 0 | 36090 | 4 |
| D | 0 | 79818 | 4 |
| Quadrant | Total seconds | Saturated seconds | Saturation percentage |
|---|---|---|---|
| A | 17533 | 236 | 1.346033% |
| B | 17533 | 130 | 0.741459% |
| C | 17533 | 47 | 0.268066% |
| D | 17533 | 3745 | 21.359722% |
Noise dominated data is calculated using 1-second bins in cleaned event files. If a bin has >2000 counts, and if more than 50% of those come from <1% of pixels, then it is considered to be noise-dominated and hence unusable.
| Quadrant | # 1 sec bins | Bins with >0 counts | Bins with >2000 counts | High rate bins dominated by noise | Noise dominated (total time) | Noise dominated (detector-on time) | Marked lightcurve |
|---|---|---|---|---|---|---|---|
| A | 25513 | 17537 | 166 | 166 | 0.65% | 0.95% | 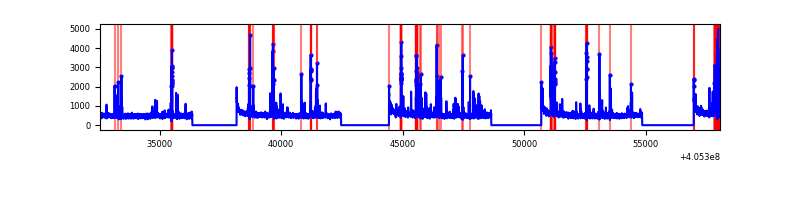 |
| B | 25513 | 17537 | 73 | 73 | 0.29% | 0.42% | 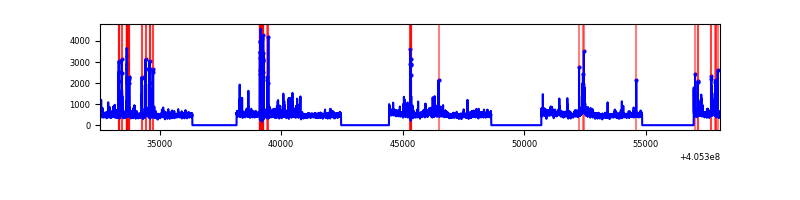 |
| C | 25513 | 17537 | 33 | 33 | 0.13% | 0.19% | 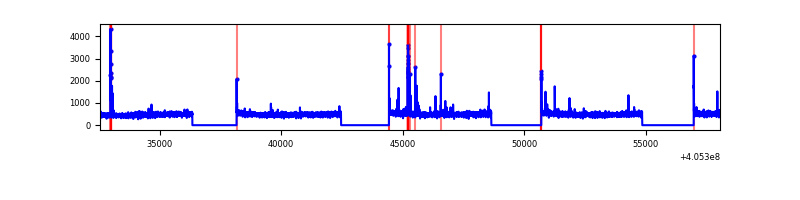 |
| D | 25513 | 17537 | 3562 | 3562 | 13.96% | 20.31% | 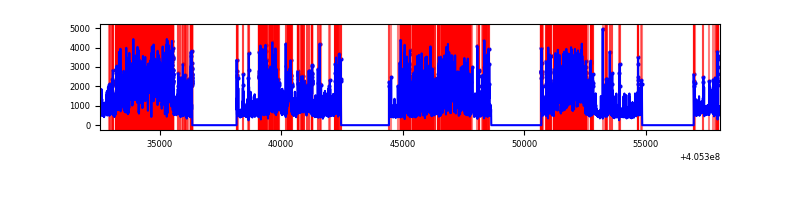 |
Top three noisy pixels from each quadrant. If the there are fewer than three noisy pixels in the level2.evt file, extra rows are filled as -1
| Pixel properties | Quadrant properties | ||||||
|---|---|---|---|---|---|---|---|
| Quadrant | DetID | PixID | Counts | Sigma | Mean | Median | Sigma |
| A | 10 | 83 | 1160252 | 2896.77 | 2025 | 1985 | 399.8 |
| A | 13 | 248 | 551030 | 1373.13 | 2025 | 1985 | 399.8 |
| A | 15 | 223 | 208999 | 517.73 | 2025 | 1985 | 399.8 |
| B | 0 | 183 | 491056 | 1313.96 | 2010 | 1957 | 372.2 |
| B | 4 | 232 | 447884 | 1197.98 | 2010 | 1957 | 372.2 |
| B | 4 | 171 | 118254 | 312.43 | 2010 | 1957 | 372.2 |
| C | 15 | 214 | 734863 | 1624.2 | 1982 | 1998 | 451.2 |
| C | 14 | 254 | 176841 | 387.49 | 1982 | 1998 | 451.2 |
| C | 0 | 10 | 49396 | 105.05 | 1982 | 1998 | 451.2 |
| D | 12 | 235 | 11293748 | 25023.41 | 1854 | 1799 | 451.3 |
| D | 2 | 250 | 1284543 | 2842.61 | 1854 | 1799 | 451.3 |
| D | 12 | 2 | 872218 | 1928.88 | 1854 | 1799 | 451.3 |
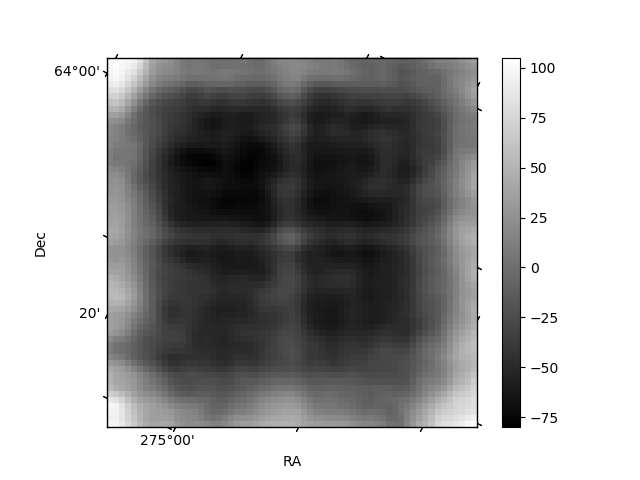
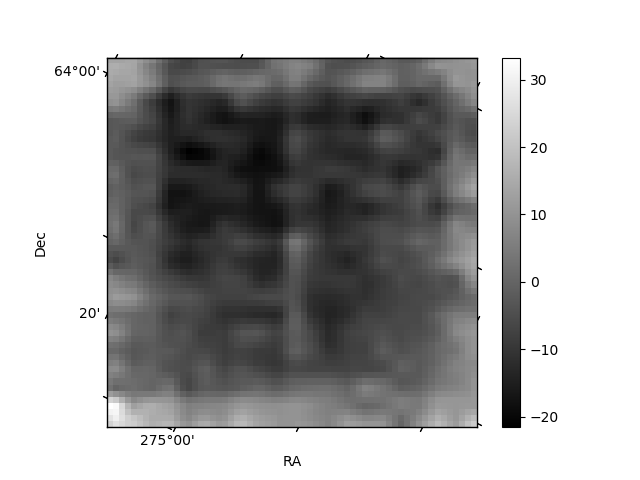
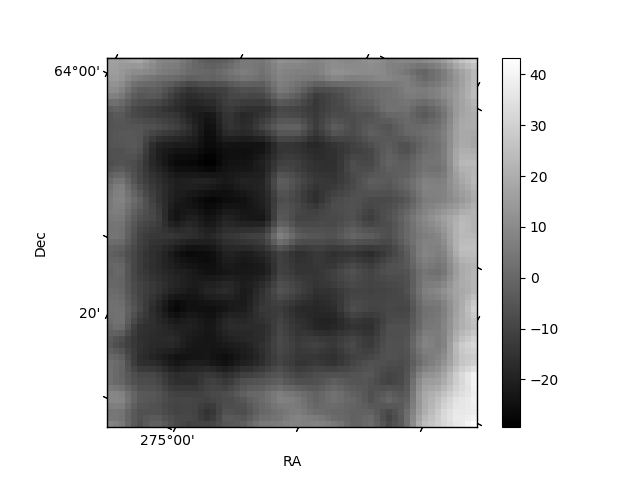
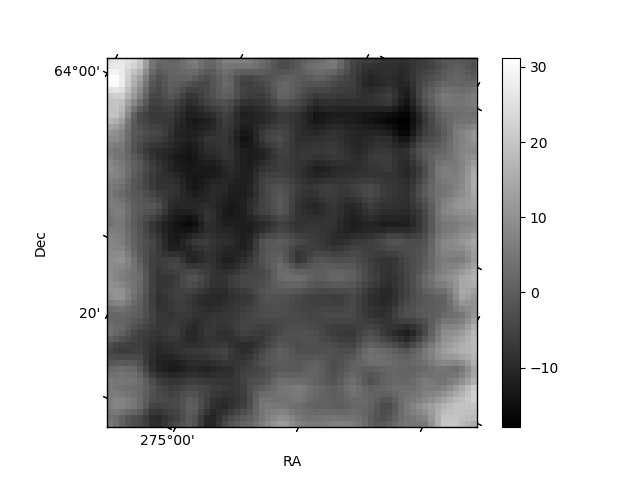
Histogram calculated using DETX and DETY for each event in the final _common_clean file
| Quadrant A | 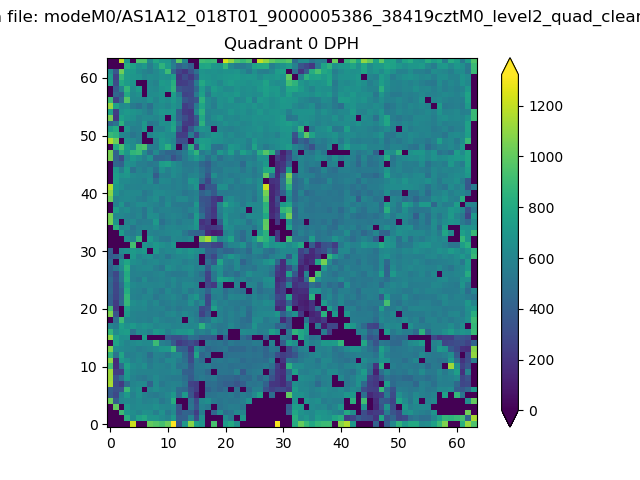 |
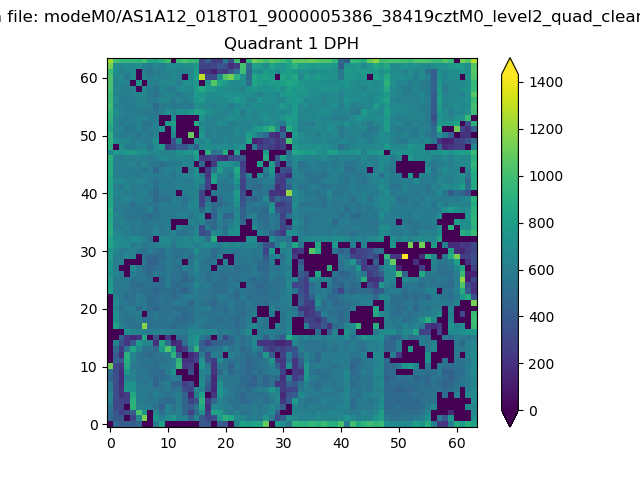 |
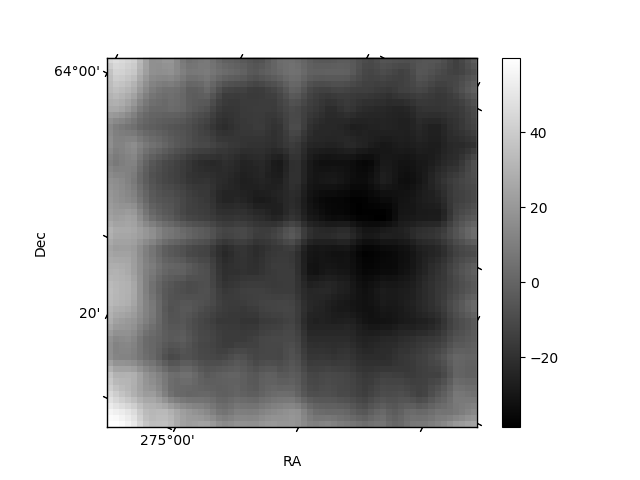
Quadrant B |
|---|---|---|---|
| Quadrant D | 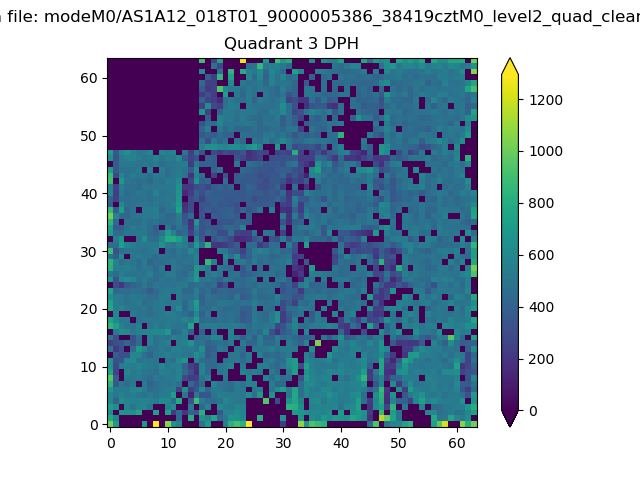 |
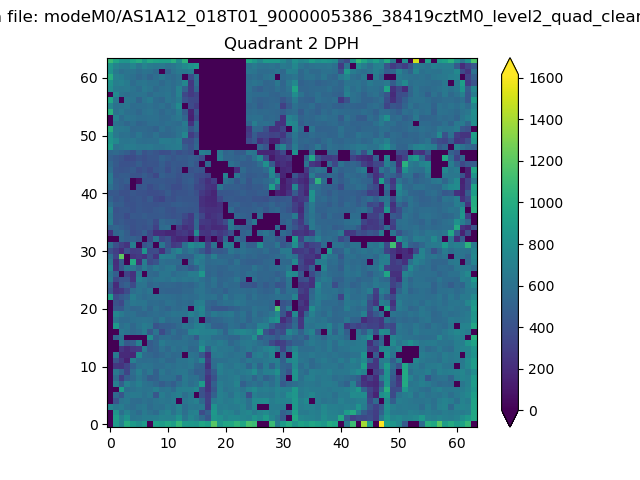 |
Quadrant C |
| Plot type | Count rate plots | Images |
|---|---|---|
| Comparison with Poisson distribution Blue bars denote a histogram of data divided into 1 sec bins. Red curve is a Poisson curve with rate = median count rate of data. |
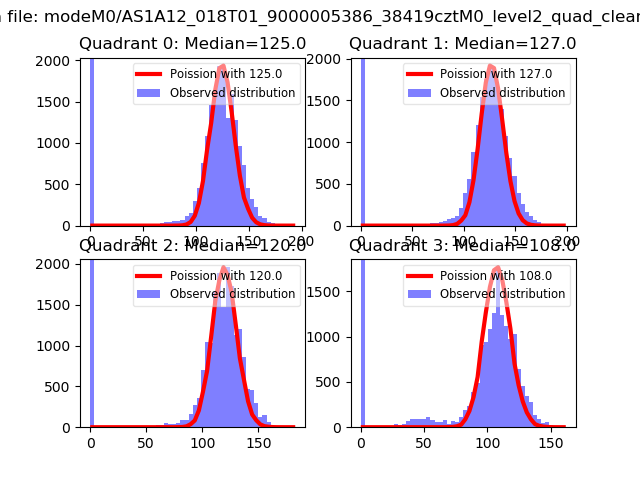 |
 |
| Quadrant-wise count rates Data is divided into 100 sec bins |
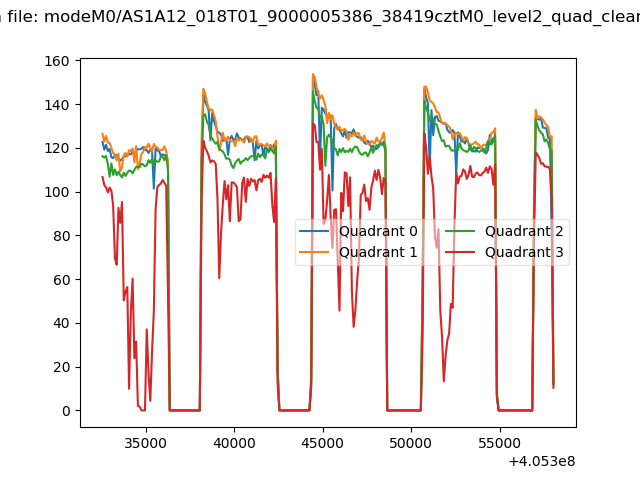 |
|
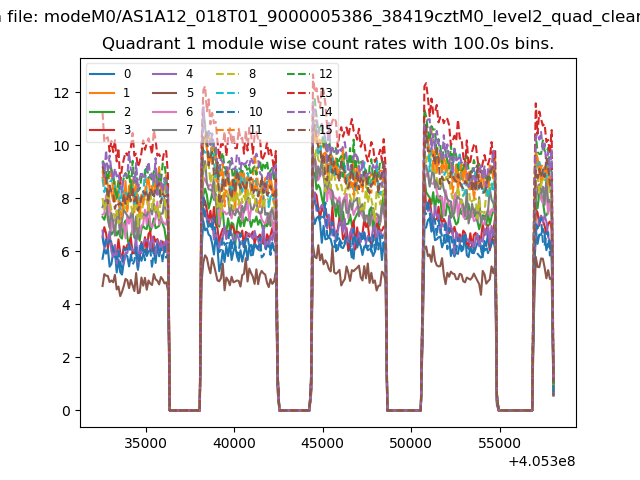
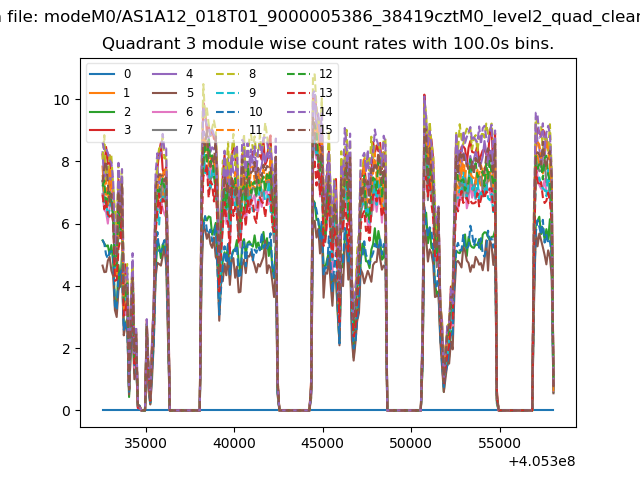
| Module-wise count rates for Quadrant A Data is divided into 100 sec bins |
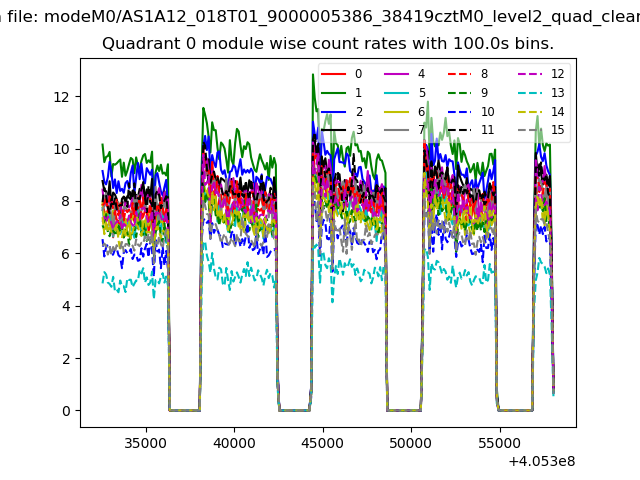 |
 |
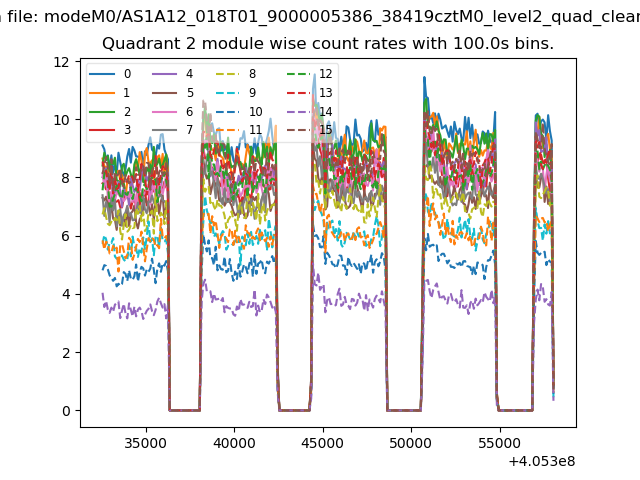
| Module-wise count rates for Quadrant B Data is divided into 100 sec bins |
 |
 |
| Module-wise count rates for Quadrant C Data is divided into 100 sec bins |
 |
 |
| Module-wise count rates for Quadrant D Data is divided into 100 sec bins |
 |
 |
| Parameter | Plot |
|---|---|
| CZT HV Monitor | 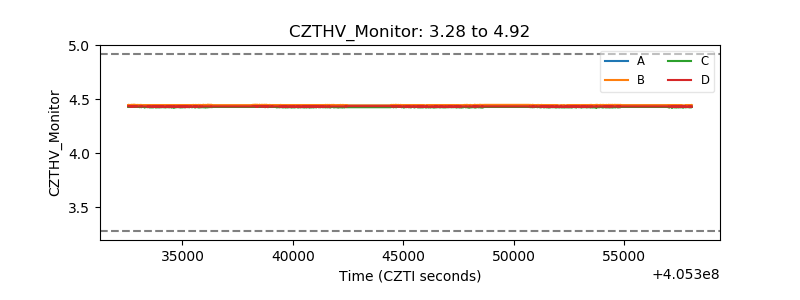 |
| D_VDD | 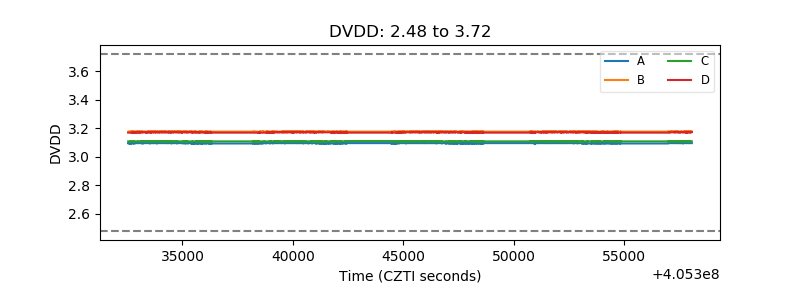 |
| Temperature 1 | 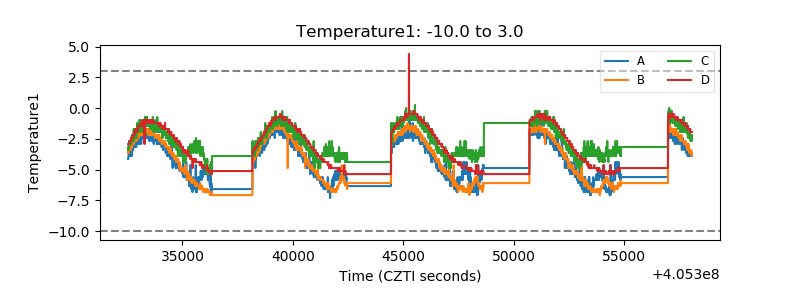 |
| Veto HV Monitor | 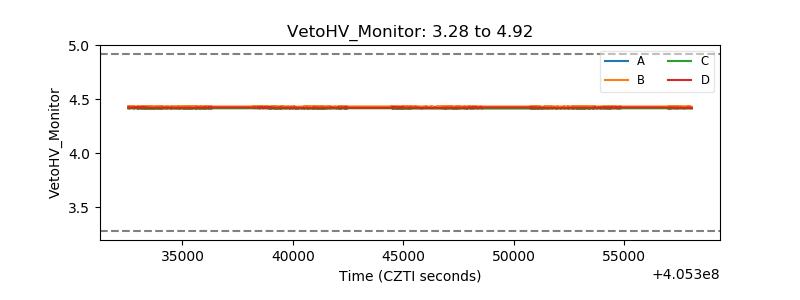 |
| Veto LLD | 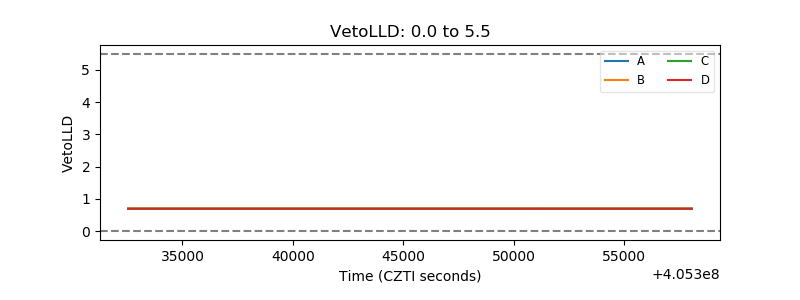 |
| Alpha Counter | 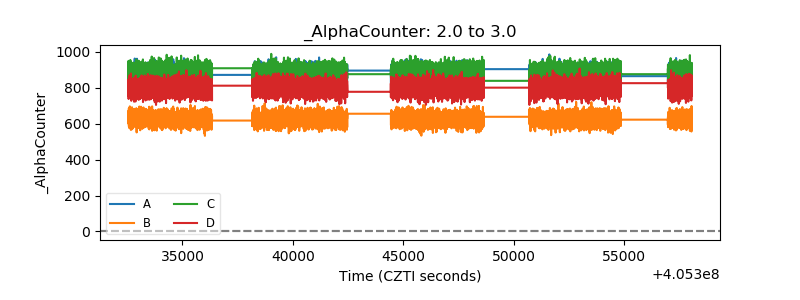 |
| _CPM_Rate | 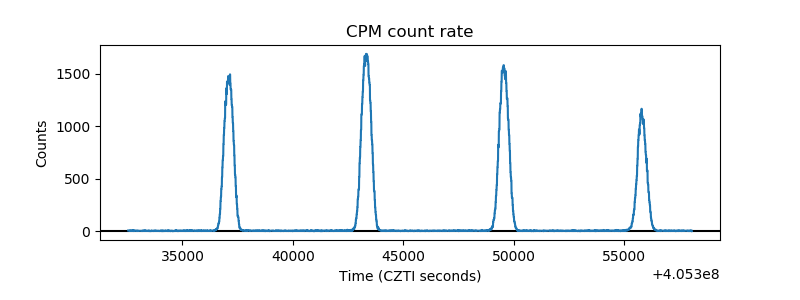 |
| CZT Counter |  |
| +2.5 Volts monitor | 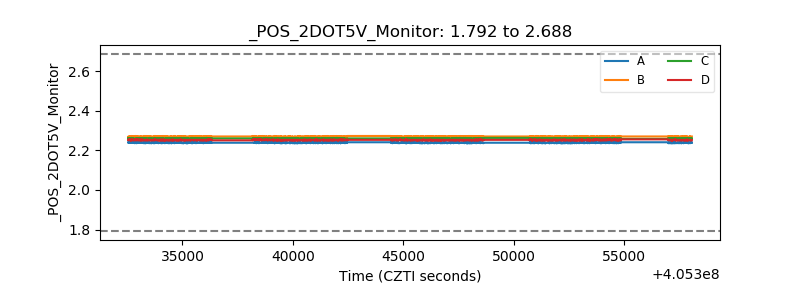 |
| +5 Volts monitor | 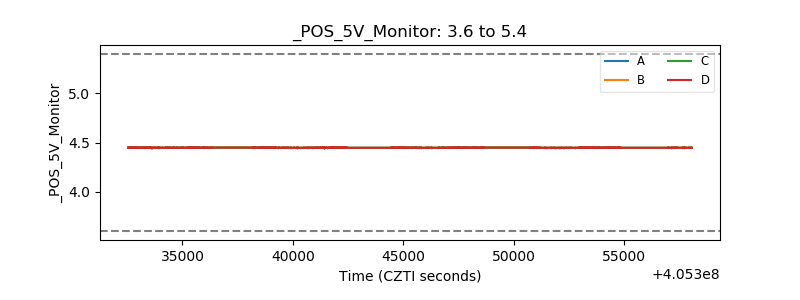 |
| _ROLL_ROT | 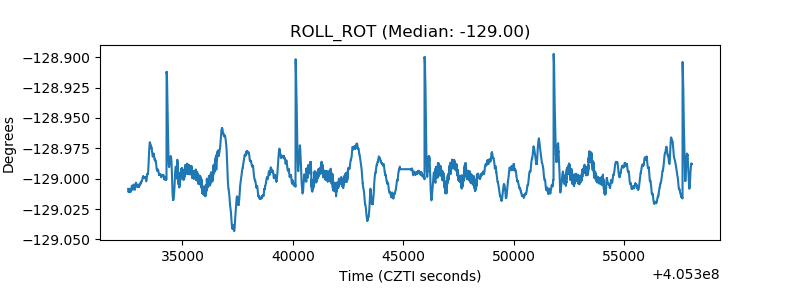 |
| _Roll_DEC |  |
| _Roll_RA | 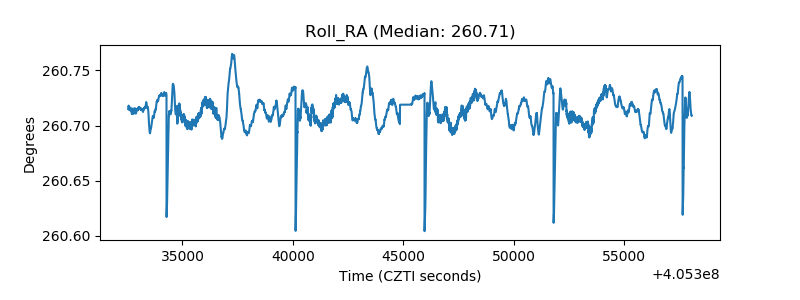 |
| Veto Counter | 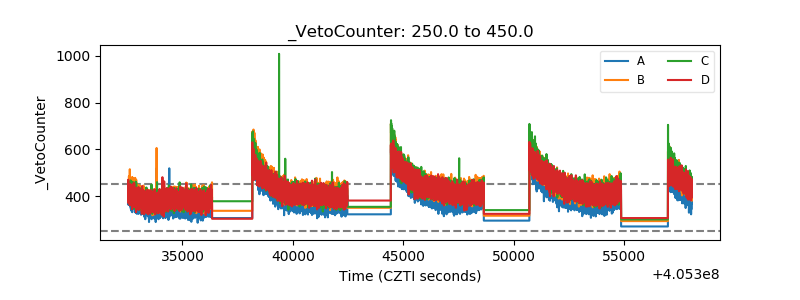 |