| Param | Original file | Final file |
|---|---|---|
| Filename | modeM0/AS1A12_018T01_9000005386_38420cztM0_level2.fits | modeM0/AS1A12_018T01_9000005386_38420cztM0_level2_quad_clean.evt |
| Size (bytes) | 343,146,240 | 88,407,360 |
| Size | 327.2 MB | 84.3 MB |
| Events in quadrant A | 3,077,591 | 600,148 |
| Events in quadrant B | 2,599,849 | 612,206 |
| Events in quadrant C | 2,484,268 | 588,972 |
| Events in quadrant D | 4,154,311 | 527,804 |
| Mode SS | |||
|---|---|---|---|
| Quadrant | BADHDUFLAG | Total packets | Discarded packets |
| A | 0 | 102 | 0 |
| B | 0 | 102 | 0 |
| C | 0 | 102 | 0 |
| D | 0 | 102 | 0 |
| Mode M9 | |||
|---|---|---|---|
| Quadrant | BADHDUFLAG | Total packets | Discarded packets |
| A | 0 | 21 | 0 |
| B | 0 | 21 | 0 |
| C | 0 | 21 | 0 |
| D | 0 | 22 | 0 |
| Mode M0 | |||
|---|---|---|---|
| Quadrant | BADHDUFLAG | Total packets | Discarded packets |
| A | 0 | 12294 | 3 |
| B | 0 | 10912 | 2 |
| C | 0 | 10257 | 2 |
| D | 0 | 15764 | 2 |
| Quadrant | Total seconds | Saturated seconds | Saturation percentage |
|---|---|---|---|
| A | 4961 | 66 | 1.330377% |
| B | 4961 | 48 | 0.967547% |
| C | 4961 | 28 | 0.564402% |
| D | 4961 | 238 | 4.797420% |
Noise dominated data is calculated using 1-second bins in cleaned event files. If a bin has >2000 counts, and if more than 50% of those come from <1% of pixels, then it is considered to be noise-dominated and hence unusable.
| Quadrant | # 1 sec bins | Bins with >0 counts | Bins with >2000 counts | High rate bins dominated by noise | Noise dominated (total time) | Noise dominated (detector-on time) | Marked lightcurve |
|---|---|---|---|---|---|---|---|
| A | 7083 | 4962 | 50 | 50 | 0.71% | 1.01% | 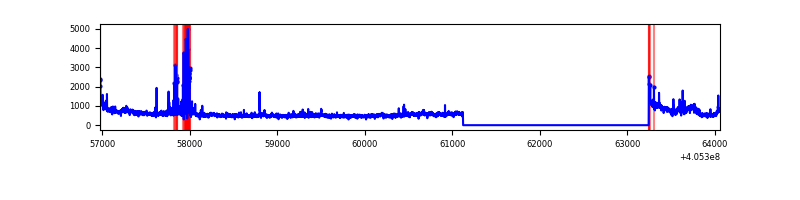 |
| B | 7083 | 4962 | 28 | 28 | 0.40% | 0.56% | 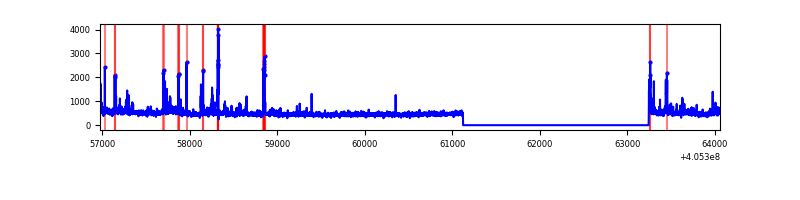 |
| C | 7083 | 4962 | 17 | 17 | 0.24% | 0.34% | 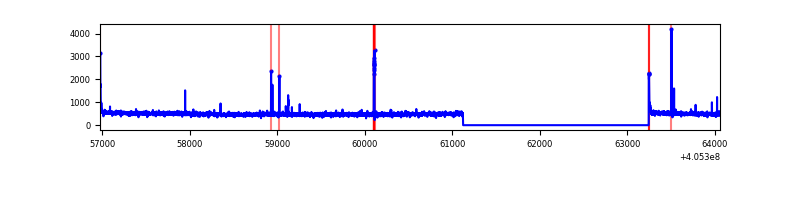 |
| D | 7083 | 4962 | 210 | 210 | 2.96% | 4.23% | 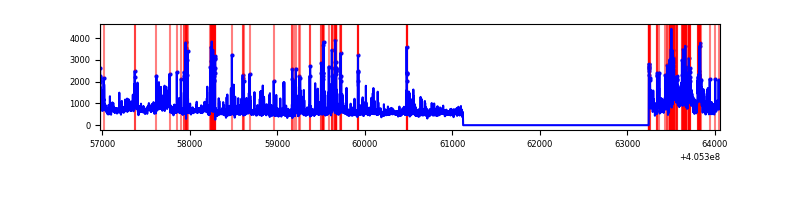 |
Top three noisy pixels from each quadrant. If the there are fewer than three noisy pixels in the level2.evt file, extra rows are filled as -1
| Pixel properties | Quadrant properties | ||||||
|---|---|---|---|---|---|---|---|
| Quadrant | DetID | PixID | Counts | Sigma | Mean | Median | Sigma |
| A | 15 | 223 | 404836 | 3558.56 | 559 | 549 | 113.6 |
| A | 10 | 83 | 399058 | 3507.7 | 559 | 549 | 113.6 |
| A | 13 | 6 | 34523 | 299.04 | 559 | 549 | 113.6 |
| B | 0 | 183 | 177657 | 1670.36 | 560 | 543 | 106.0 |
| B | 4 | 232 | 46316 | 431.68 | 560 | 543 | 106.0 |
| B | 4 | 171 | 32938 | 305.51 | 560 | 543 | 106.0 |
| C | 15 | 214 | 207675 | 1605.72 | 557 | 561 | 129.0 |
| C | 14 | 254 | 40293 | 308.04 | 557 | 561 | 129.0 |
| C | 0 | 10 | 28145 | 213.85 | 557 | 561 | 129.0 |
| D | 12 | 235 | 908037 | 6899.31 | 547 | 532 | 131.5 |
| D | 2 | 250 | 447793 | 3400.3 | 547 | 532 | 131.5 |
| D | 2 | 16 | 352590 | 2676.52 | 547 | 532 | 131.5 |
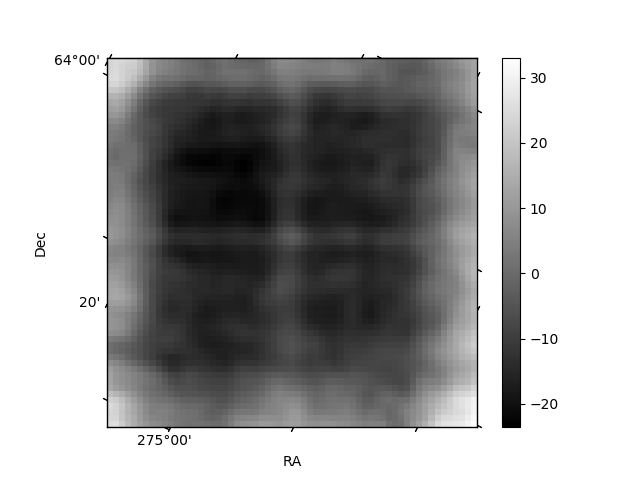
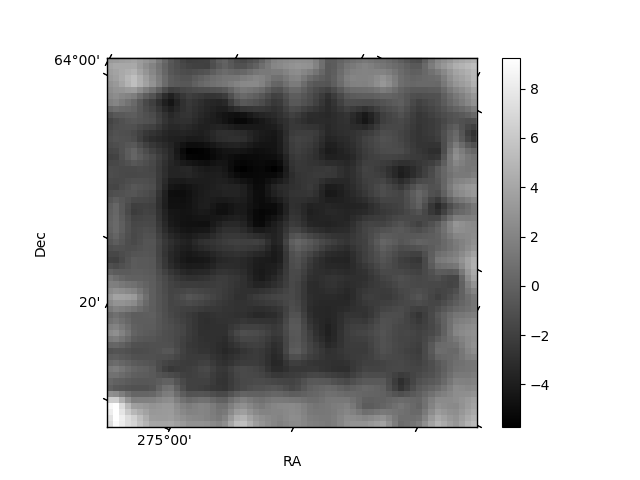
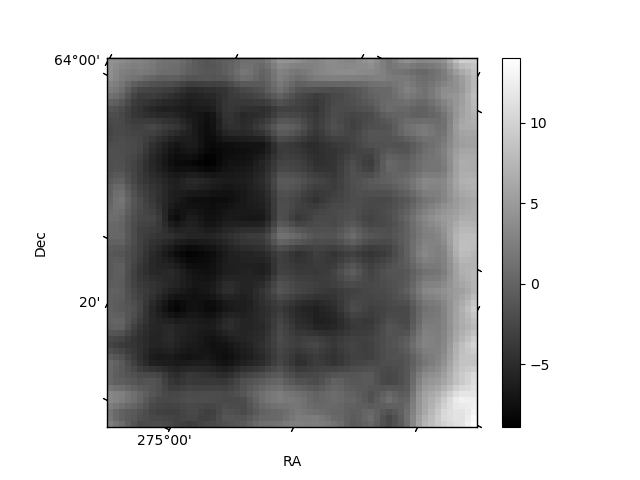
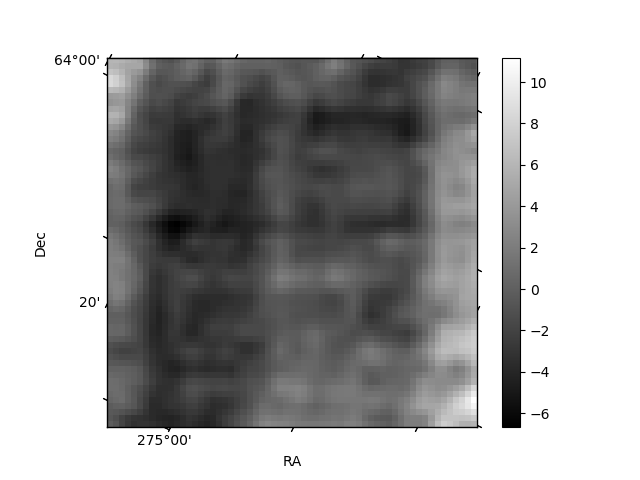
Histogram calculated using DETX and DETY for each event in the final _common_clean file
| Quadrant A | 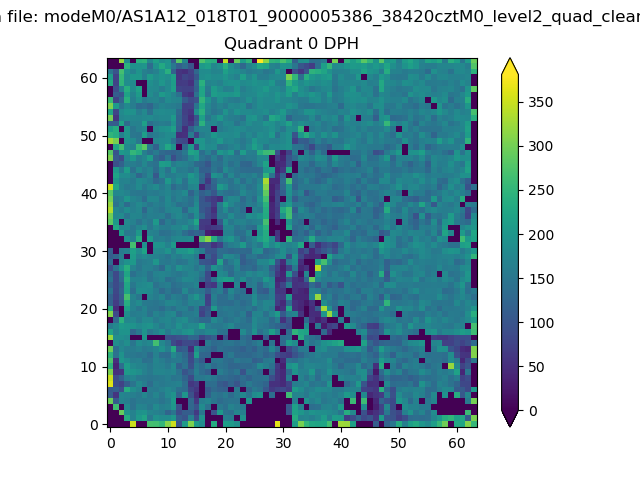 |
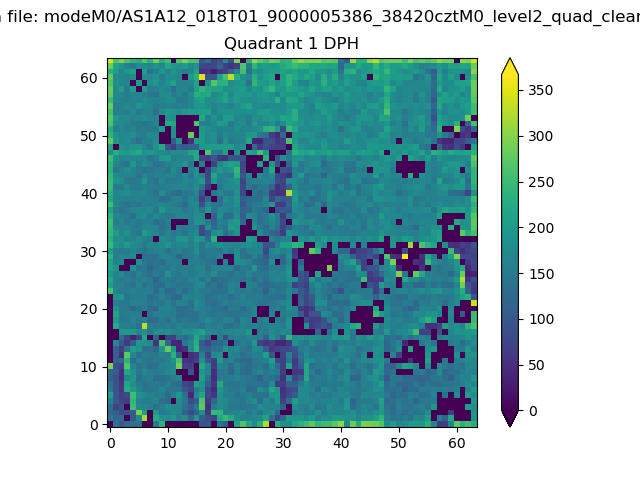 |
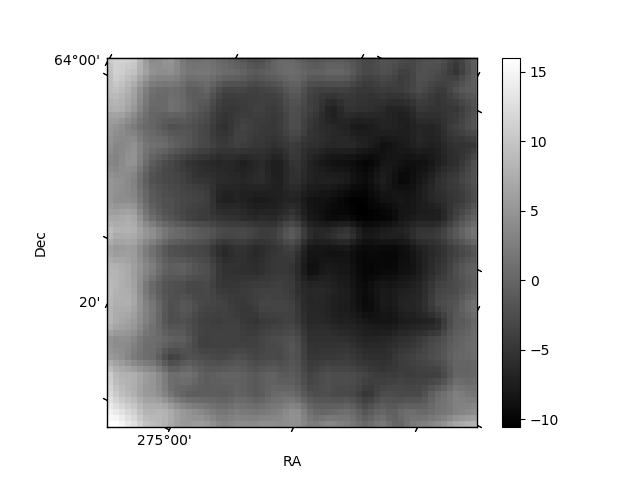
Quadrant B |
|---|---|---|---|
| Quadrant D | 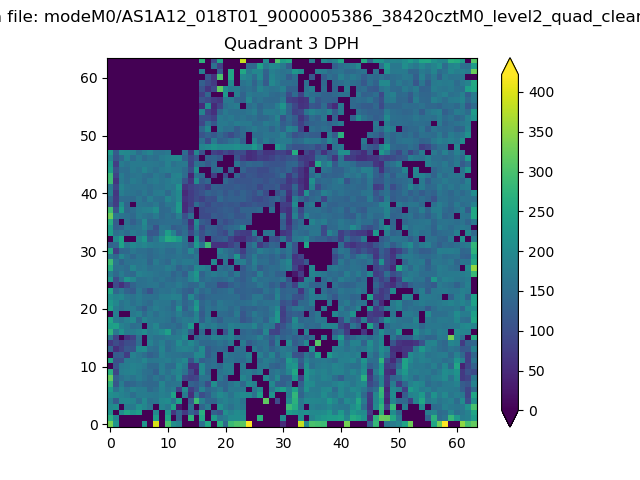 |
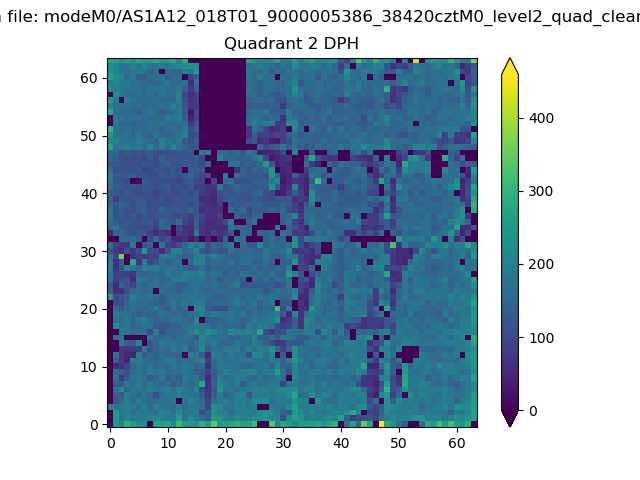 |
Quadrant C |
| Plot type | Count rate plots | Images |
|---|---|---|
| Comparison with Poisson distribution Blue bars denote a histogram of data divided into 1 sec bins. Red curve is a Poisson curve with rate = median count rate of data. |
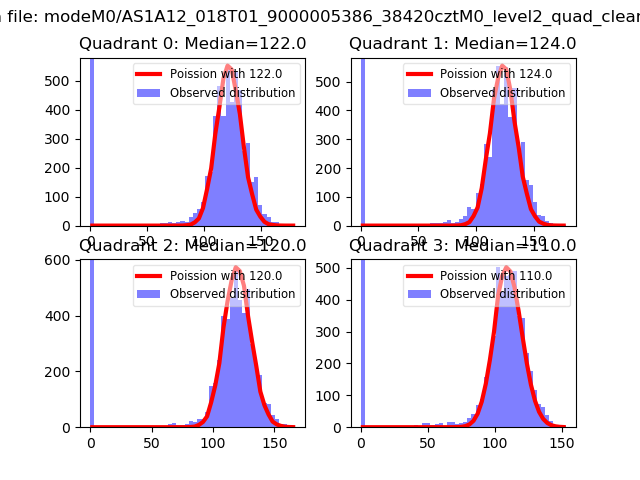 |
 |
| Quadrant-wise count rates Data is divided into 100 sec bins |
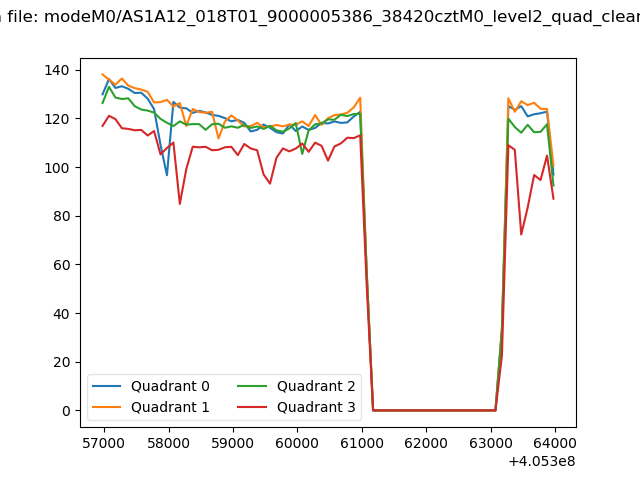 |
|
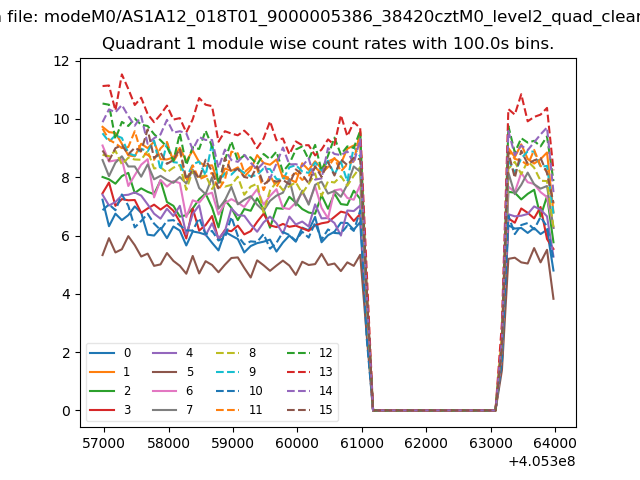
| Module-wise count rates for Quadrant A Data is divided into 100 sec bins |
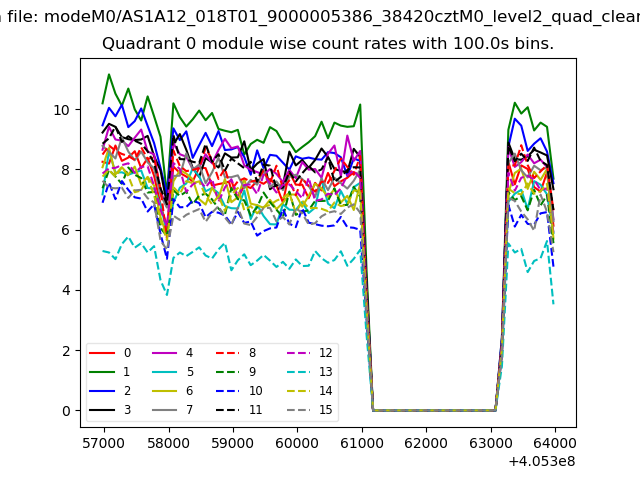 |
 |
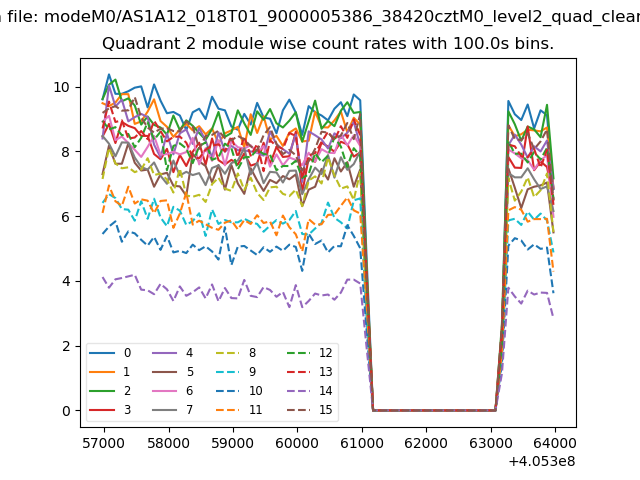
| Module-wise count rates for Quadrant B Data is divided into 100 sec bins |
 |
 |
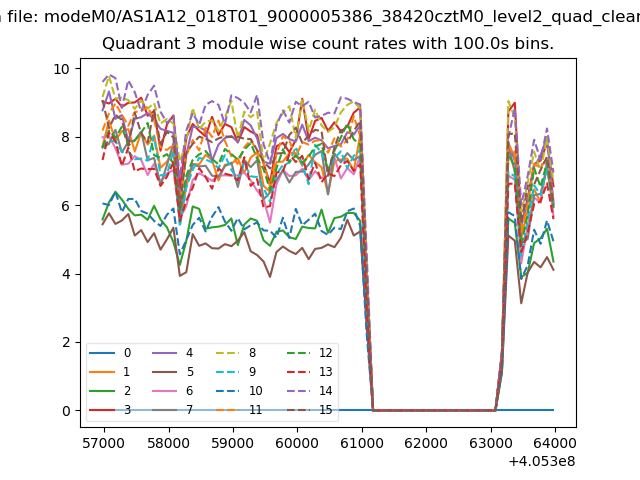
| Module-wise count rates for Quadrant C Data is divided into 100 sec bins |
 |
 |
| Module-wise count rates for Quadrant D Data is divided into 100 sec bins |
 |
 |
| Parameter | Plot |
|---|---|
| CZT HV Monitor | 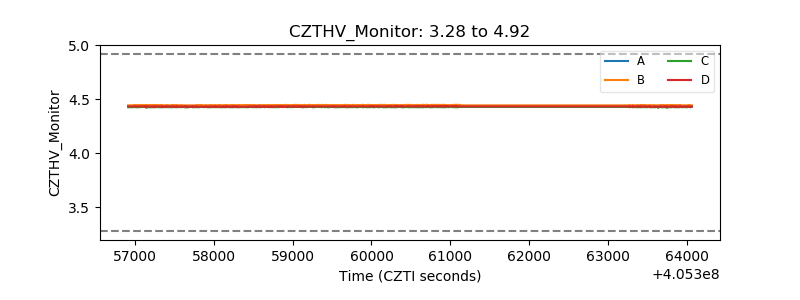 |
| D_VDD | 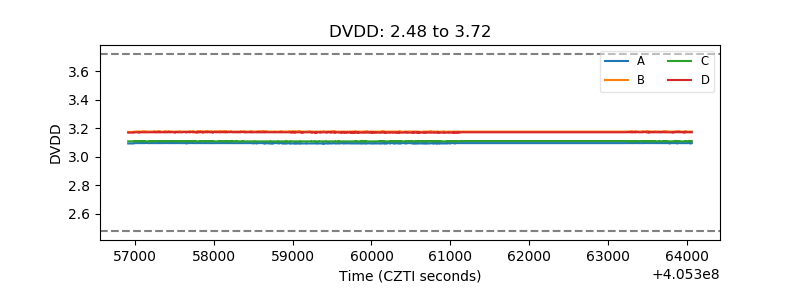 |
| Temperature 1 | 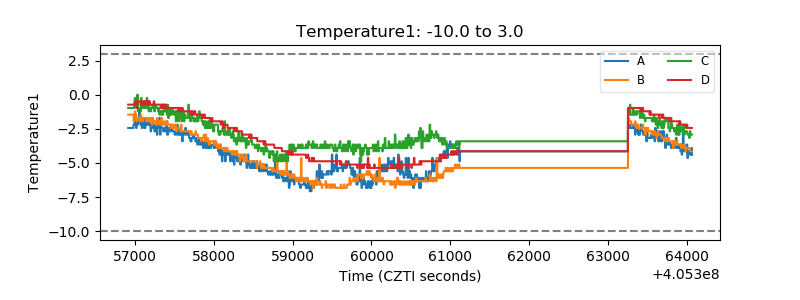 |
| Veto HV Monitor | 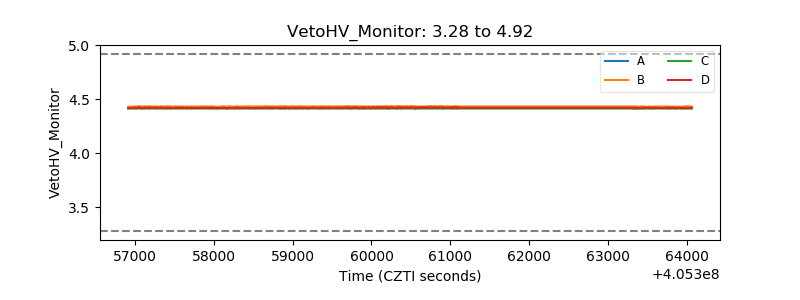 |
| Veto LLD | 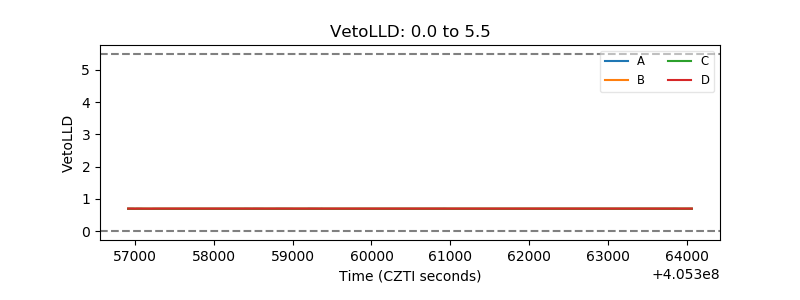 |
| Alpha Counter | 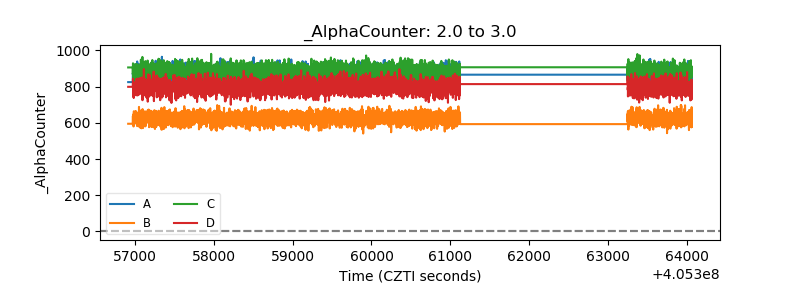 |
| _CPM_Rate | 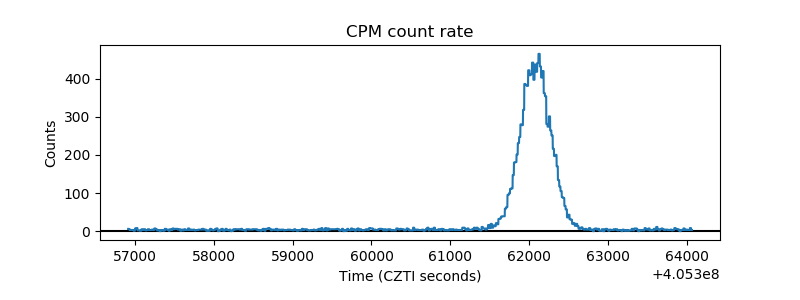 |
| CZT Counter | 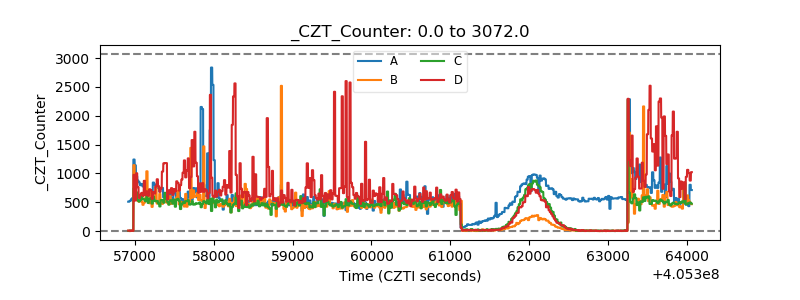 |
| +2.5 Volts monitor | 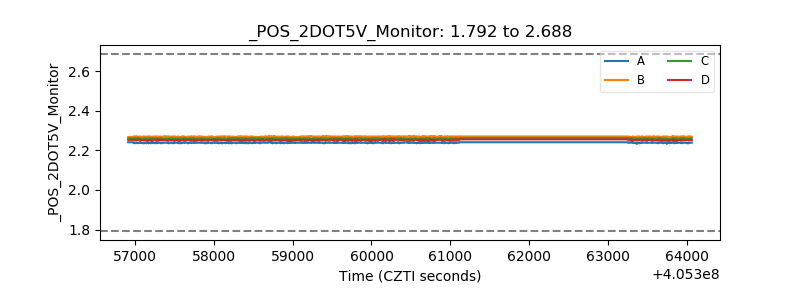 |
| +5 Volts monitor | 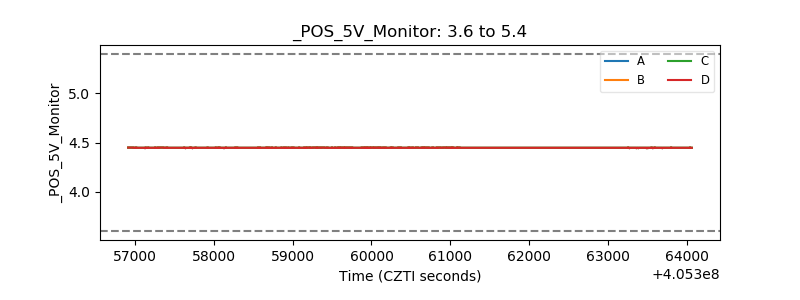 |
| _ROLL_ROT | 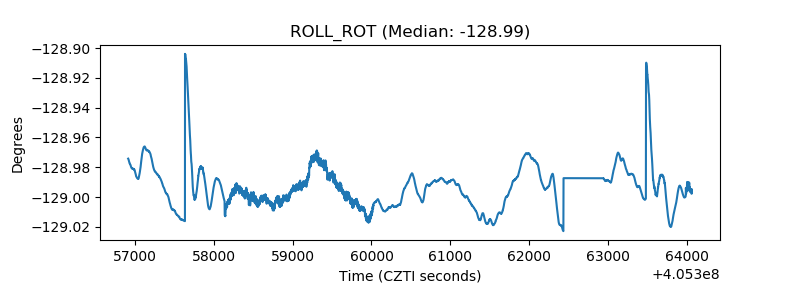 |
| _Roll_DEC |  |
| _Roll_RA | 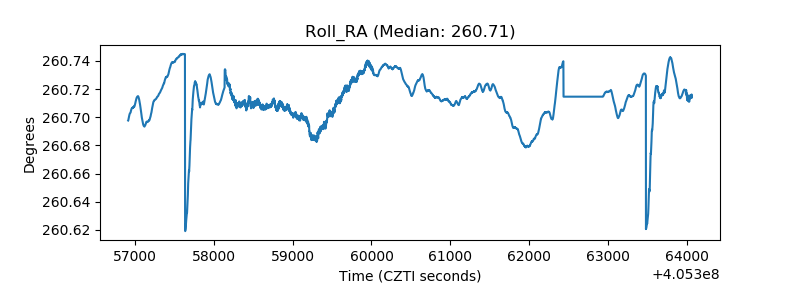 |
| Veto Counter | 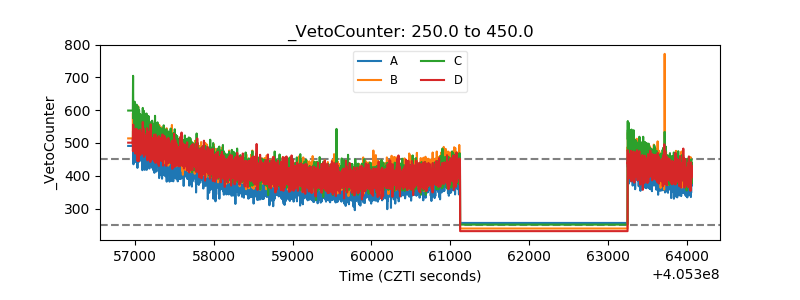 |