| Param | Original file | Final file |
|---|---|---|
| Filename | modeM0/AS1A12_018T01_9000005386_38421cztM0_level2.fits | modeM0/AS1A12_018T01_9000005386_38421cztM0_level2_quad_clean.evt |
| Size (bytes) | 362,191,680 | 86,955,840 |
| Size | 345.4 MB | 82.9 MB |
| Events in quadrant A | 2,943,205 | 591,156 |
| Events in quadrant B | 2,526,580 | 602,725 |
| Events in quadrant C | 2,455,455 | 576,970 |
| Events in quadrant D | 5,084,811 | 503,898 |
| Mode SS | |||
|---|---|---|---|
| Quadrant | BADHDUFLAG | Total packets | Discarded packets |
| A | 0 | 106 | 0 |
| B | 0 | 106 | 0 |
| C | 0 | 106 | 0 |
| D | 0 | 106 | 0 |
| Mode M9 | |||
|---|---|---|---|
| Quadrant | BADHDUFLAG | Total packets | Discarded packets |
| A | 0 | 21 | 0 |
| B | 0 | 21 | 0 |
| C | 0 | 21 | 0 |
| D | 0 | 22 | 0 |
| Mode M0 | |||
|---|---|---|---|
| Quadrant | BADHDUFLAG | Total packets | Discarded packets |
| A | 0 | 11915 | 3 |
| B | 0 | 10880 | 2 |
| C | 0 | 10434 | 2 |
| D | 0 | 18688 | 2 |
| Quadrant | Total seconds | Saturated seconds | Saturation percentage |
|---|---|---|---|
| A | 5105 | 28 | 0.548482% |
| B | 5105 | 16 | 0.313418% |
| C | 5105 | 20 | 0.391773% |
| D | 5105 | 433 | 8.481881% |
Noise dominated data is calculated using 1-second bins in cleaned event files. If a bin has >2000 counts, and if more than 50% of those come from <1% of pixels, then it is considered to be noise-dominated and hence unusable.
| Quadrant | # 1 sec bins | Bins with >0 counts | Bins with >2000 counts | High rate bins dominated by noise | Noise dominated (total time) | Noise dominated (detector-on time) | Marked lightcurve |
|---|---|---|---|---|---|---|---|
| A | 7077 | 5106 | 15 | 15 | 0.21% | 0.29% | 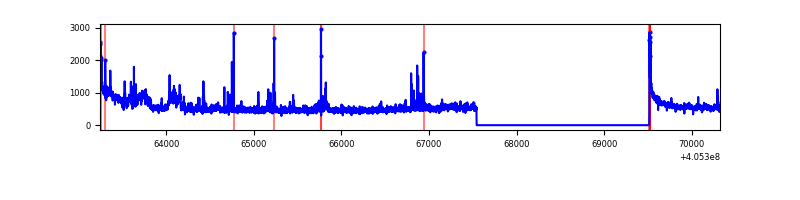 |
| B | 7077 | 5106 | 7 | 7 | 0.10% | 0.14% | 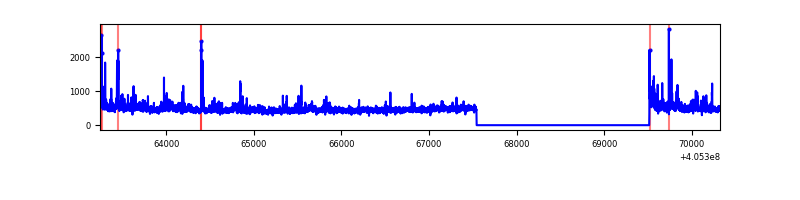 |
| C | 7077 | 5106 | 6 | 6 | 0.08% | 0.12% | 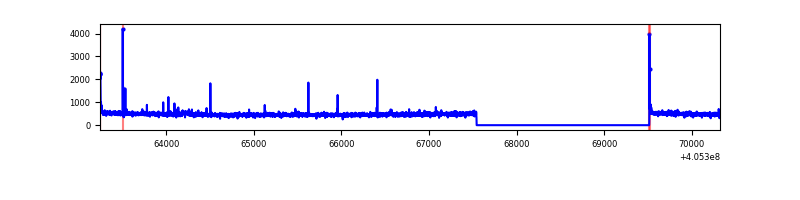 |
| D | 7077 | 5106 | 443 | 443 | 6.26% | 8.68% | 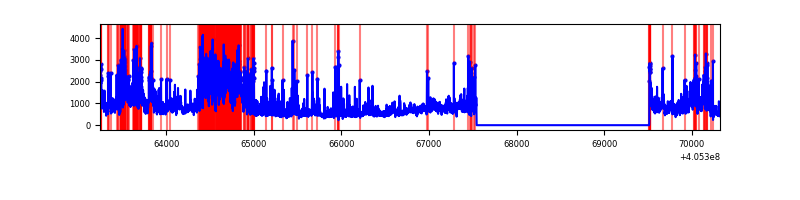 |
Top three noisy pixels from each quadrant. If the there are fewer than three noisy pixels in the level2.evt file, extra rows are filled as -1
| Pixel properties | Quadrant properties | ||||||
|---|---|---|---|---|---|---|---|
| Quadrant | DetID | PixID | Counts | Sigma | Mean | Median | Sigma |
| A | 10 | 83 | 393774 | 3463.33 | 563 | 552 | 113.5 |
| A | 15 | 223 | 182623 | 1603.6 | 563 | 552 | 113.5 |
| A | 12 | 189 | 69224 | 604.83 | 563 | 552 | 113.5 |
| B | 0 | 183 | 89768 | 832.58 | 562 | 547 | 107.2 |
| B | 15 | 35 | 58755 | 543.18 | 562 | 547 | 107.2 |
| B | 0 | 155 | 30077 | 275.56 | 562 | 547 | 107.2 |
| C | 15 | 214 | 217067 | 1667.98 | 555 | 558 | 129.8 |
| C | 0 | 10 | 26251 | 197.94 | 555 | 558 | 129.8 |
| C | 14 | 254 | 21016 | 157.61 | 555 | 558 | 129.8 |
| D | 12 | 235 | 1933710 | 14852.41 | 539 | 525 | 130.2 |
| D | 2 | 250 | 339008 | 2600.52 | 539 | 525 | 130.2 |
| D | 2 | 16 | 332383 | 2549.62 | 539 | 525 | 130.2 |
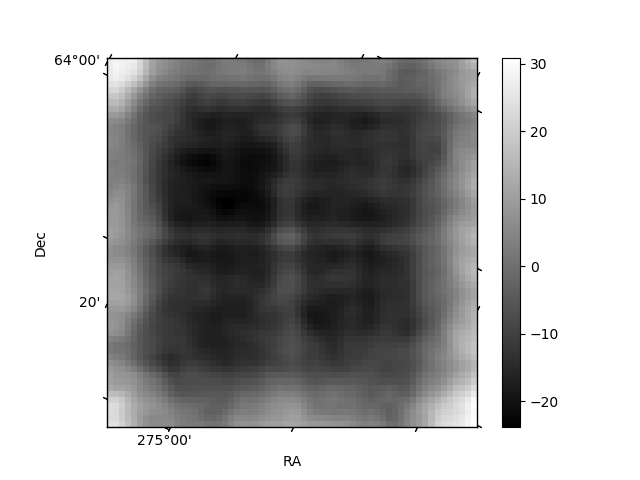
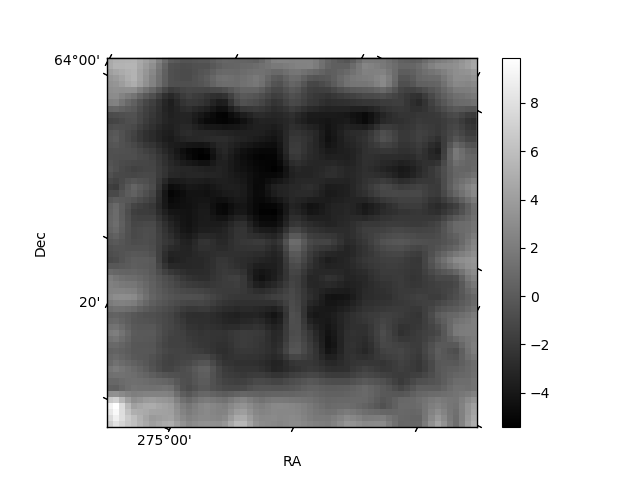
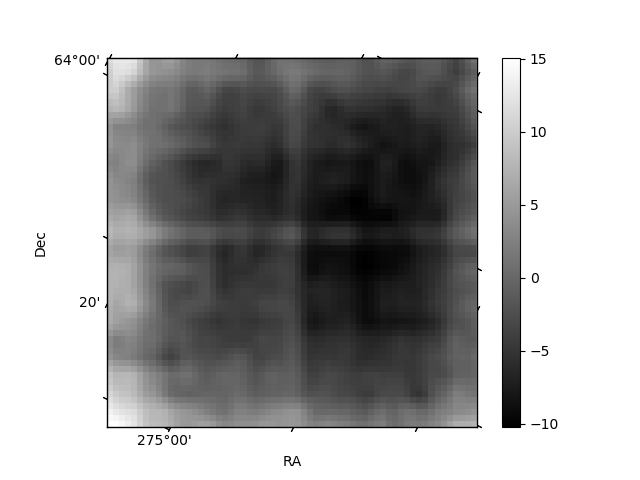
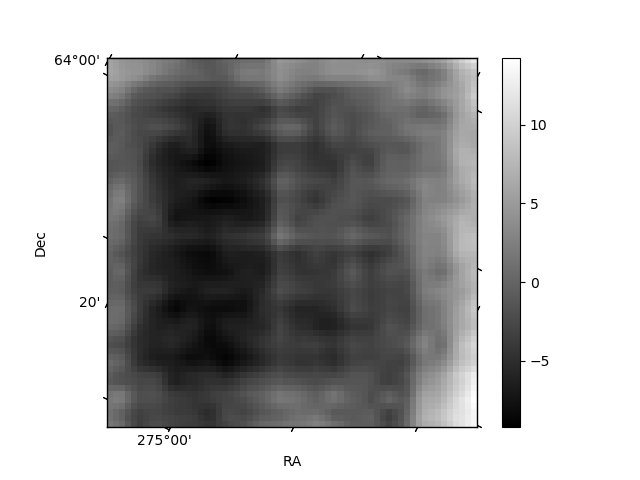
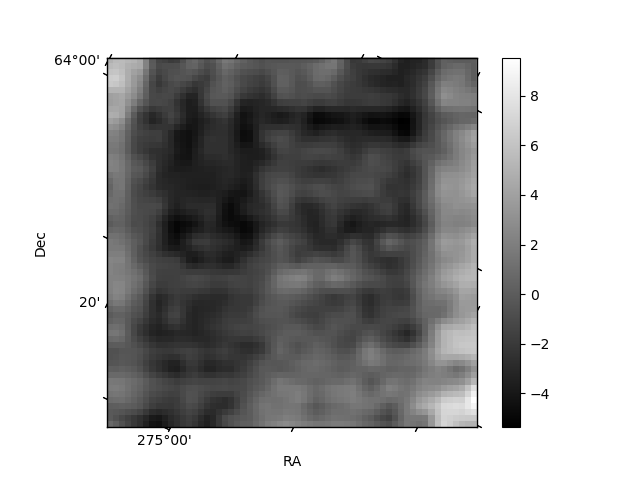
Histogram calculated using DETX and DETY for each event in the final _common_clean file
| Quadrant A | 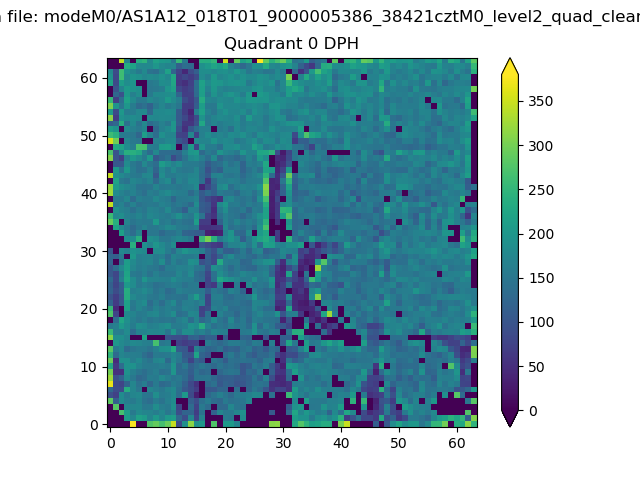 |
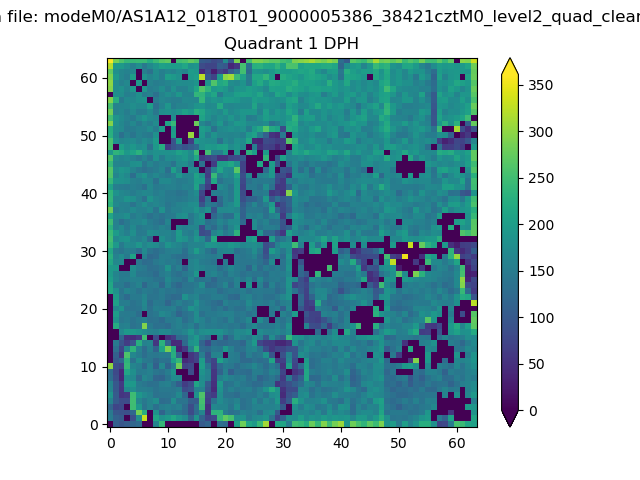 |
Quadrant B |
|---|---|---|---|
| Quadrant D | 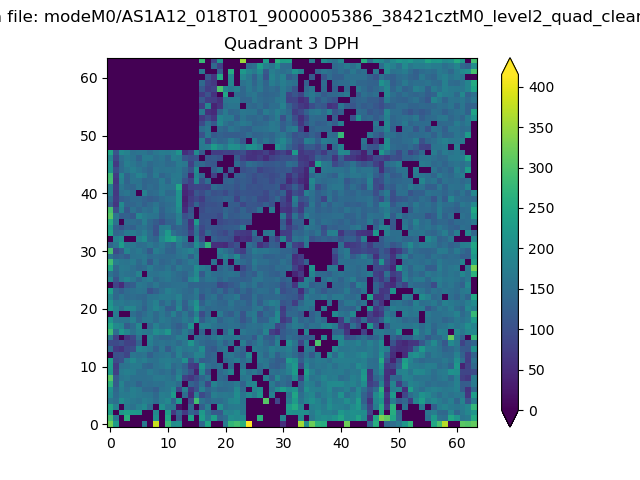 |
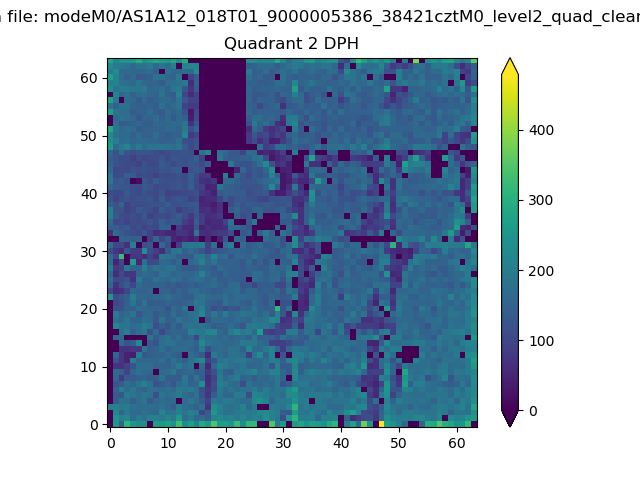 |
Quadrant C |
| Plot type | Count rate plots | Images |
|---|---|---|
| Comparison with Poisson distribution Blue bars denote a histogram of data divided into 1 sec bins. Red curve is a Poisson curve with rate = median count rate of data. |
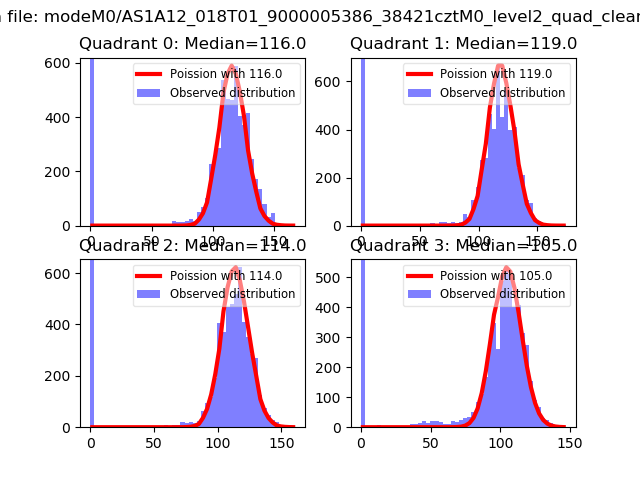 |
 |
| Quadrant-wise count rates Data is divided into 100 sec bins |
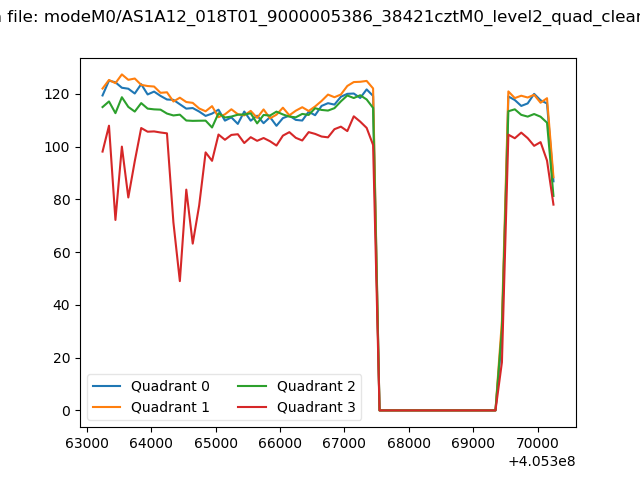 |
|
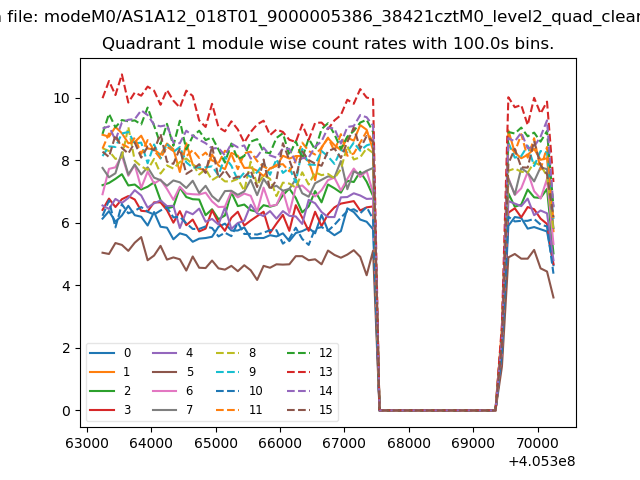
| Module-wise count rates for Quadrant A Data is divided into 100 sec bins |
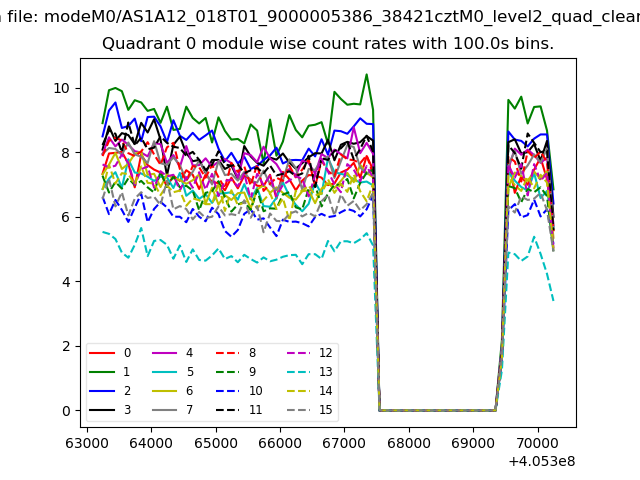 |
 |
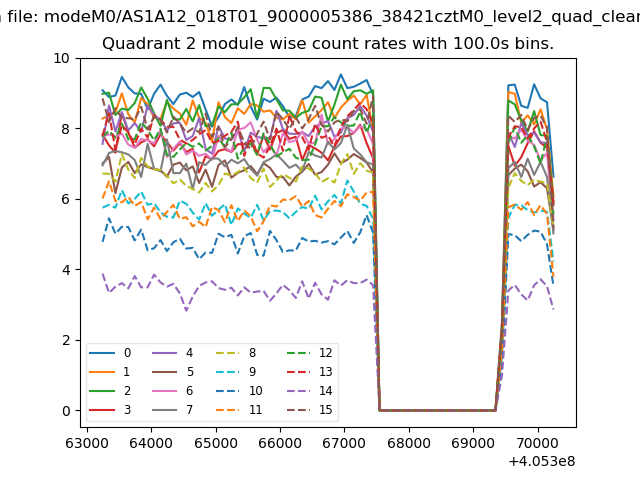
| Module-wise count rates for Quadrant B Data is divided into 100 sec bins |
 |
 |
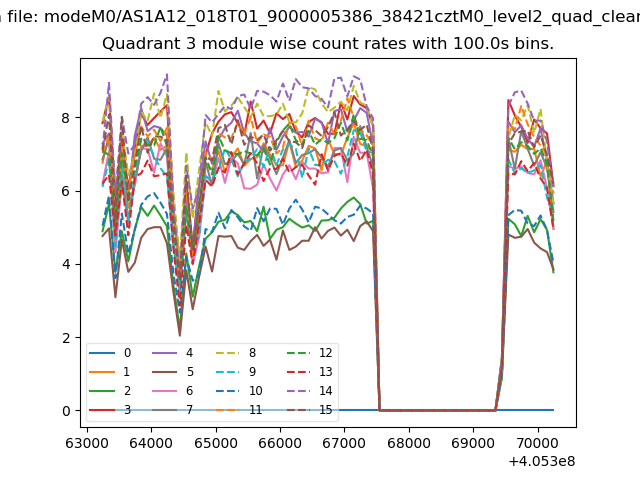
| Module-wise count rates for Quadrant C Data is divided into 100 sec bins |
 |
 |
| Module-wise count rates for Quadrant D Data is divided into 100 sec bins |
 |
 |
| Parameter | Plot |
|---|---|
| CZT HV Monitor | 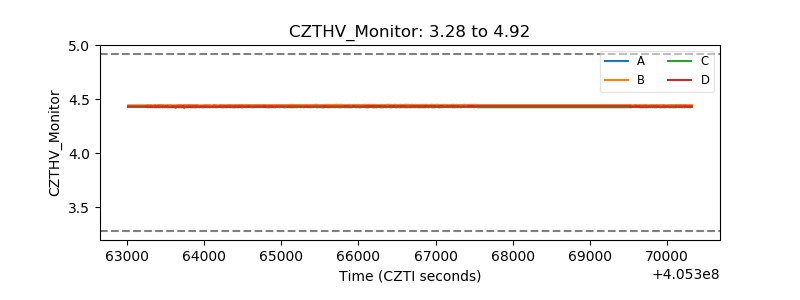 |
| D_VDD | 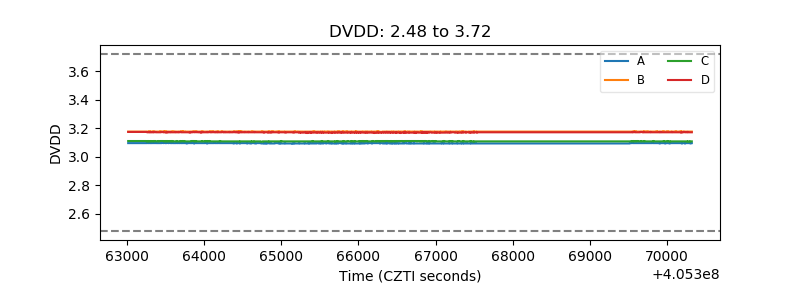 |
| Temperature 1 | 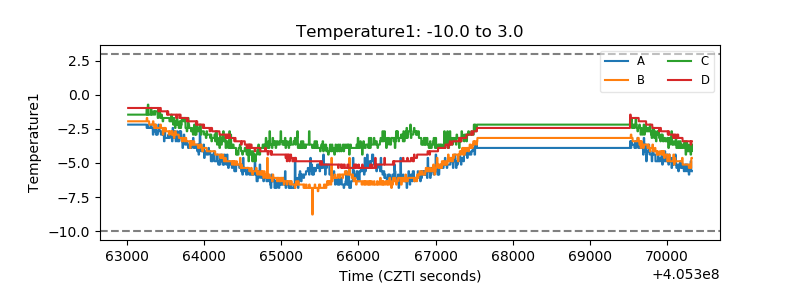 |
| Veto HV Monitor | 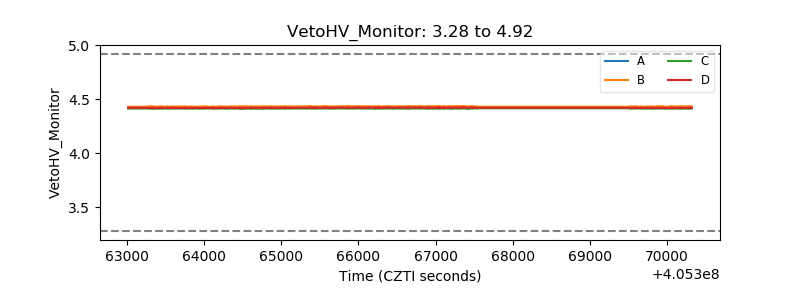 |
| Veto LLD | 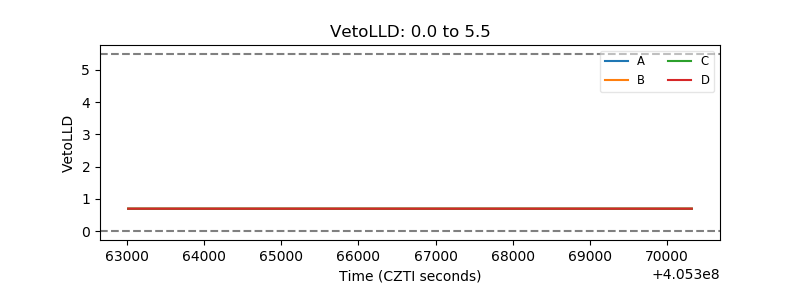 |
| Alpha Counter | 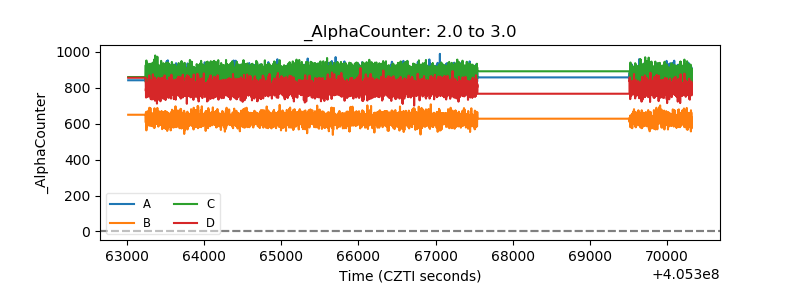 |
| _CPM_Rate | 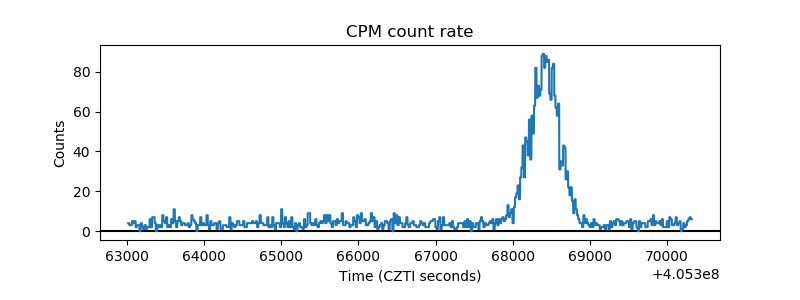 |
| CZT Counter | 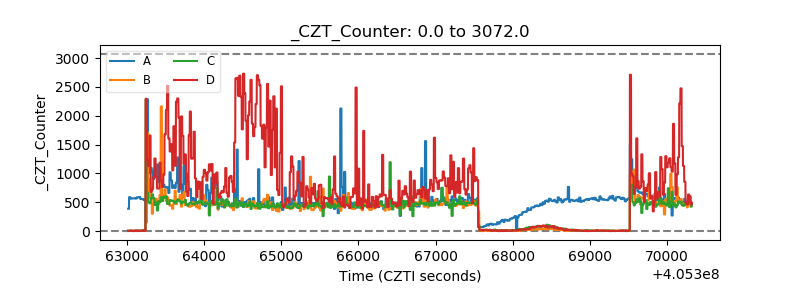 |
| +2.5 Volts monitor | 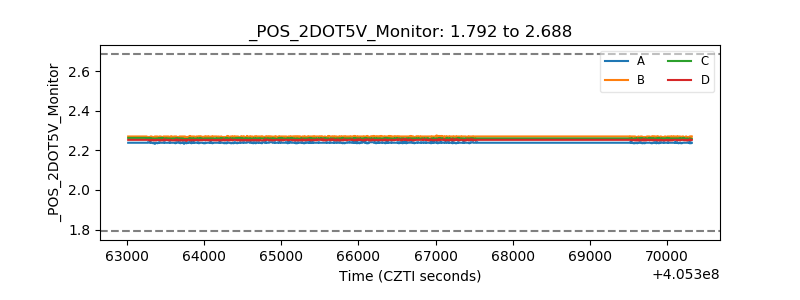 |
| +5 Volts monitor | 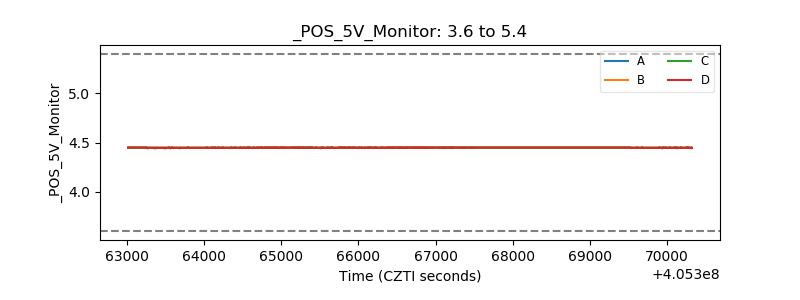 |
| _ROLL_ROT | 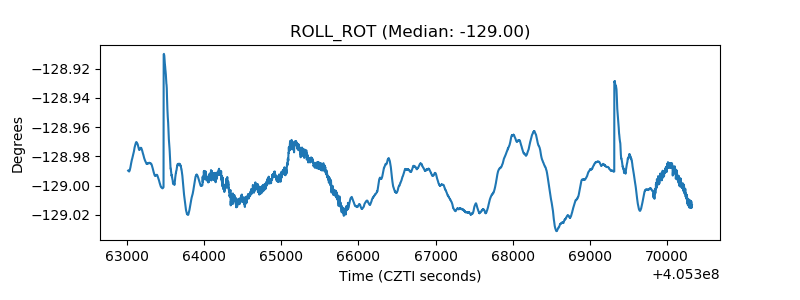 |
| _Roll_DEC |  |
| _Roll_RA | 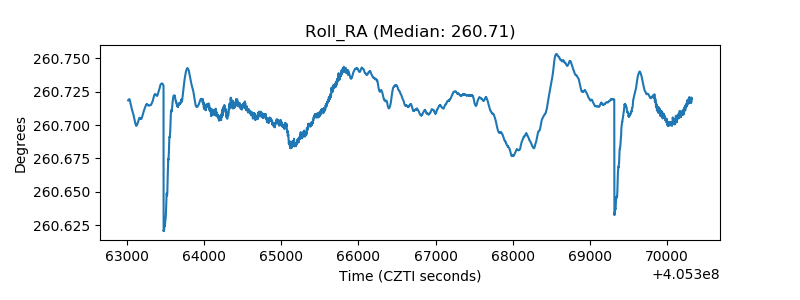 |
| Veto Counter | 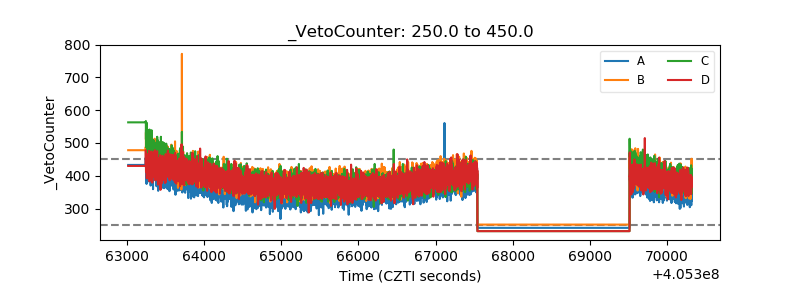 |