| Param | Original file | Final file |
|---|---|---|
| Filename | modeM0/AS1A12_018T01_9000005386_38422cztM0_level2.fits | modeM0/AS1A12_018T01_9000005386_38422cztM0_level2_quad_clean.evt |
| Size (bytes) | 338,425,920 | 89,167,680 |
| Size | 322.7 MB | 85.0 MB |
| Events in quadrant A | 3,004,026 | 596,897 |
| Events in quadrant B | 3,014,453 | 603,623 |
| Events in quadrant C | 2,494,251 | 587,069 |
| Events in quadrant D | 3,600,381 | 539,242 |
| Mode SS | |||
|---|---|---|---|
| Quadrant | BADHDUFLAG | Total packets | Discarded packets |
| A | 0 | 110 | 0 |
| B | 0 | 110 | 0 |
| C | 0 | 110 | 0 |
| D | 0 | 110 | 0 |
| Mode M9 | |||
|---|---|---|---|
| Quadrant | BADHDUFLAG | Total packets | Discarded packets |
| A | 0 | 21 | 0 |
| B | 0 | 21 | 0 |
| C | 0 | 21 | 0 |
| D | 0 | 22 | 0 |
| Mode M0 | |||
|---|---|---|---|
| Quadrant | BADHDUFLAG | Total packets | Discarded packets |
| A | 0 | 12399 | 3 |
| B | 0 | 12568 | 2 |
| C | 0 | 10768 | 2 |
| D | 0 | 14294 | 2 |
| Quadrant | Total seconds | Saturated seconds | Saturation percentage |
|---|---|---|---|
| A | 5322 | 39 | 0.732807% |
| B | 5322 | 80 | 1.503194% |
| C | 5322 | 7 | 0.131530% |
| D | 5322 | 110 | 2.066892% |
Noise dominated data is calculated using 1-second bins in cleaned event files. If a bin has >2000 counts, and if more than 50% of those come from <1% of pixels, then it is considered to be noise-dominated and hence unusable.
| Quadrant | # 1 sec bins | Bins with >0 counts | Bins with >2000 counts | High rate bins dominated by noise | Noise dominated (total time) | Noise dominated (detector-on time) | Marked lightcurve |
|---|---|---|---|---|---|---|---|
| A | 6965 | 5323 | 30 | 30 | 0.43% | 0.56% | 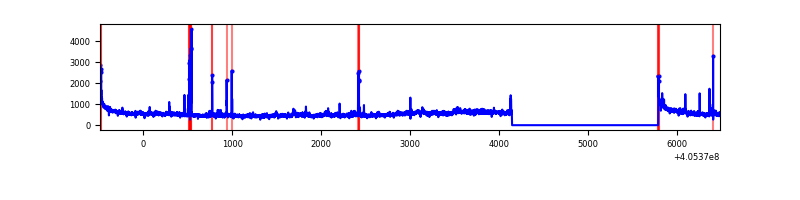 |
| B | 6965 | 5323 | 40 | 40 | 0.57% | 0.75% | 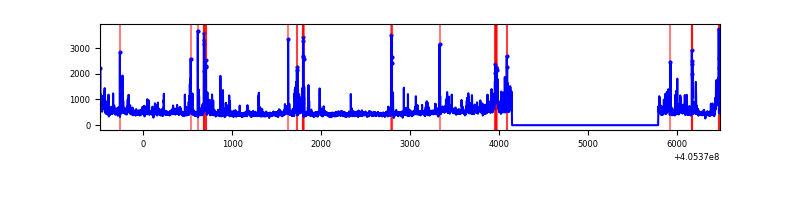 |
| C | 6965 | 5323 | 3 | 3 | 0.04% | 0.06% | 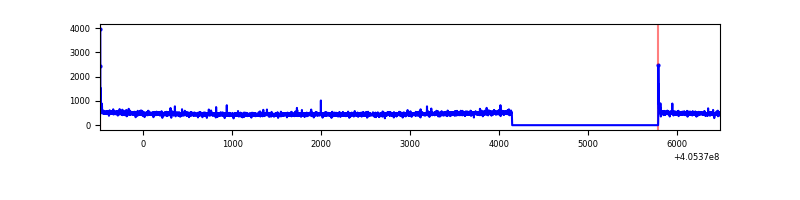 |
| D | 6965 | 5323 | 88 | 88 | 1.26% | 1.65% | 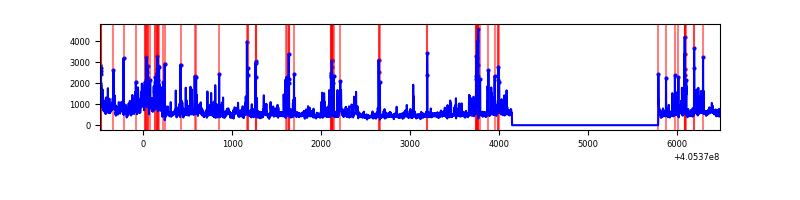 |
Top three noisy pixels from each quadrant. If the there are fewer than three noisy pixels in the level2.evt file, extra rows are filled as -1
| Pixel properties | Quadrant properties | ||||||
|---|---|---|---|---|---|---|---|
| Quadrant | DetID | PixID | Counts | Sigma | Mean | Median | Sigma |
| A | 10 | 83 | 397863 | 3336.6 | 583 | 571 | 119.1 |
| A | 15 | 223 | 151940 | 1271.25 | 583 | 571 | 119.1 |
| A | 9 | 143 | 112288 | 938.24 | 583 | 571 | 119.1 |
| B | 0 | 183 | 168439 | 1514.32 | 579 | 562 | 110.9 |
| B | 4 | 171 | 167895 | 1509.41 | 579 | 562 | 110.9 |
| B | 0 | 229 | 138182 | 1241.39 | 579 | 562 | 110.9 |
| C | 15 | 214 | 225274 | 1671.24 | 574 | 576 | 134.5 |
| C | 0 | 10 | 21199 | 153.39 | 574 | 576 | 134.5 |
| C | 14 | 254 | 6236 | 42.1 | 574 | 576 | 134.5 |
| D | 12 | 235 | 694889 | 5037.56 | 567 | 553 | 137.8 |
| D | 2 | 153 | 273266 | 1978.59 | 567 | 553 | 137.8 |
| D | 2 | 250 | 102218 | 737.6 | 567 | 553 | 137.8 |
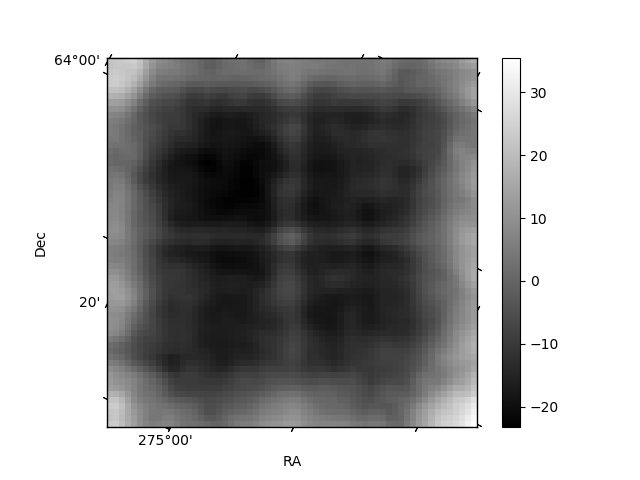
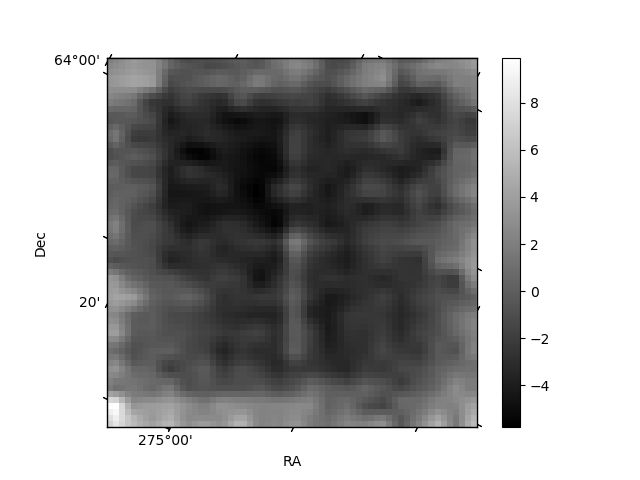
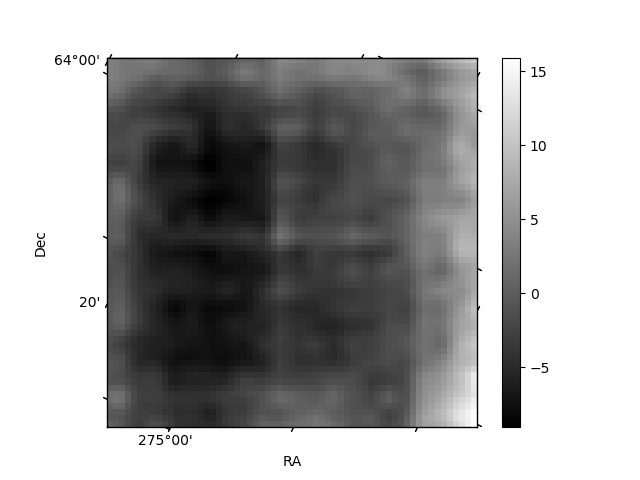
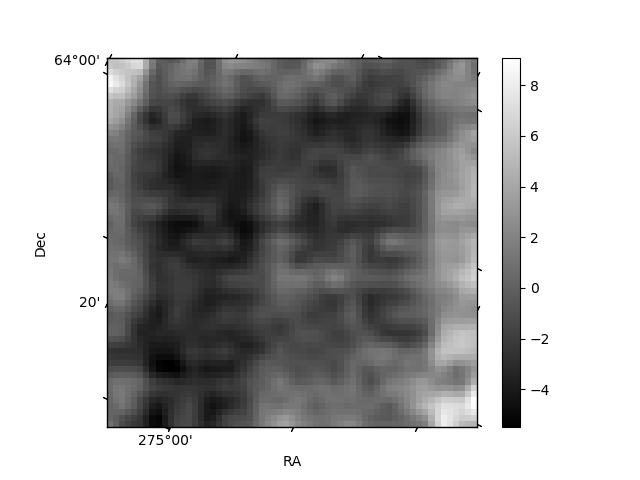
Histogram calculated using DETX and DETY for each event in the final _common_clean file
| Quadrant A | 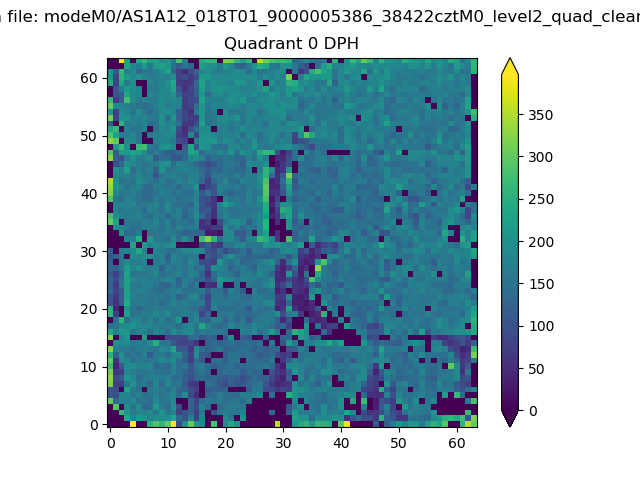 |
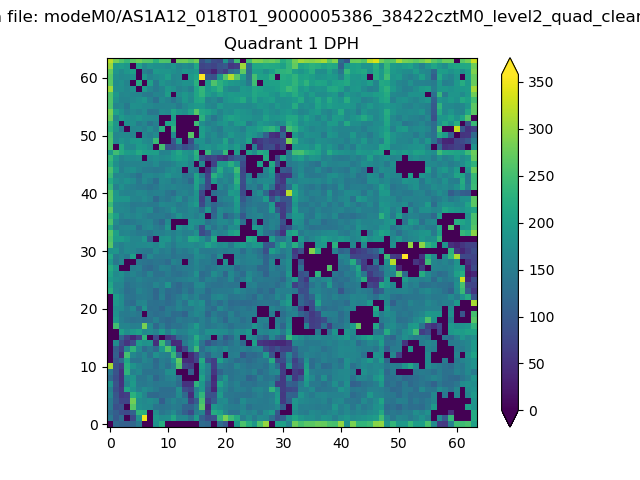 |
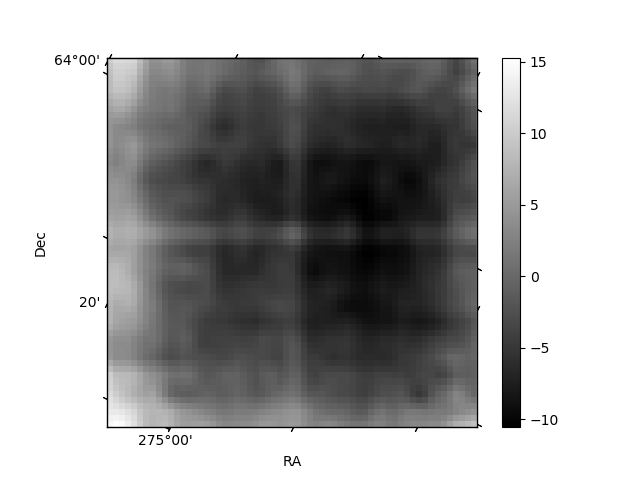
Quadrant B |
|---|---|---|---|
| Quadrant D | 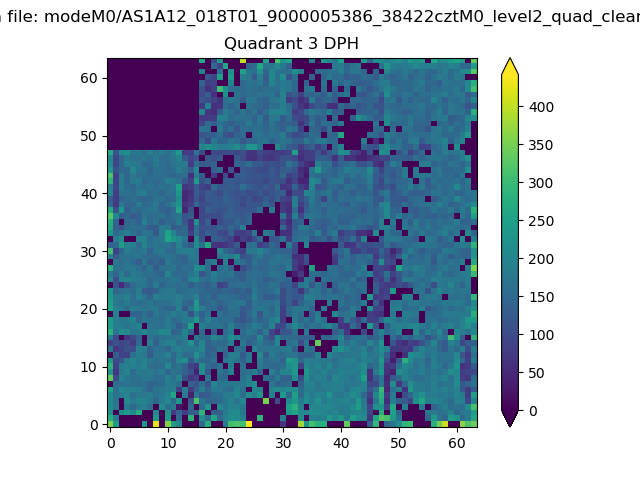 |
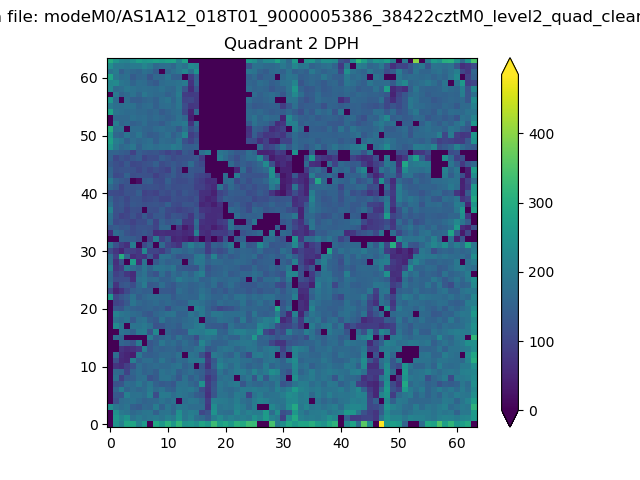 |
Quadrant C |
| Plot type | Count rate plots | Images |
|---|---|---|
| Comparison with Poisson distribution Blue bars denote a histogram of data divided into 1 sec bins. Red curve is a Poisson curve with rate = median count rate of data. |
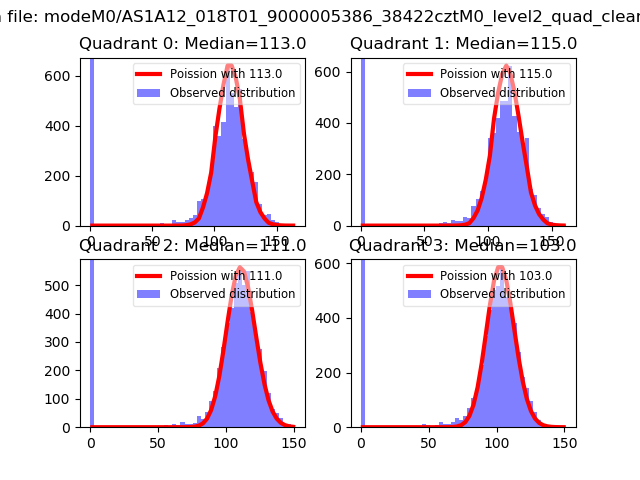 |
 |
| Quadrant-wise count rates Data is divided into 100 sec bins |
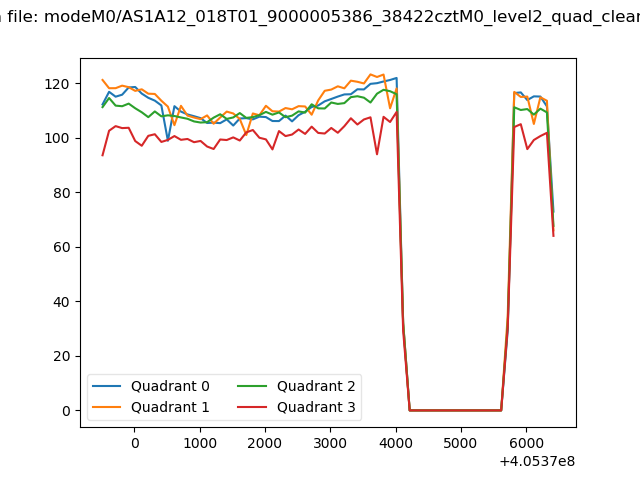 |
|
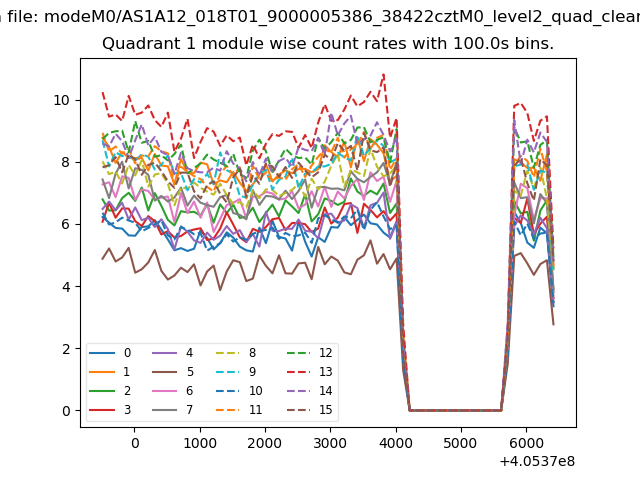
| Module-wise count rates for Quadrant A Data is divided into 100 sec bins |
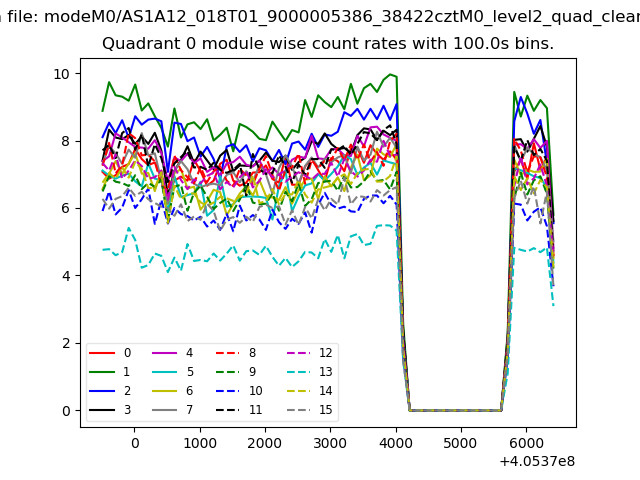 |
 |
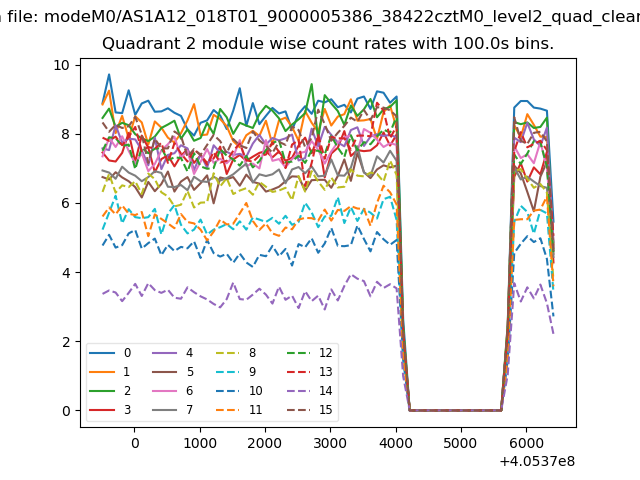
| Module-wise count rates for Quadrant B Data is divided into 100 sec bins |
 |
 |
| Module-wise count rates for Quadrant C Data is divided into 100 sec bins |
 |
 |
| Module-wise count rates for Quadrant D Data is divided into 100 sec bins |
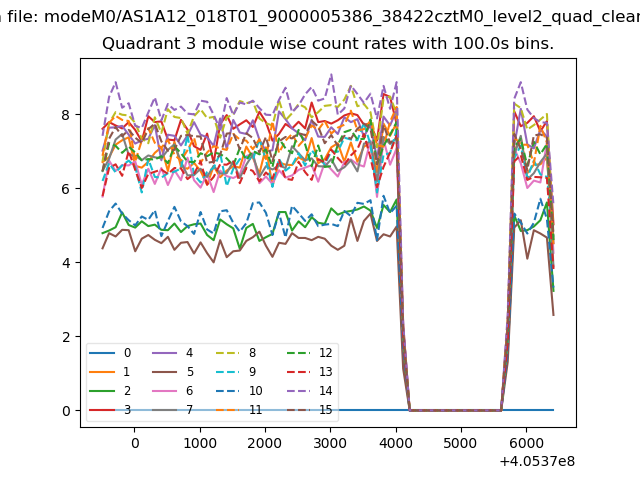 |
 |
| Parameter | Plot |
|---|---|
| CZT HV Monitor |  |
| D_VDD | 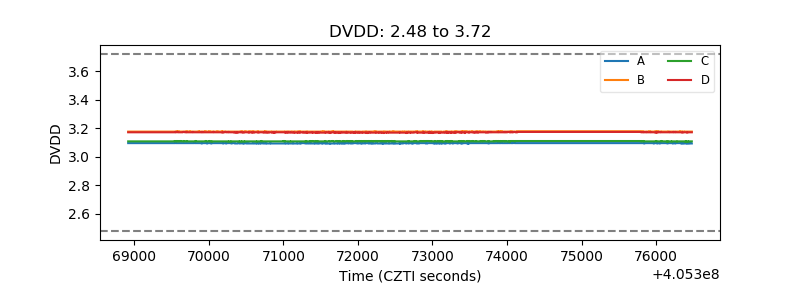 |
| Temperature 1 | 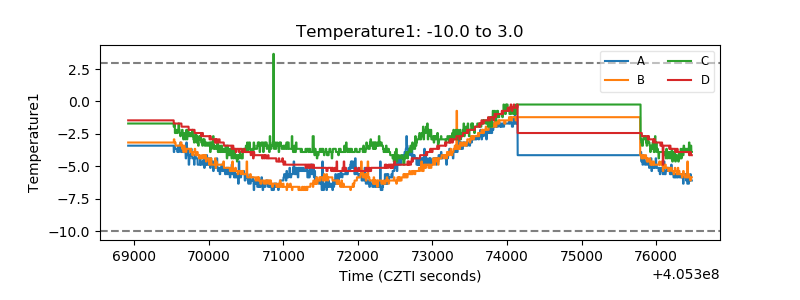 |
| Veto HV Monitor | 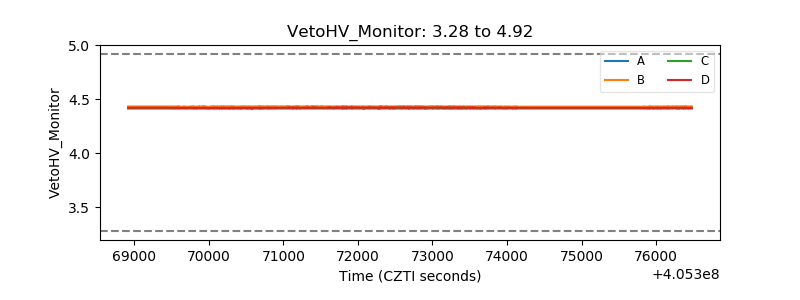 |
| Veto LLD | 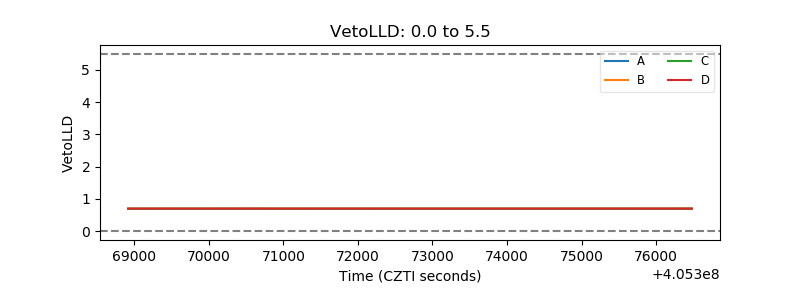 |
| Alpha Counter | 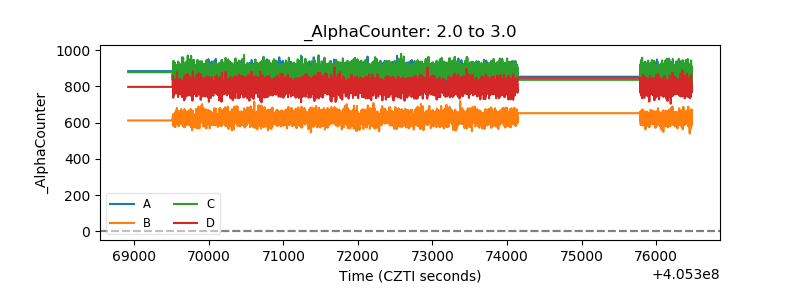 |
| _CPM_Rate | 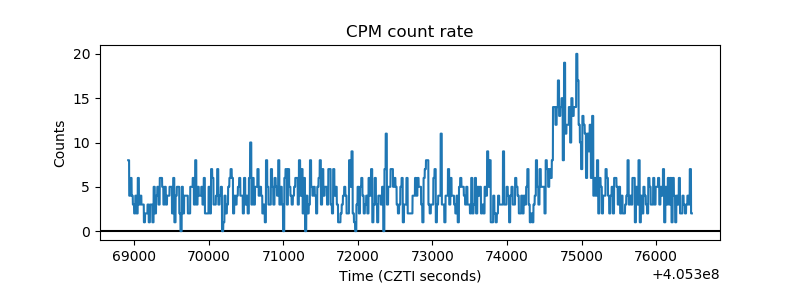 |
| CZT Counter | 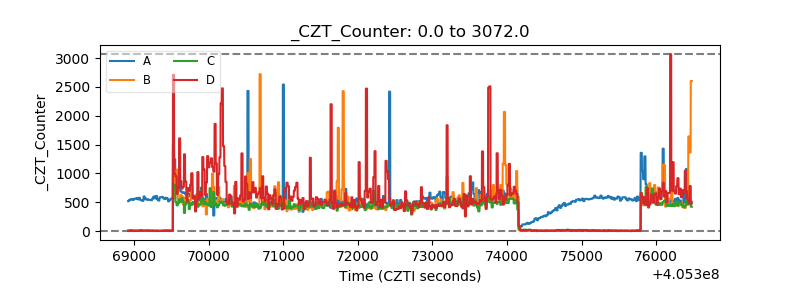 |
| +2.5 Volts monitor | 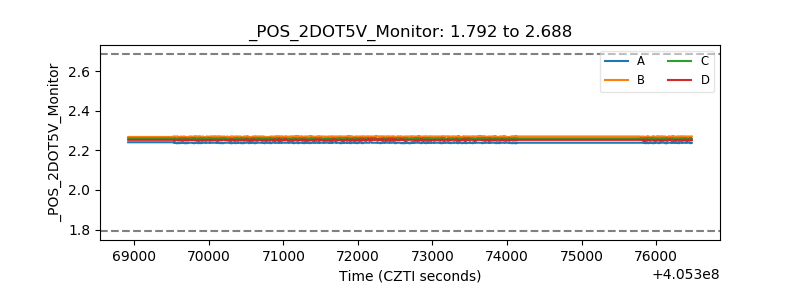 |
| +5 Volts monitor | 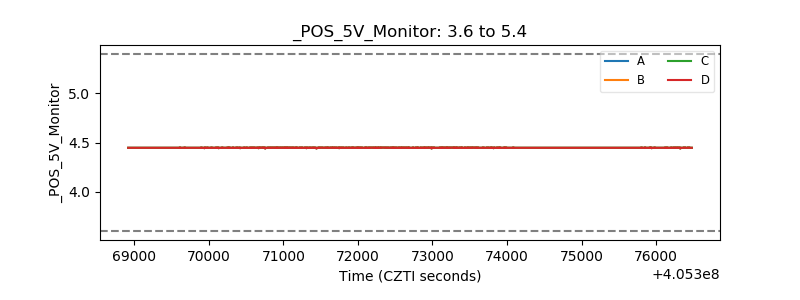 |
| _ROLL_ROT | 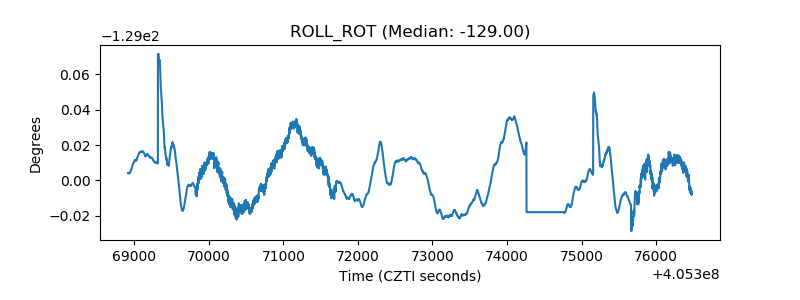 |
| _Roll_DEC | 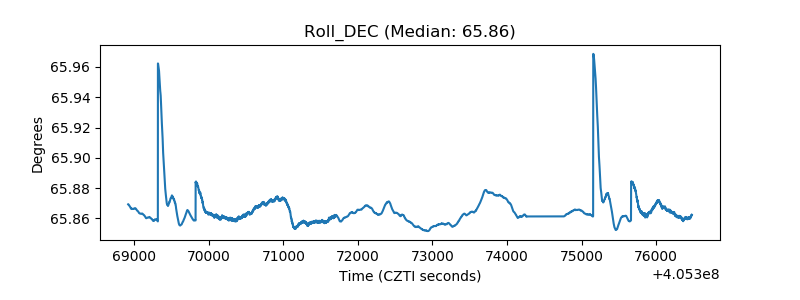 |
| _Roll_RA | 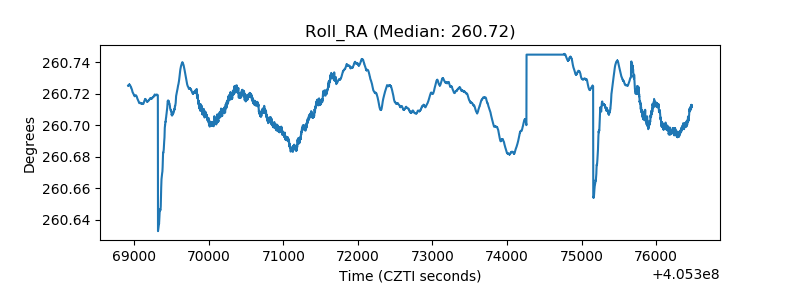 |
| Veto Counter | 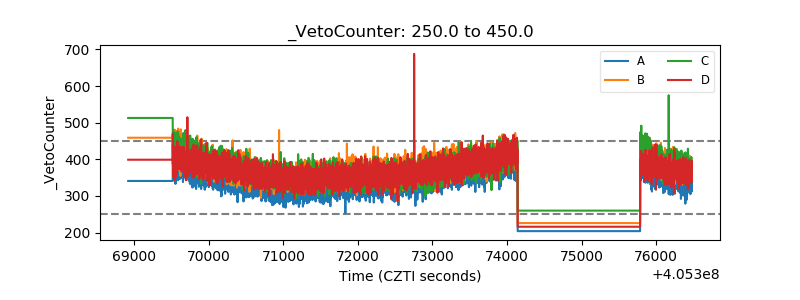 |