| Param | Original file | Final file |
|---|---|---|
| Filename | modeM0/AS1A12_018T01_9000005386_38423cztM0_level2.fits | modeM0/AS1A12_018T01_9000005386_38423cztM0_level2_quad_clean.evt |
| Size (bytes) | 382,268,160 | 98,377,920 |
| Size | 364.6 MB | 93.8 MB |
| Events in quadrant A | 3,178,948 | 661,220 |
| Events in quadrant B | 3,316,369 | 665,285 |
| Events in quadrant C | 2,837,805 | 649,998 |
| Events in quadrant D | 4,353,508 | 585,641 |
| Mode SS | |||
|---|---|---|---|
| Quadrant | BADHDUFLAG | Total packets | Discarded packets |
| A | 0 | 122 | 0 |
| B | 0 | 122 | 0 |
| C | 0 | 122 | 0 |
| D | 0 | 122 | 0 |
| Mode M9 | |||
|---|---|---|---|
| Quadrant | BADHDUFLAG | Total packets | Discarded packets |
| A | 0 | 23 | 0 |
| B | 0 | 23 | 0 |
| C | 0 | 23 | 0 |
| D | 0 | 24 | 0 |
| Mode M0 | |||
|---|---|---|---|
| Quadrant | BADHDUFLAG | Total packets | Discarded packets |
| A | 0 | 13237 | 3 |
| B | 0 | 13999 | 2 |
| C | 0 | 12195 | 2 |
| D | 0 | 17166 | 2 |
| Quadrant | Total seconds | Saturated seconds | Saturation percentage |
|---|---|---|---|
| A | 5961 | 53 | 0.889113% |
| B | 5961 | 106 | 1.778225% |
| C | 5961 | 10 | 0.167757% |
| D | 5961 | 267 | 4.479114% |
Noise dominated data is calculated using 1-second bins in cleaned event files. If a bin has >2000 counts, and if more than 50% of those come from <1% of pixels, then it is considered to be noise-dominated and hence unusable.
| Quadrant | # 1 sec bins | Bins with >0 counts | Bins with >2000 counts | High rate bins dominated by noise | Noise dominated (total time) | Noise dominated (detector-on time) | Marked lightcurve |
|---|---|---|---|---|---|---|---|
| A | 7334 | 5962 | 27 | 27 | 0.37% | 0.45% | 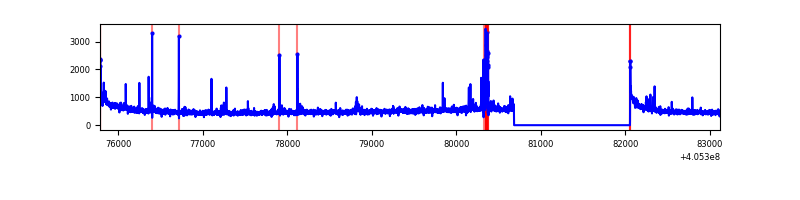 |
| B | 7334 | 5962 | 60 | 60 | 0.82% | 1.01% | 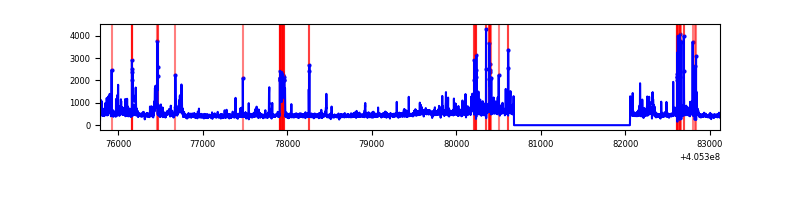 |
| C | 7334 | 5962 | 3 | 3 | 0.04% | 0.05% | 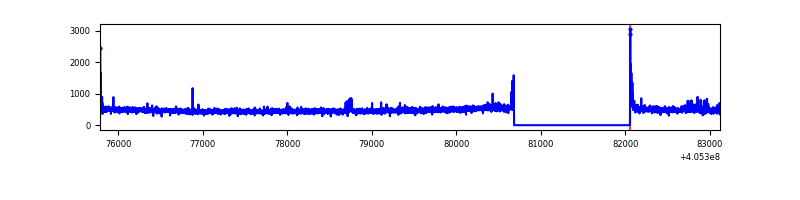 |
| D | 7334 | 5962 | 219 | 219 | 2.99% | 3.67% | 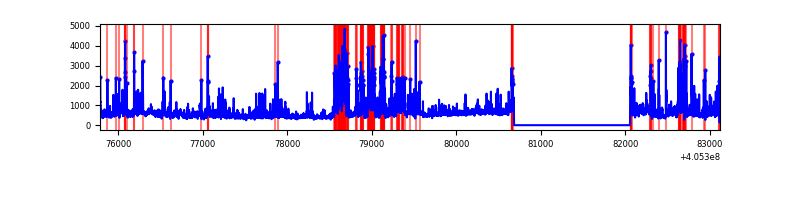 |
Top three noisy pixels from each quadrant. If the there are fewer than three noisy pixels in the level2.evt file, extra rows are filled as -1
| Pixel properties | Quadrant properties | ||||||
|---|---|---|---|---|---|---|---|
| Quadrant | DetID | PixID | Counts | Sigma | Mean | Median | Sigma |
| A | 10 | 83 | 425671 | 3214.51 | 652 | 638 | 132.2 |
| A | 9 | 143 | 129191 | 972.24 | 652 | 638 | 132.2 |
| A | 12 | 189 | 43898 | 327.17 | 652 | 638 | 132.2 |
| B | 0 | 183 | 247956 | 2000.65 | 650 | 634 | 123.6 |
| B | 8 | 3 | 127619 | 1027.21 | 650 | 634 | 123.6 |
| B | 0 | 229 | 119566 | 962.07 | 650 | 634 | 123.6 |
| C | 15 | 214 | 252069 | 1654.05 | 644 | 646 | 152.0 |
| C | 0 | 10 | 31903 | 205.63 | 644 | 646 | 152.0 |
| C | 15 | 208 | 30601 | 197.07 | 644 | 646 | 152.0 |
| D | 12 | 227 | 739262 | 4758.91 | 635 | 618 | 155.2 |
| D | 12 | 235 | 477110 | 3069.92 | 635 | 618 | 155.2 |
| D | 2 | 153 | 197991 | 1271.63 | 635 | 618 | 155.2 |
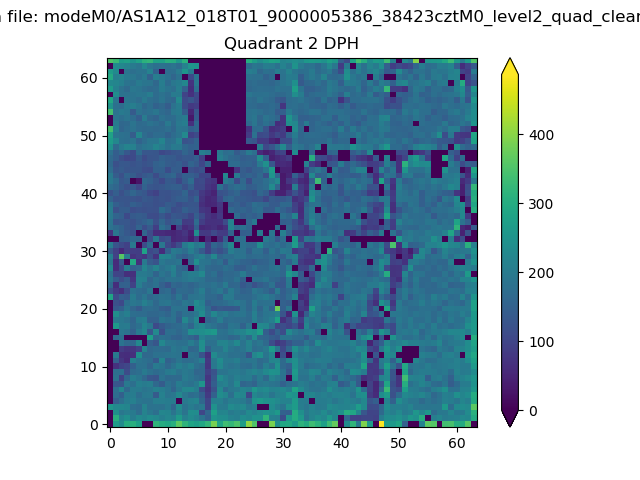
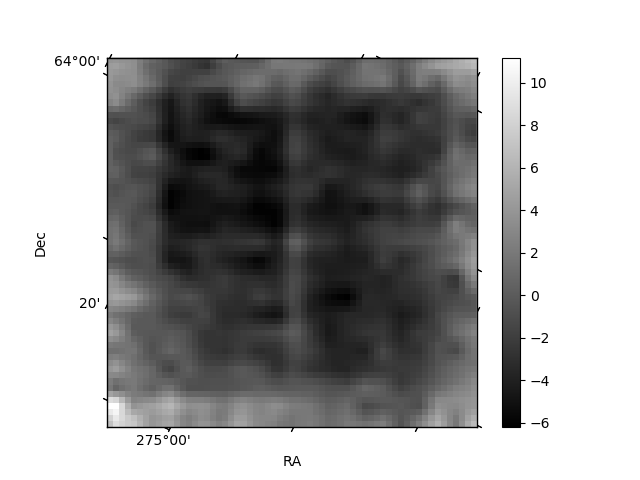
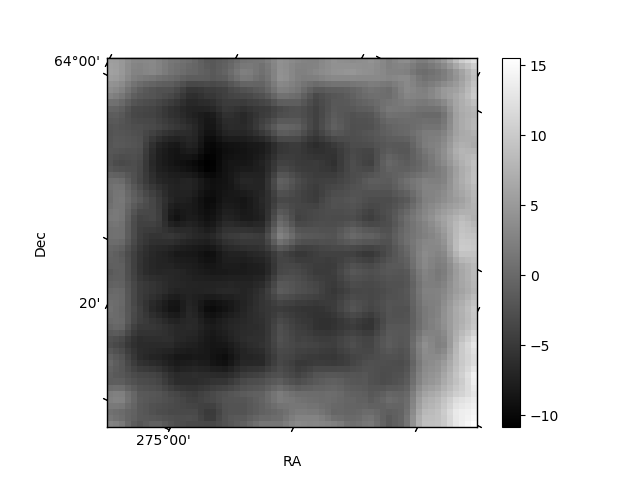
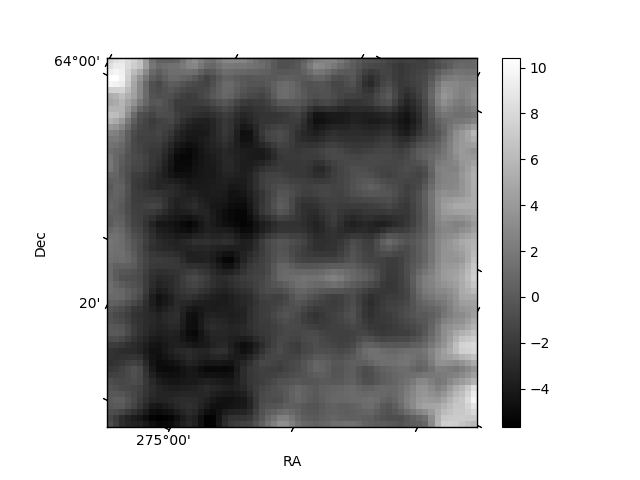
Histogram calculated using DETX and DETY for each event in the final _common_clean file
| Quadrant A |  |
 |
Quadrant B |
|---|---|---|---|
| Quadrant D | 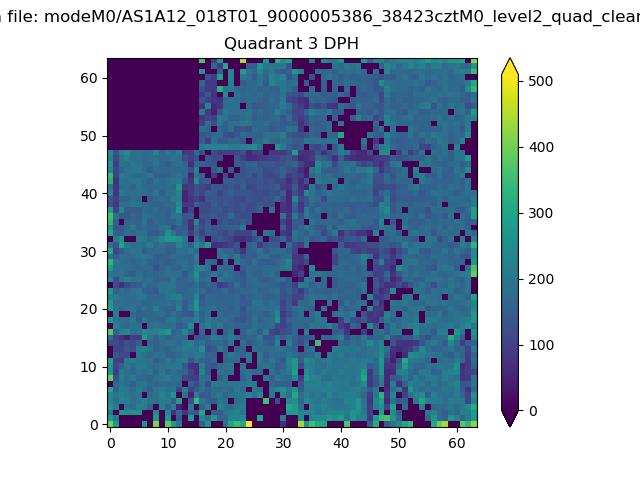 |
 |
Quadrant C |
| Plot type | Count rate plots | Images |
|---|---|---|
| Comparison with Poisson distribution Blue bars denote a histogram of data divided into 1 sec bins. Red curve is a Poisson curve with rate = median count rate of data. |
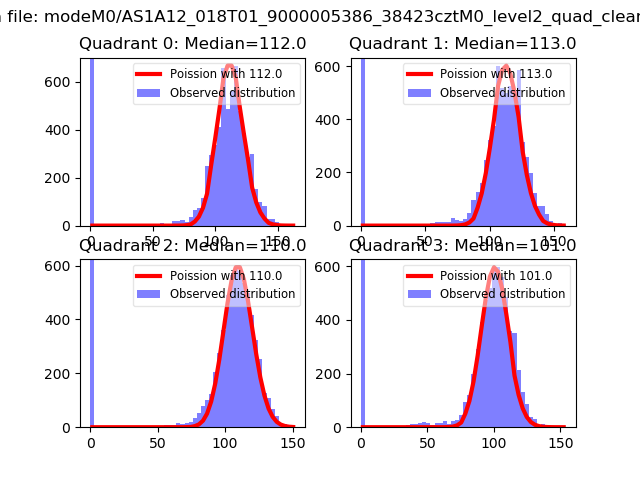 |
 |
| Quadrant-wise count rates Data is divided into 100 sec bins |
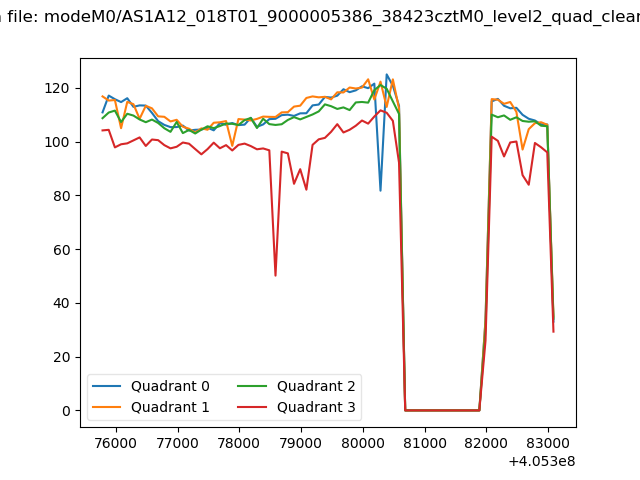 |
|
| Module-wise count rates for Quadrant A Data is divided into 100 sec bins |
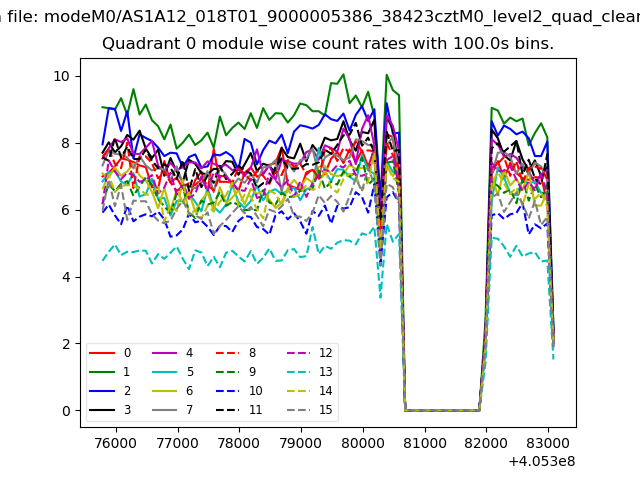 |
 |
| Module-wise count rates for Quadrant B Data is divided into 100 sec bins |
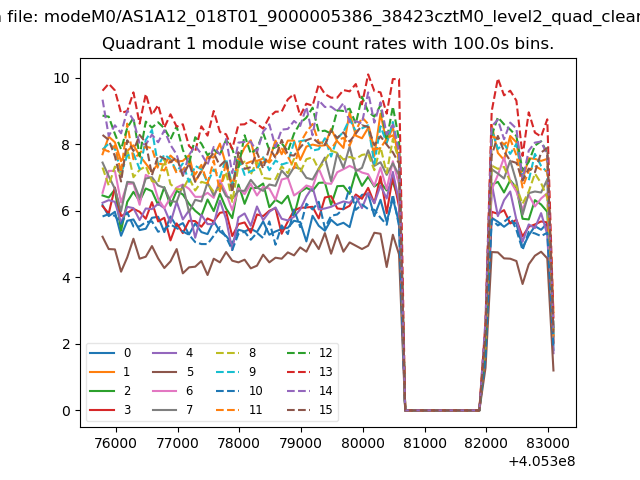 |
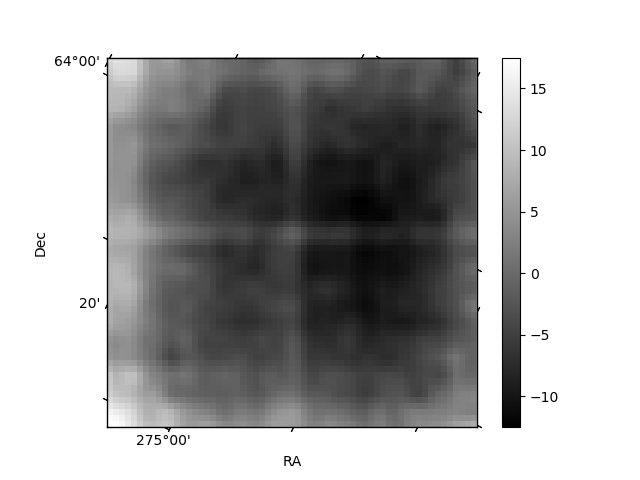 |
| Module-wise count rates for Quadrant C Data is divided into 100 sec bins |
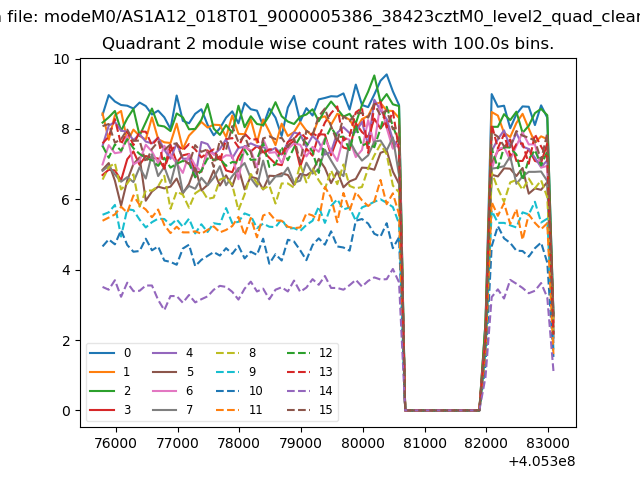 |
 |
| Module-wise count rates for Quadrant D Data is divided into 100 sec bins |
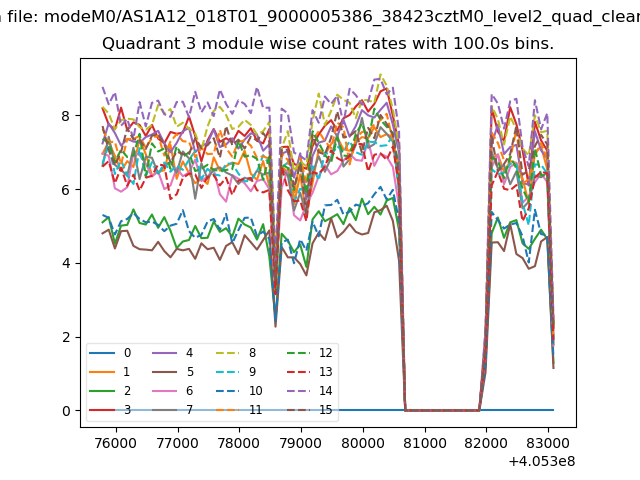 |
 |
| Parameter | Plot |
|---|---|
| CZT HV Monitor | 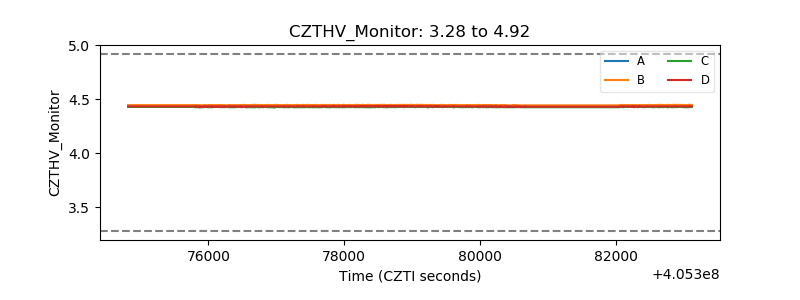 |
| D_VDD | 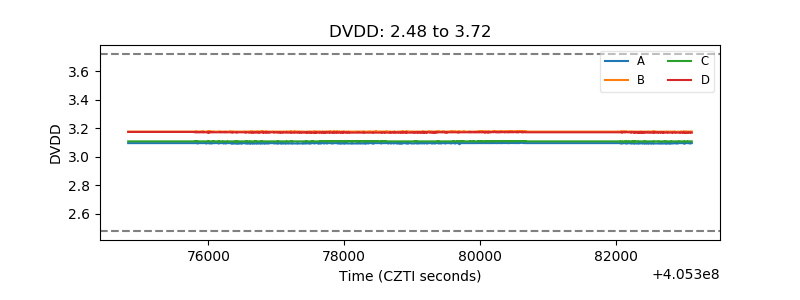 |
| Temperature 1 | 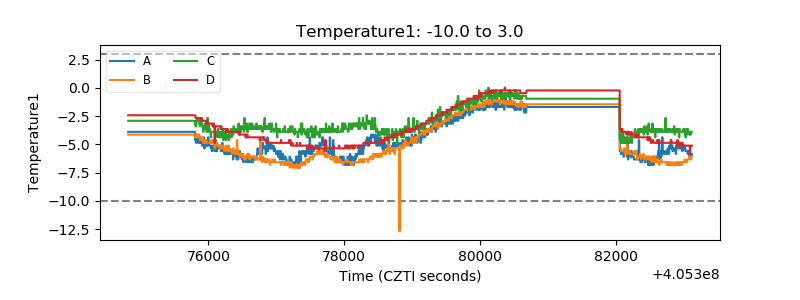 |
| Veto HV Monitor | 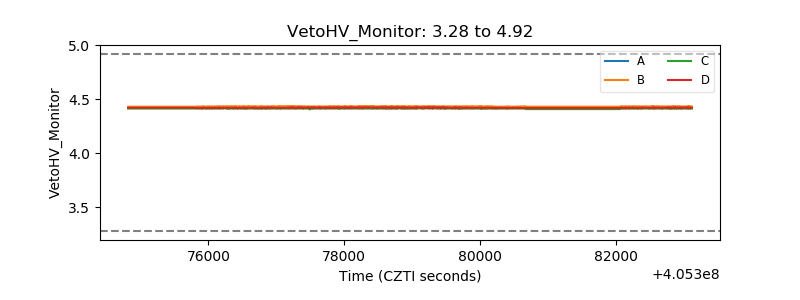 |
| Veto LLD | 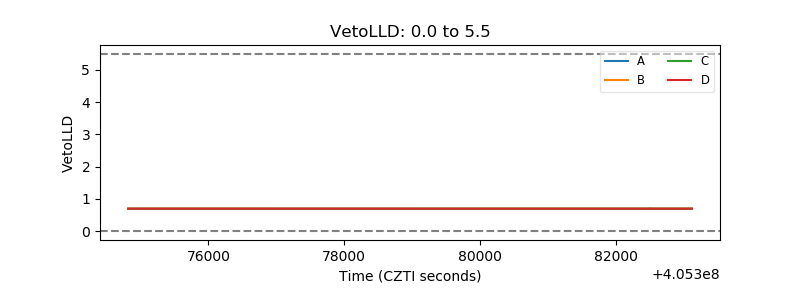 |
| Alpha Counter | 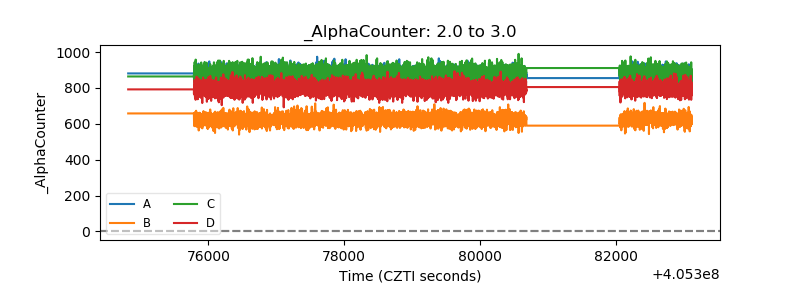 |
| _CPM_Rate | 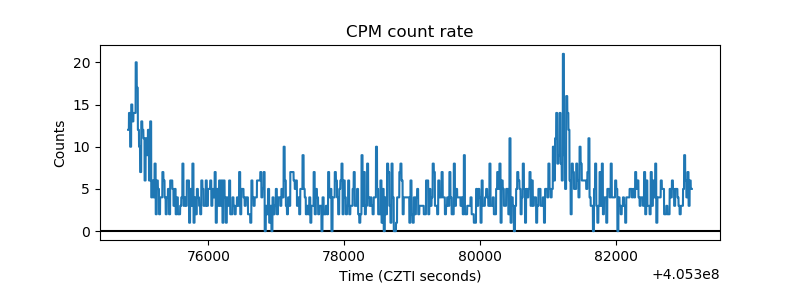 |
| CZT Counter | 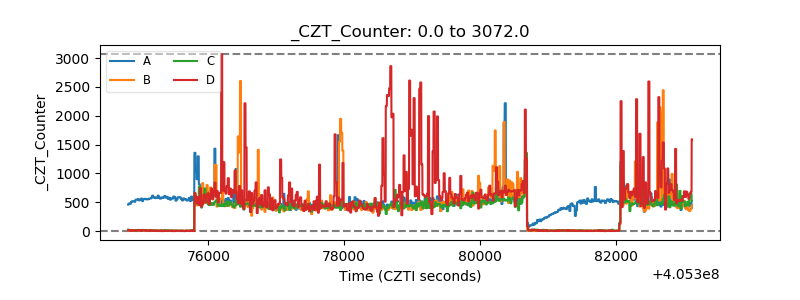 |
| +2.5 Volts monitor | 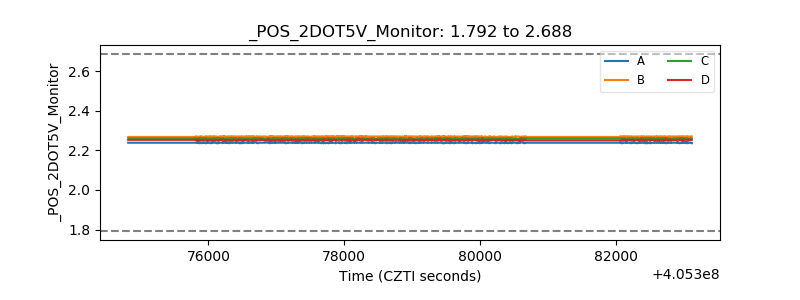 |
| +5 Volts monitor | 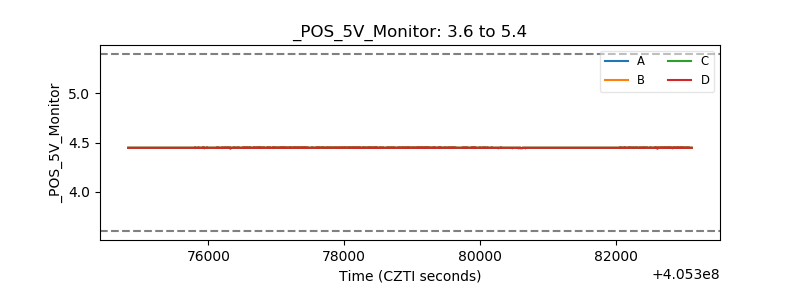 |
| _ROLL_ROT | 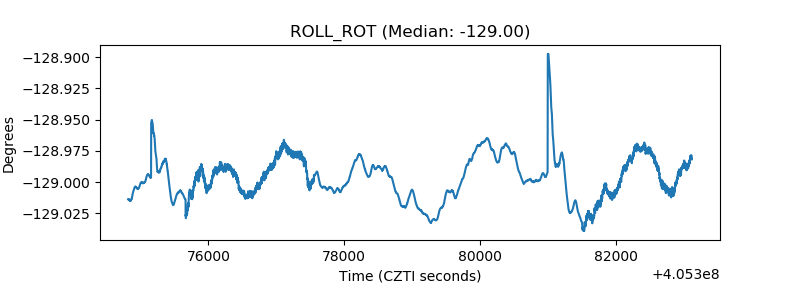 |
| _Roll_DEC |  |
| _Roll_RA | 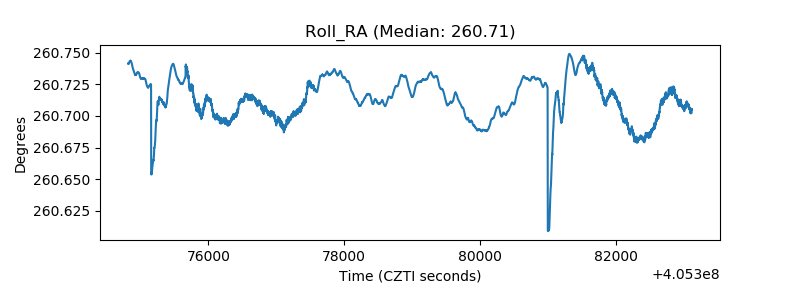 |
| Veto Counter | 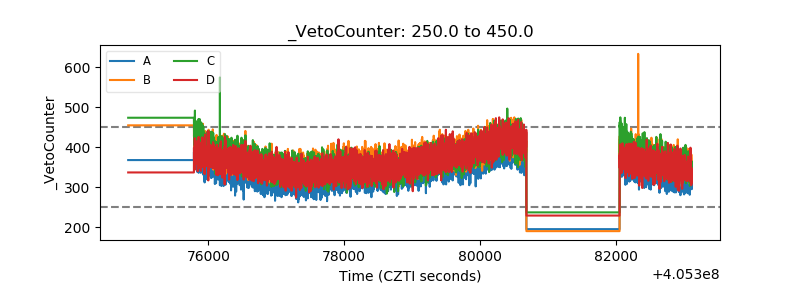 |