| Param | Original file | Final file |
|---|---|---|
| Filename | modeM0/AS1A12_018T01_9000005386_38424cztM0_level2.fits | modeM0/AS1A12_018T01_9000005386_38424cztM0_level2_quad_clean.evt |
| Size (bytes) | 406,961,280 | 99,610,560 |
| Size | 388.1 MB | 95.0 MB |
| Events in quadrant A | 3,175,363 | 673,172 |
| Events in quadrant B | 3,565,794 | 677,517 |
| Events in quadrant C | 3,040,572 | 662,407 |
| Events in quadrant D | 4,810,304 | 579,467 |
| Mode SS | |||
|---|---|---|---|
| Quadrant | BADHDUFLAG | Total packets | Discarded packets |
| A | 0 | 122 | 0 |
| B | 0 | 122 | 0 |
| C | 0 | 122 | 0 |
| D | 0 | 122 | 0 |
| Mode M9 | |||
|---|---|---|---|
| Quadrant | BADHDUFLAG | Total packets | Discarded packets |
| A | 0 | 28 | 0 |
| B | 0 | 28 | 0 |
| C | 0 | 28 | 0 |
| D | 0 | 28 | 0 |
| Mode M0 | |||
|---|---|---|---|
| Quadrant | BADHDUFLAG | Total packets | Discarded packets |
| A | 0 | 13240 | 3 |
| B | 0 | 14729 | 2 |
| C | 0 | 12817 | 2 |
| D | 0 | 18321 | 2 |
| Quadrant | Total seconds | Saturated seconds | Saturation percentage |
|---|---|---|---|
| A | 6073 | 20 | 0.329327% |
| B | 6073 | 134 | 2.206488% |
| C | 6073 | 16 | 0.263461% |
| D | 6073 | 436 | 7.179318% |
Noise dominated data is calculated using 1-second bins in cleaned event files. If a bin has >2000 counts, and if more than 50% of those come from <1% of pixels, then it is considered to be noise-dominated and hence unusable.
| Quadrant | # 1 sec bins | Bins with >0 counts | Bins with >2000 counts | High rate bins dominated by noise | Noise dominated (total time) | Noise dominated (detector-on time) | Marked lightcurve |
|---|---|---|---|---|---|---|---|
| A | 8759 | 6075 | 12 | 12 | 0.14% | 0.20% | 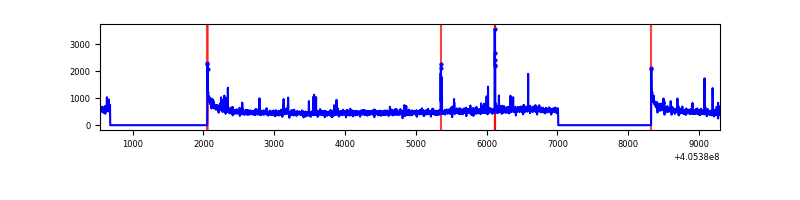 |
| B | 8759 | 6075 | 61 | 61 | 0.70% | 1.00% | 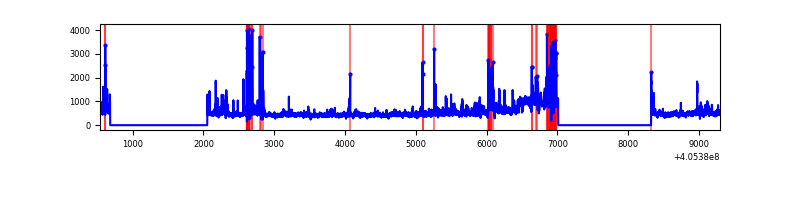 |
| C | 8759 | 6075 | 6 | 6 | 0.07% | 0.10% | 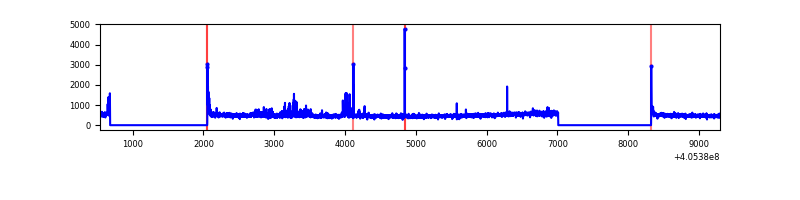 |
| D | 8759 | 6075 | 318 | 318 | 3.63% | 5.23% | 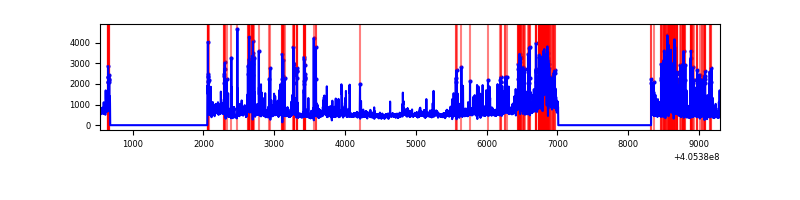 |
Top three noisy pixels from each quadrant. If the there are fewer than three noisy pixels in the level2.evt file, extra rows are filled as -1
| Pixel properties | Quadrant properties | ||||||
|---|---|---|---|---|---|---|---|
| Quadrant | DetID | PixID | Counts | Sigma | Mean | Median | Sigma |
| A | 10 | 83 | 431675 | 3137.57 | 674 | 661 | 137.4 |
| A | 9 | 143 | 75549 | 545.15 | 674 | 661 | 137.4 |
| A | 12 | 189 | 38623 | 276.34 | 674 | 661 | 137.4 |
| B | 8 | 3 | 281901 | 2209.18 | 667 | 649 | 127.3 |
| B | 0 | 183 | 180189 | 1410.25 | 667 | 649 | 127.3 |
| B | 5 | 184 | 161067 | 1260.05 | 667 | 649 | 127.3 |
| C | 15 | 214 | 256639 | 1664.79 | 660 | 663 | 153.8 |
| C | 15 | 208 | 140083 | 906.74 | 660 | 663 | 153.8 |
| C | 0 | 10 | 36687 | 234.29 | 660 | 663 | 153.8 |
| D | 2 | 250 | 862751 | 5486.15 | 642 | 624 | 157.1 |
| D | 12 | 235 | 565029 | 3591.6 | 642 | 624 | 157.1 |
| D | 13 | 249 | 361553 | 2296.77 | 642 | 624 | 157.1 |
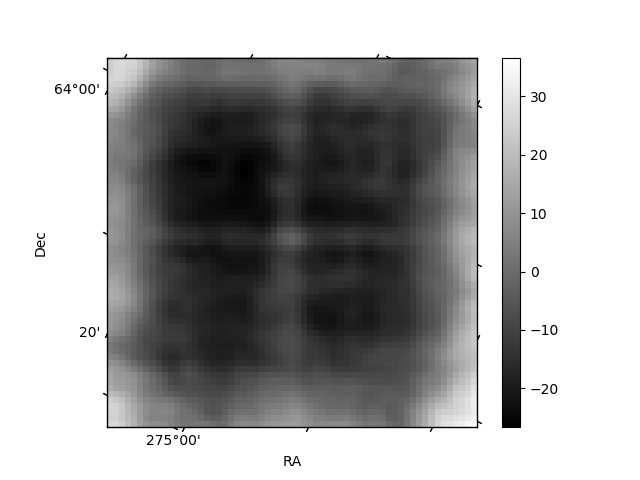
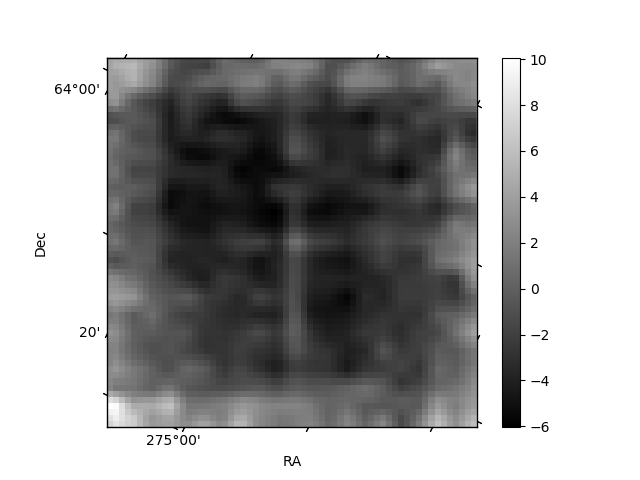
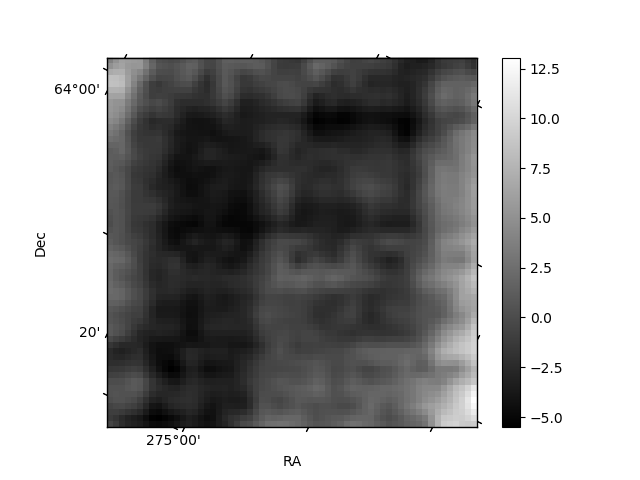
Histogram calculated using DETX and DETY for each event in the final _common_clean file
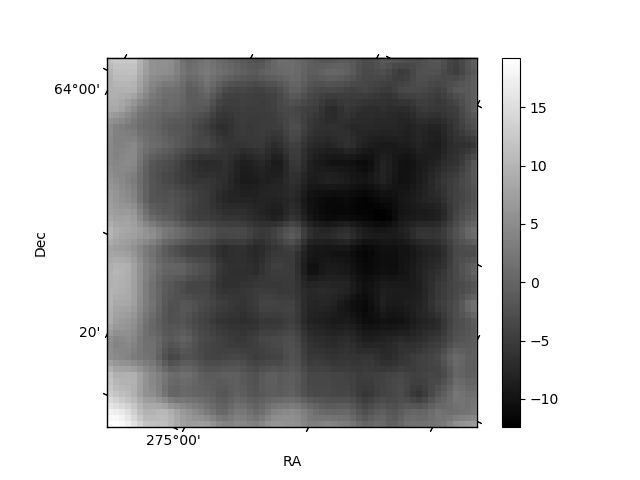
| Quadrant A | 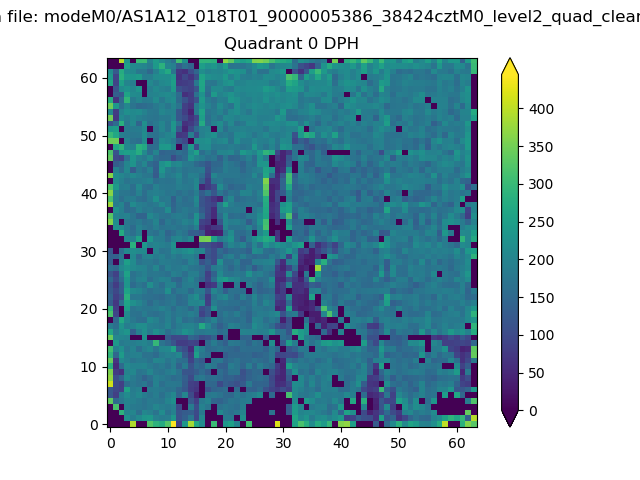 |
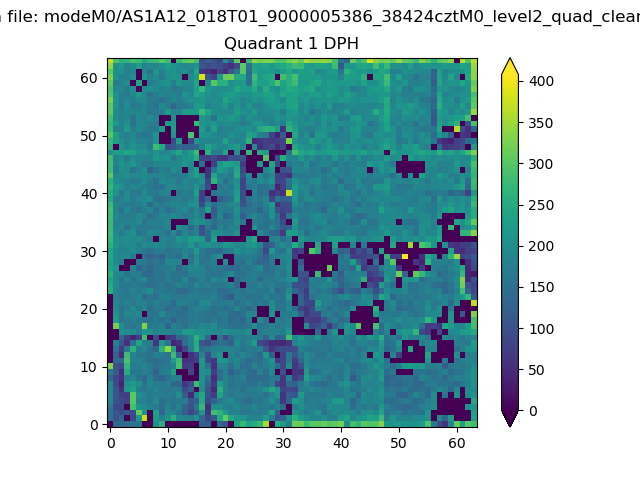 |
Quadrant B |
|---|---|---|---|
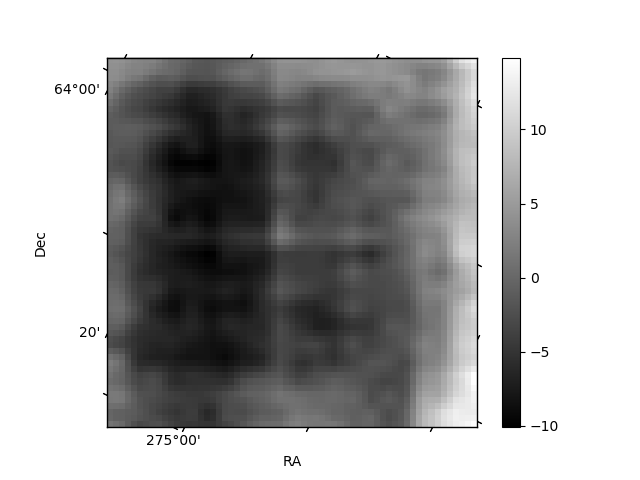
| Quadrant D |  |
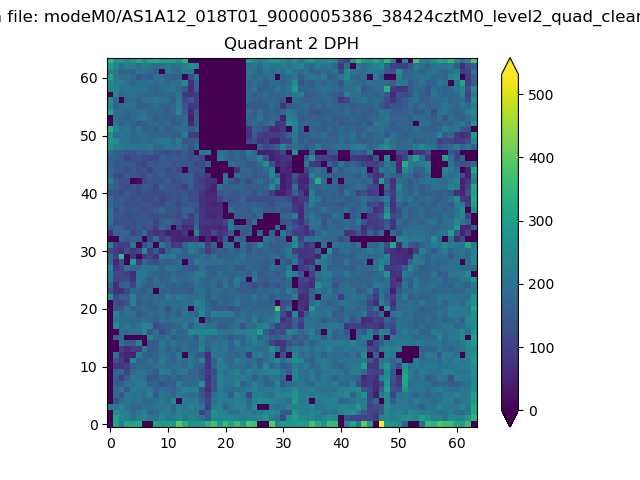 |
Quadrant C |
| Plot type | Count rate plots | Images |
|---|---|---|
| Comparison with Poisson distribution Blue bars denote a histogram of data divided into 1 sec bins. Red curve is a Poisson curve with rate = median count rate of data. |
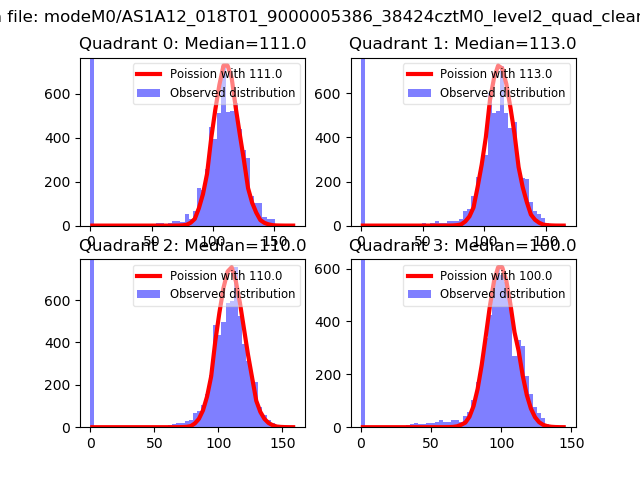 |
 |
| Quadrant-wise count rates Data is divided into 100 sec bins |
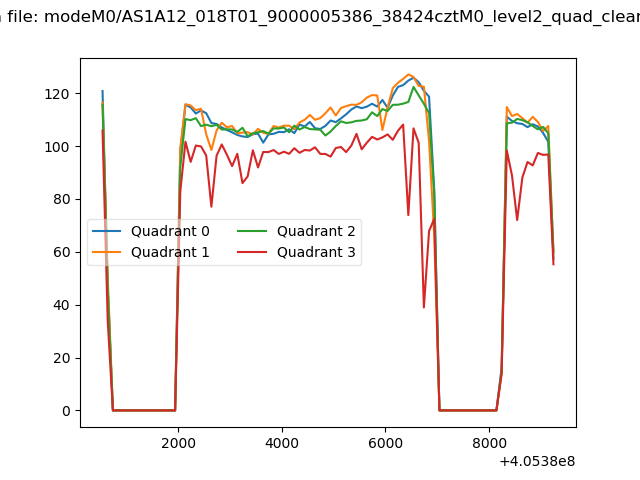 |
|
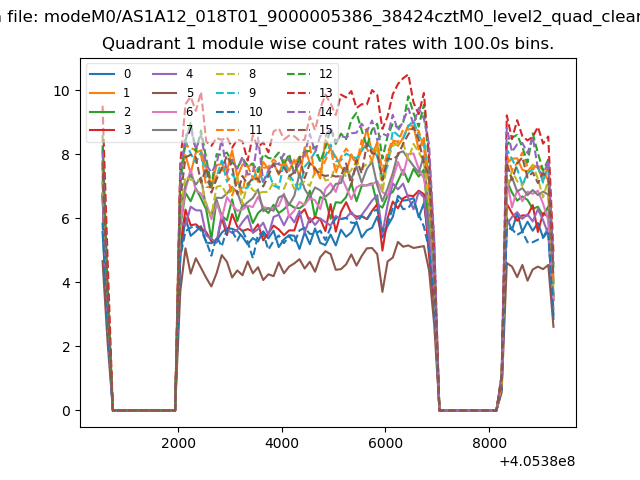
| Module-wise count rates for Quadrant A Data is divided into 100 sec bins |
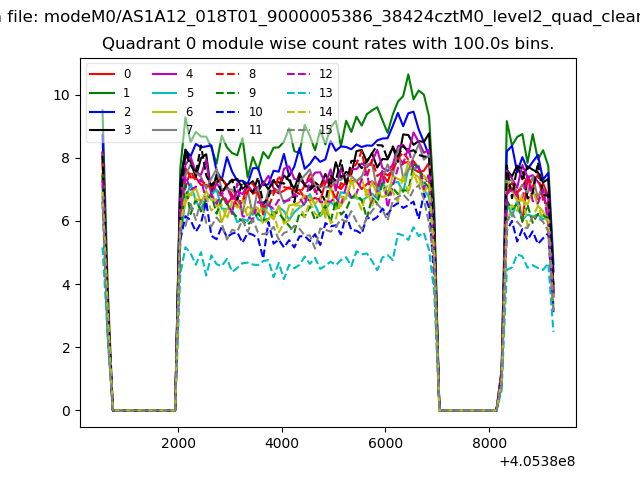 |
 |
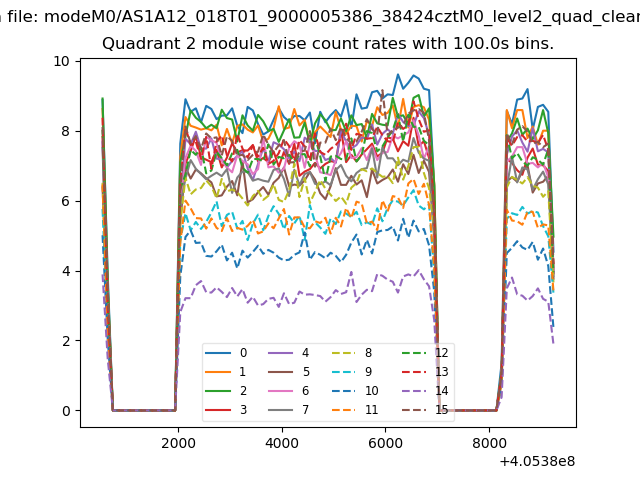
| Module-wise count rates for Quadrant B Data is divided into 100 sec bins |
 |
 |
| Module-wise count rates for Quadrant C Data is divided into 100 sec bins |
 |
 |
| Module-wise count rates for Quadrant D Data is divided into 100 sec bins |
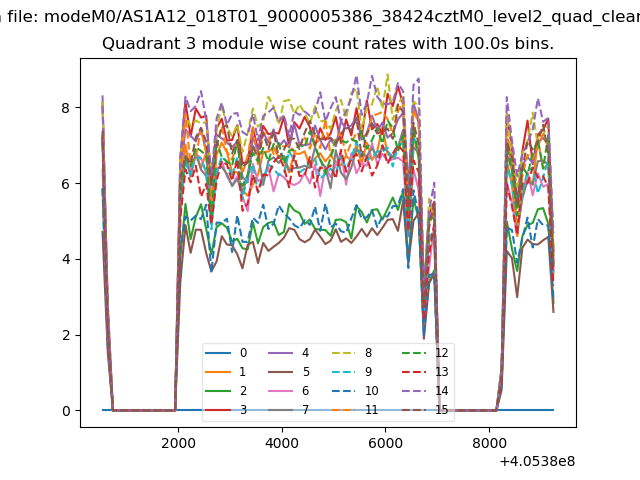 |
 |
| Parameter | Plot |
|---|---|
| CZT HV Monitor | 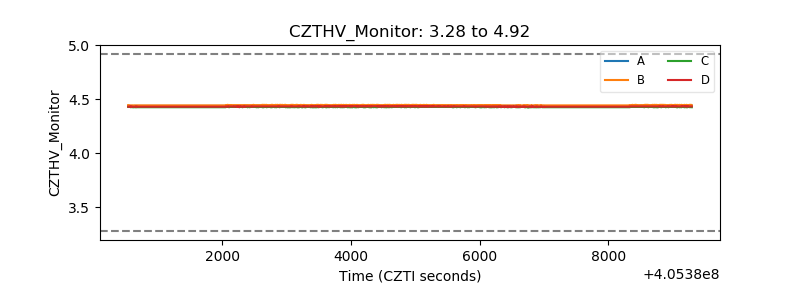 |
| D_VDD | 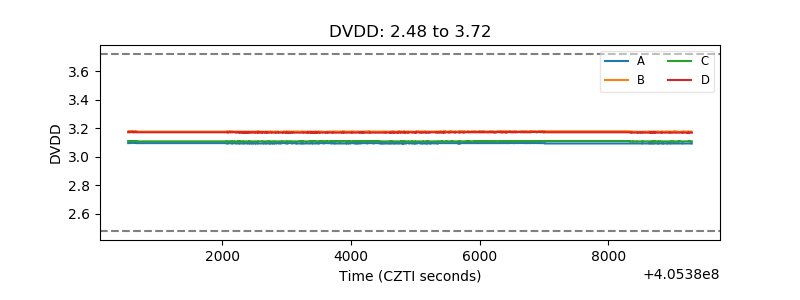 |
| Temperature 1 | 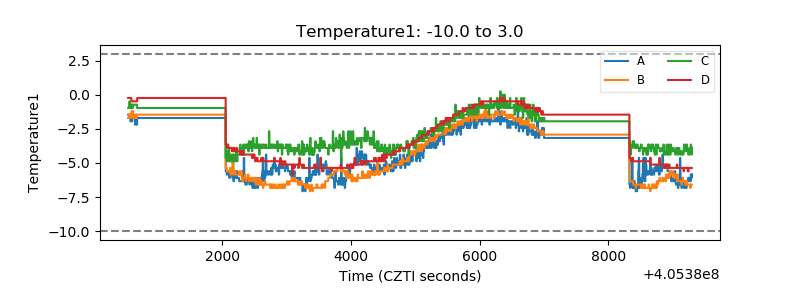 |
| Veto HV Monitor | 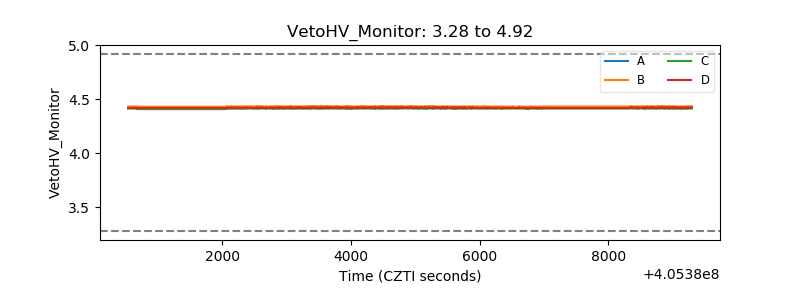 |
| Veto LLD | 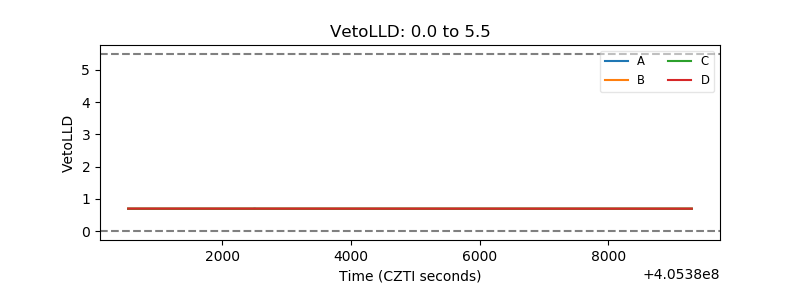 |
| Alpha Counter | 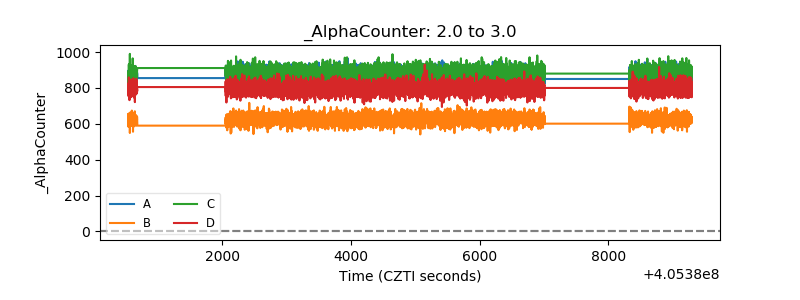 |
| _CPM_Rate | 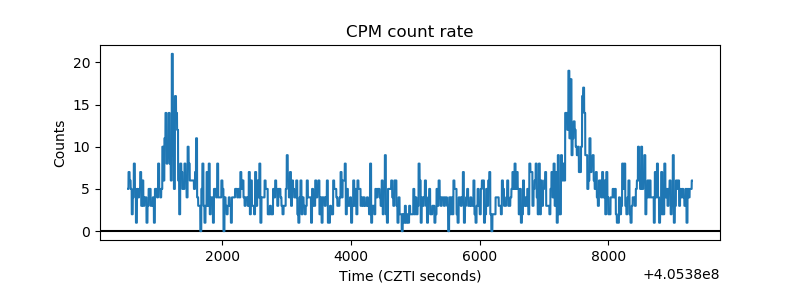 |
| CZT Counter | 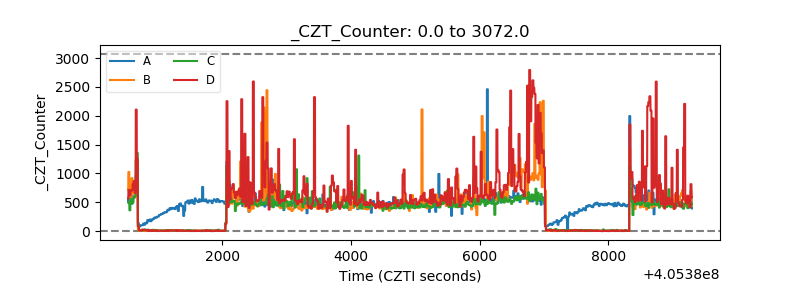 |
| +2.5 Volts monitor | 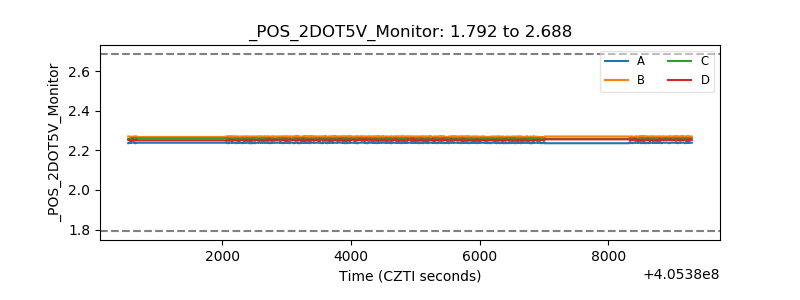 |
| +5 Volts monitor | 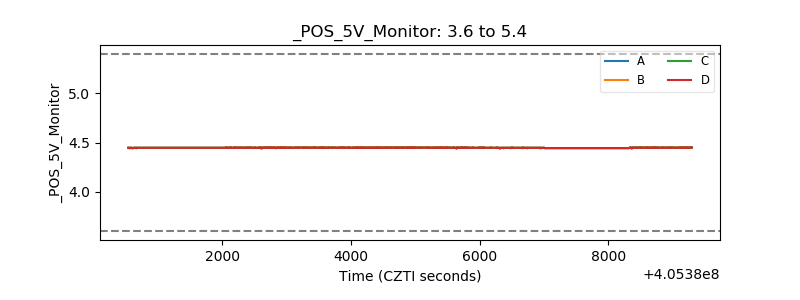 |
| _ROLL_ROT | 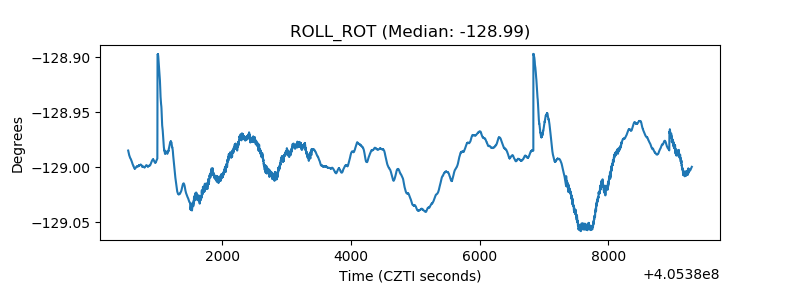 |
| _Roll_DEC | 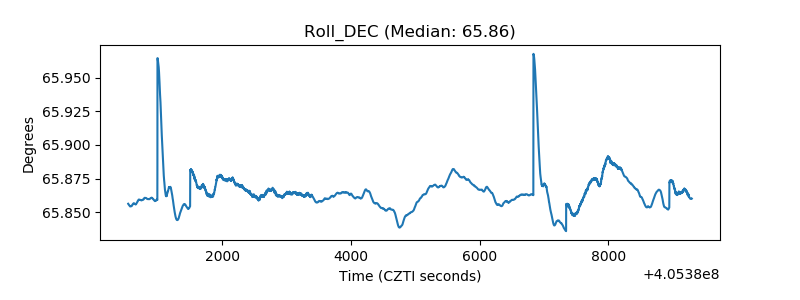 |
| _Roll_RA | 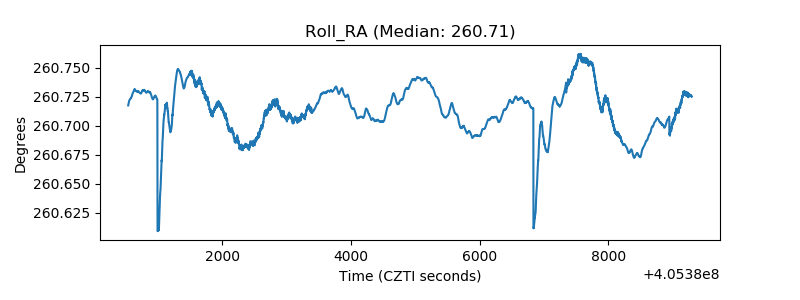 |
| Veto Counter | 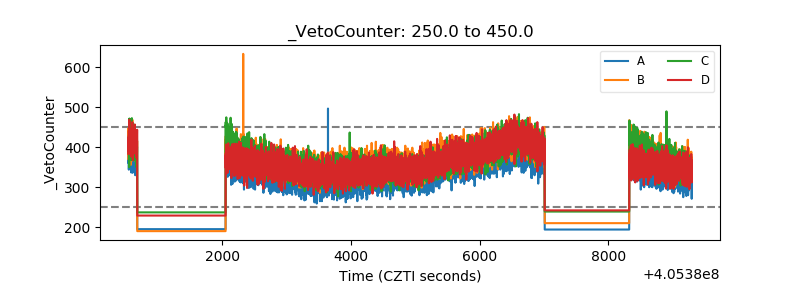 |