| Param | Original file | Final file |
|---|---|---|
| Filename | modeM0/AS1A12_018T01_9000005386_38427cztM0_level2.fits | modeM0/AS1A12_018T01_9000005386_38427cztM0_level2_quad_clean.evt |
| Size (bytes) | 981,000,000 | 249,966,720 |
| Size | 935.6 MB | 238.4 MB |
| Events in quadrant A | 8,325,930 | 1,680,534 |
| Events in quadrant B | 9,066,273 | 1,684,559 |
| Events in quadrant C | 7,330,064 | 1,656,469 |
| Events in quadrant D | 10,392,863 | 1,478,664 |
| Mode SS | |||
|---|---|---|---|
| Quadrant | BADHDUFLAG | Total packets | Discarded packets |
| A | 0 | 316 | 0 |
| B | 0 | 316 | 0 |
| C | 0 | 316 | 0 |
| D | 0 | 316 | 0 |
| Mode M9 | |||
|---|---|---|---|
| Quadrant | BADHDUFLAG | Total packets | Discarded packets |
| A | 0 | 47 | 0 |
| B | 0 | 47 | 0 |
| C | 0 | 47 | 0 |
| D | 0 | 48 | 0 |
| Mode M0 | |||
|---|---|---|---|
| Quadrant | BADHDUFLAG | Total packets | Discarded packets |
| A | 0 | 34198 | 5 |
| B | 0 | 37233 | 4 |
| C | 0 | 31593 | 4 |
| D | 0 | 41654 | 4 |
| Quadrant | Total seconds | Saturated seconds | Saturation percentage |
|---|---|---|---|
| A | 15472 | 117 | 0.756205% |
| B | 15472 | 443 | 2.863237% |
| C | 15472 | 18 | 0.116339% |
| D | 15472 | 688 | 4.446743% |
Noise dominated data is calculated using 1-second bins in cleaned event files. If a bin has >2000 counts, and if more than 50% of those come from <1% of pixels, then it is considered to be noise-dominated and hence unusable.
| Quadrant | # 1 sec bins | Bins with >0 counts | Bins with >2000 counts | High rate bins dominated by noise | Noise dominated (total time) | Noise dominated (detector-on time) | Marked lightcurve |
|---|---|---|---|---|---|---|---|
| A | 19800 | 15475 | 67 | 67 | 0.34% | 0.43% | 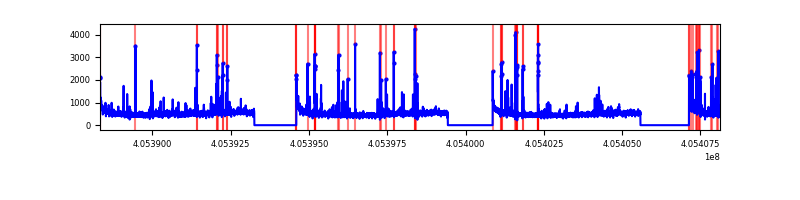 |
| B | 19800 | 15475 | 290 | 290 | 1.46% | 1.87% | 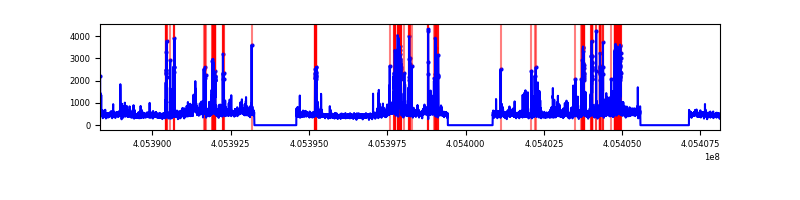 |
| C | 19800 | 15475 | 8 | 8 | 0.04% | 0.05% | 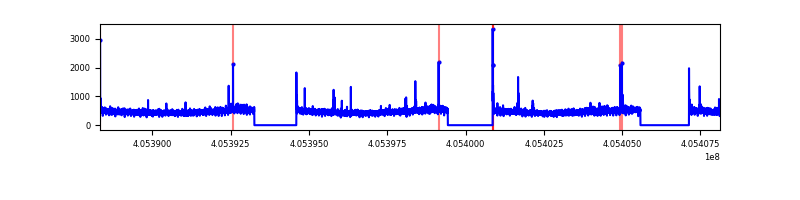 |
| D | 19800 | 15475 | 548 | 548 | 2.77% | 3.54% | 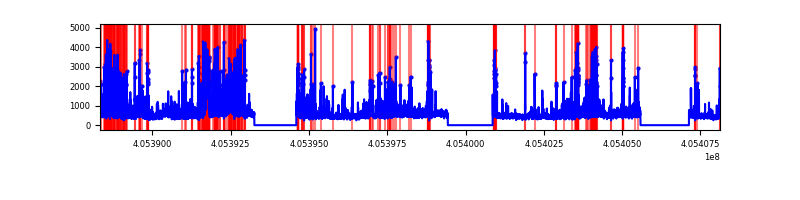 |
Top three noisy pixels from each quadrant. If the there are fewer than three noisy pixels in the level2.evt file, extra rows are filled as -1
| Pixel properties | Quadrant properties | ||||||
|---|---|---|---|---|---|---|---|
| Quadrant | DetID | PixID | Counts | Sigma | Mean | Median | Sigma |
| A | 10 | 83 | 1014850 | 2923.77 | 1725 | 1689 | 346.5 |
| A | 9 | 143 | 499277 | 1435.94 | 1725 | 1689 | 346.5 |
| A | 12 | 189 | 88813 | 251.42 | 1725 | 1689 | 346.5 |
| B | 4 | 232 | 806951 | 2509.37 | 1693 | 1649 | 320.9 |
| B | 5 | 184 | 397539 | 1233.62 | 1693 | 1649 | 320.9 |
| B | 0 | 229 | 321559 | 996.86 | 1693 | 1649 | 320.9 |
| C | 15 | 214 | 651401 | 1673.48 | 1678 | 1687 | 388.2 |
| C | 0 | 10 | 48912 | 121.64 | 1678 | 1687 | 388.2 |
| C | 15 | 159 | 34727 | 85.1 | 1678 | 1687 | 388.2 |
| D | 2 | 250 | 1848784 | 4625.66 | 1653 | 1606 | 399.3 |
| D | 12 | 235 | 472336 | 1178.79 | 1653 | 1606 | 399.3 |
| D | 2 | 153 | 388381 | 968.55 | 1653 | 1606 | 399.3 |
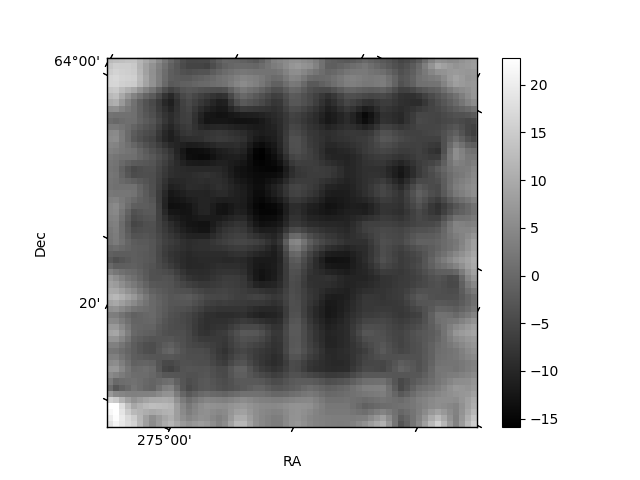
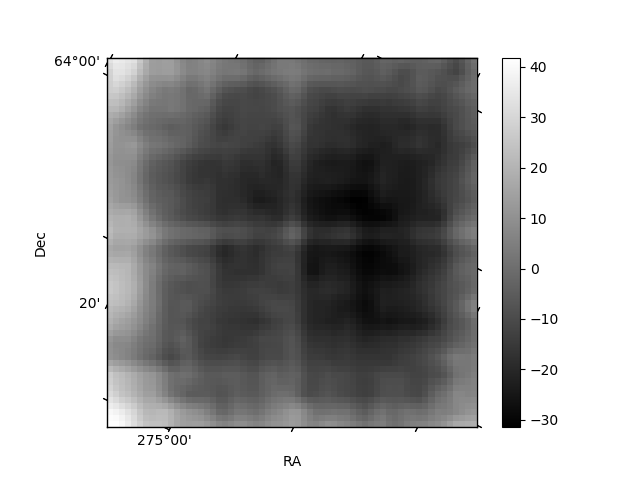
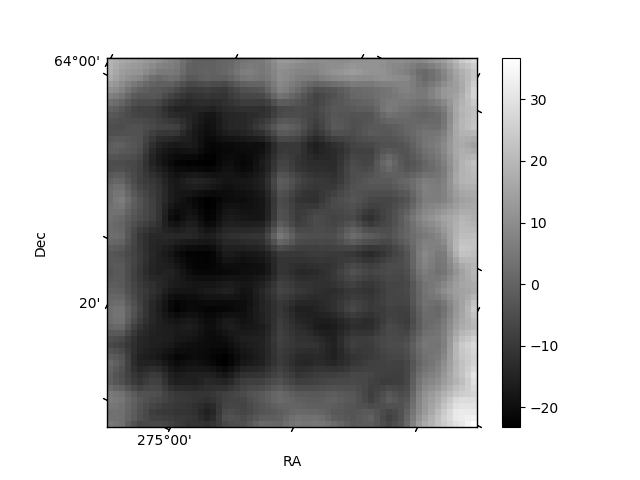
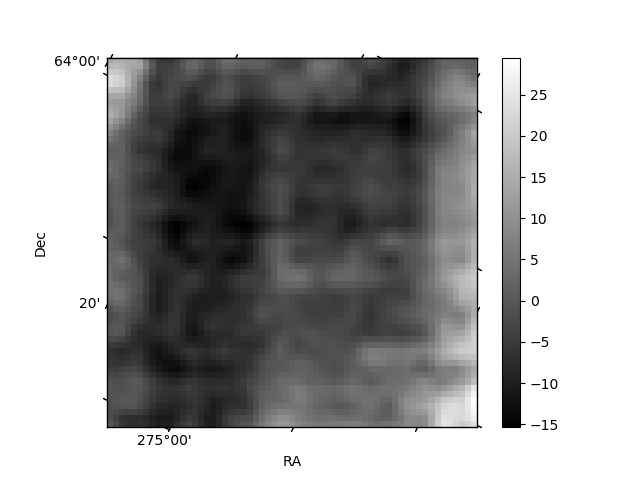
Histogram calculated using DETX and DETY for each event in the final _common_clean file
| Quadrant A | 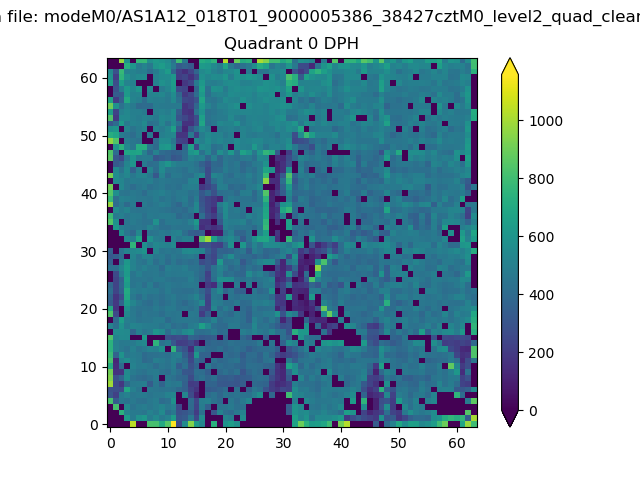 |
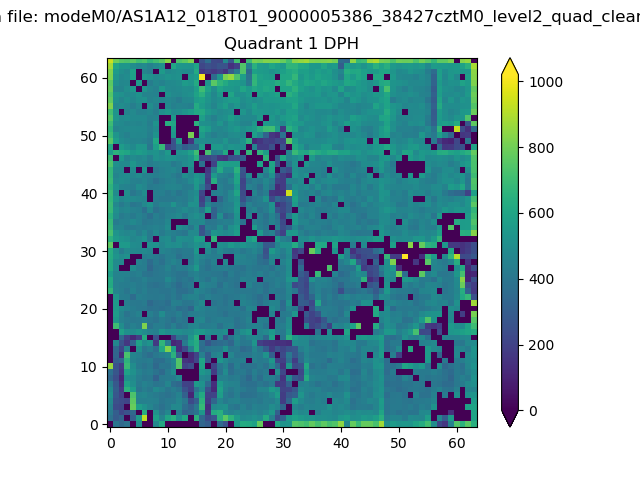 |
Quadrant B |
|---|---|---|---|
| Quadrant D | 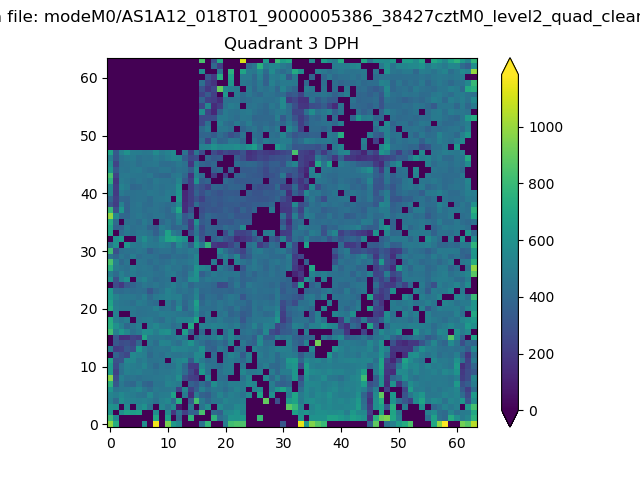 |
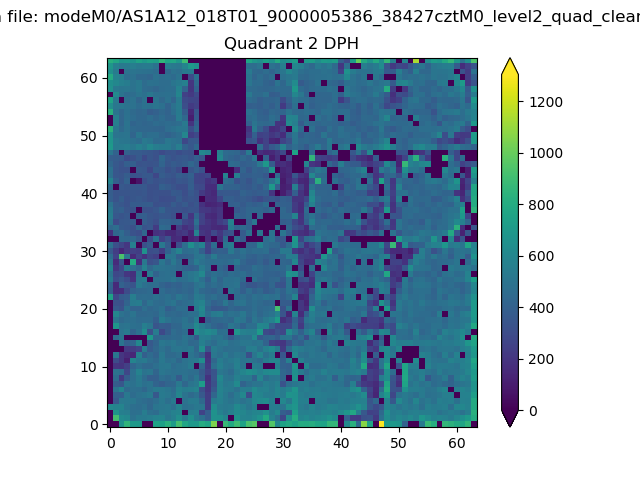 |
Quadrant C |
| Plot type | Count rate plots | Images |
|---|---|---|
| Comparison with Poisson distribution Blue bars denote a histogram of data divided into 1 sec bins. Red curve is a Poisson curve with rate = median count rate of data. |
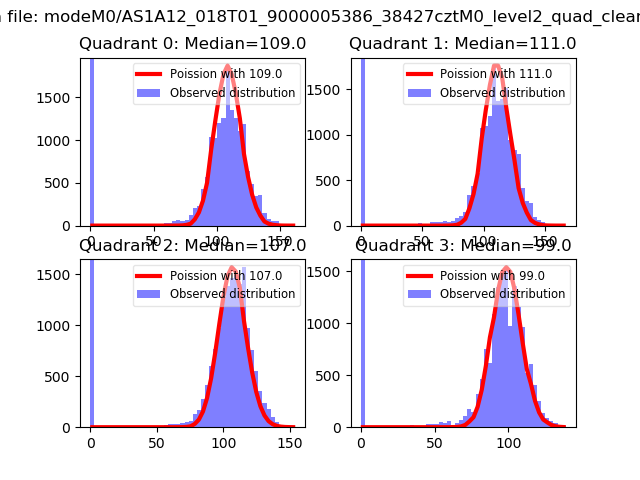 |
 |
| Quadrant-wise count rates Data is divided into 100 sec bins |
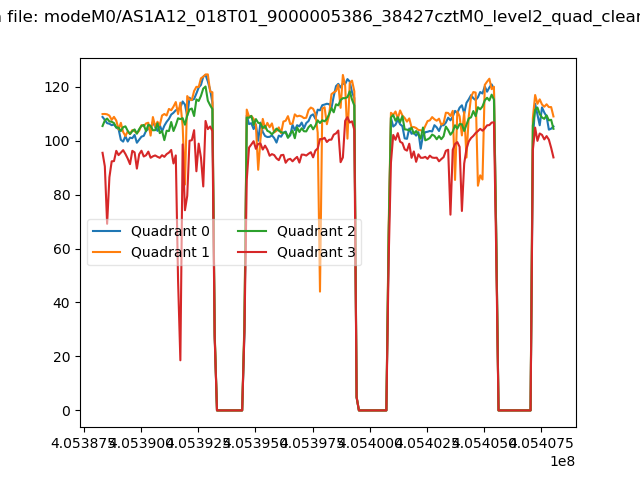 |
|
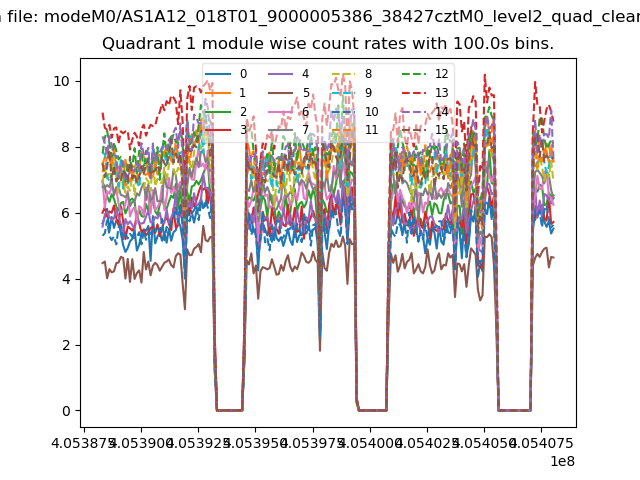
| Module-wise count rates for Quadrant A Data is divided into 100 sec bins |
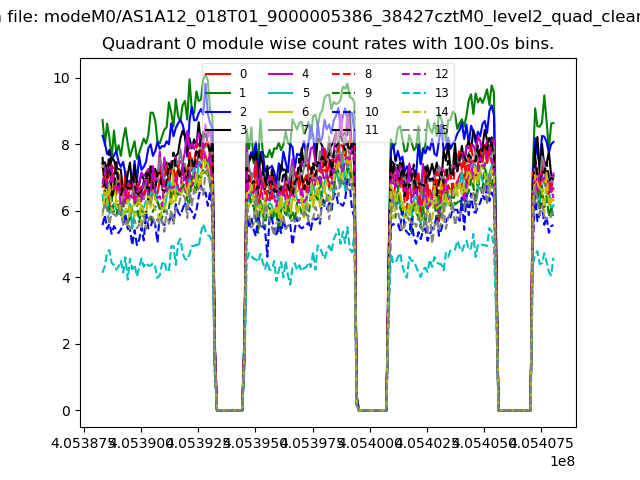 |
 |
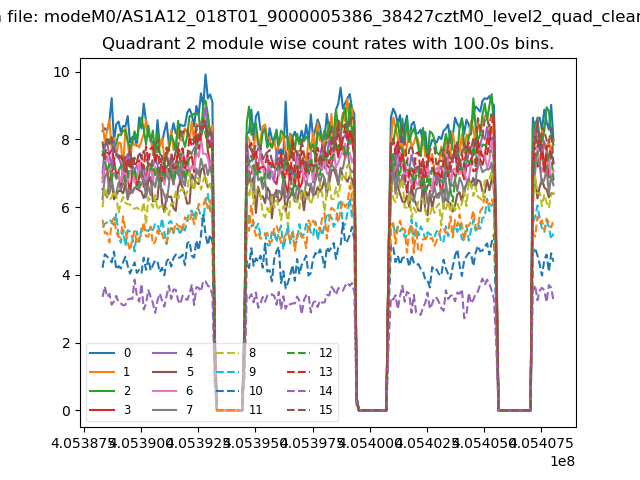
| Module-wise count rates for Quadrant B Data is divided into 100 sec bins |
 |
 |
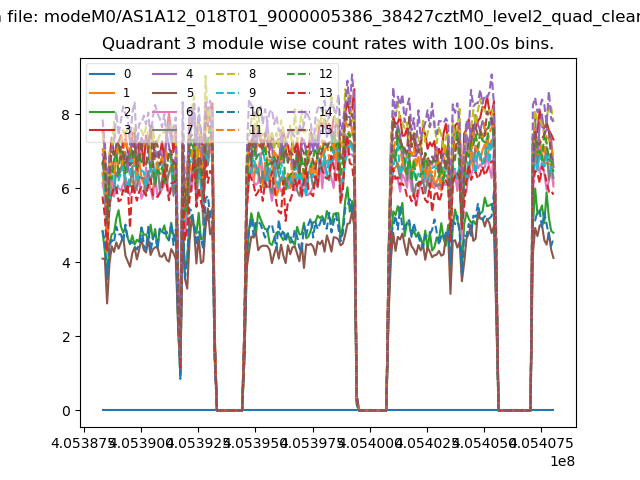
| Module-wise count rates for Quadrant C Data is divided into 100 sec bins |
 |
 |
| Module-wise count rates for Quadrant D Data is divided into 100 sec bins |
 |
 |
| Parameter | Plot |
|---|---|
| CZT HV Monitor |  |
| D_VDD | 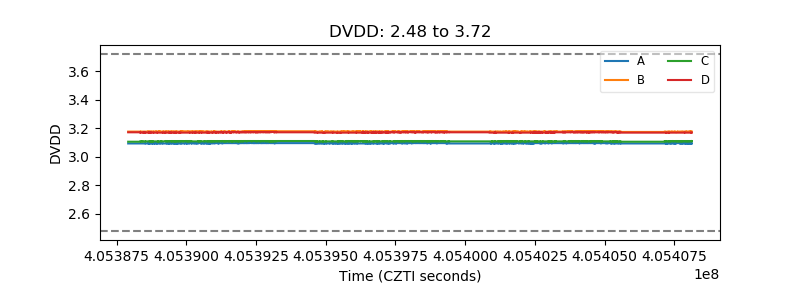 |
| Temperature 1 | 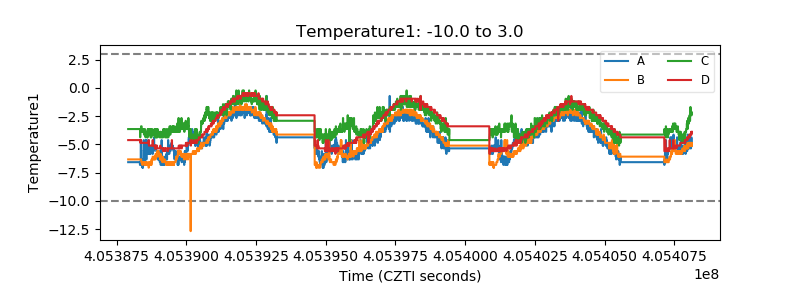 |
| Veto HV Monitor | 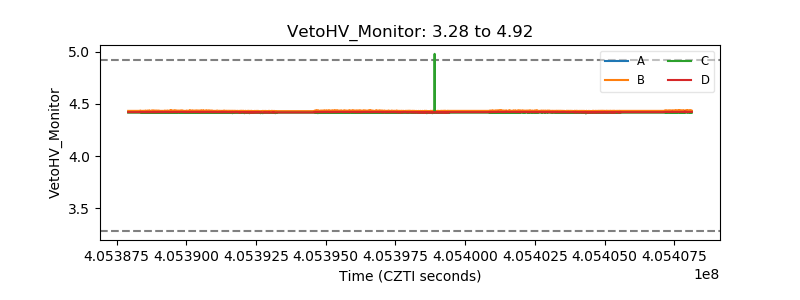 |
| Veto LLD | 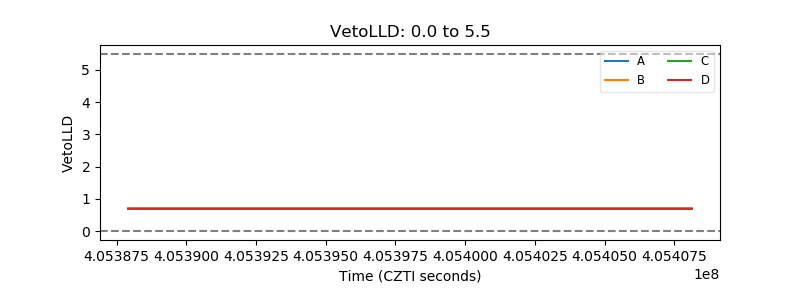 |
| Alpha Counter | 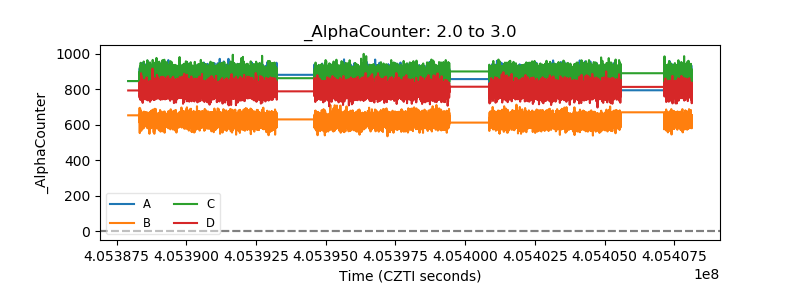 |
| _CPM_Rate | 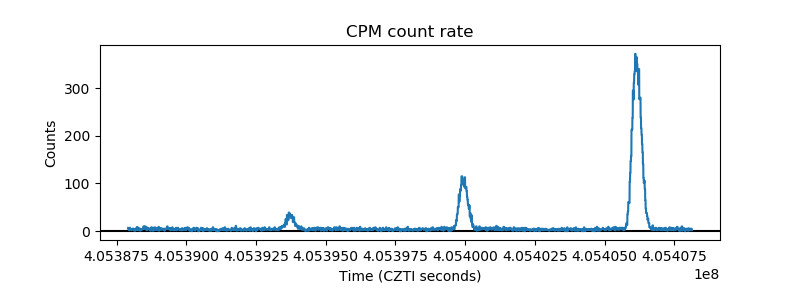 |
| CZT Counter | 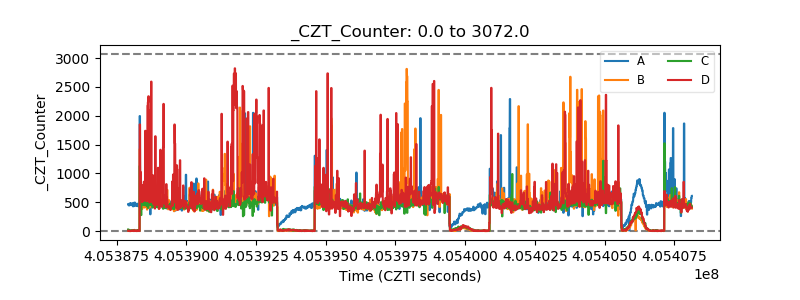 |
| +2.5 Volts monitor | 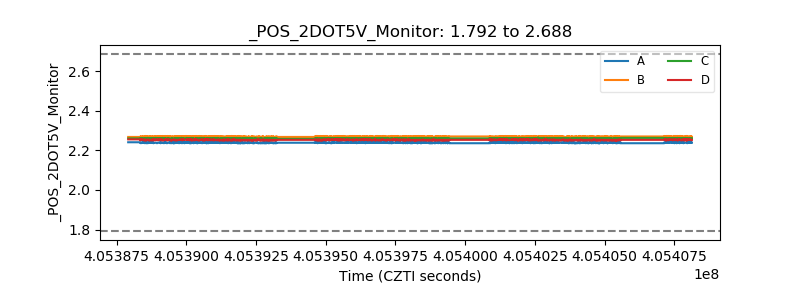 |
| +5 Volts monitor | 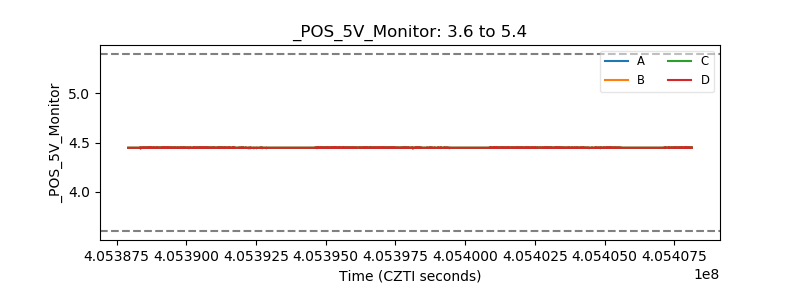 |
| _ROLL_ROT | 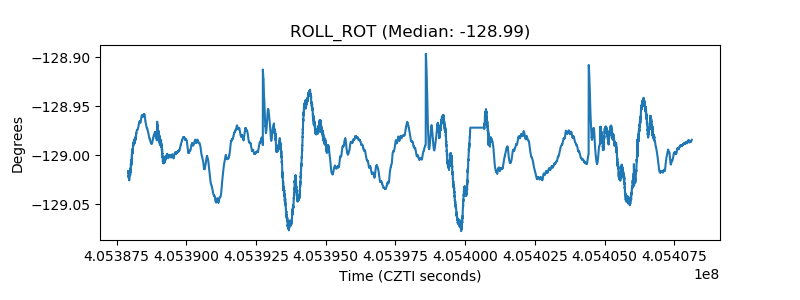 |
| _Roll_DEC | 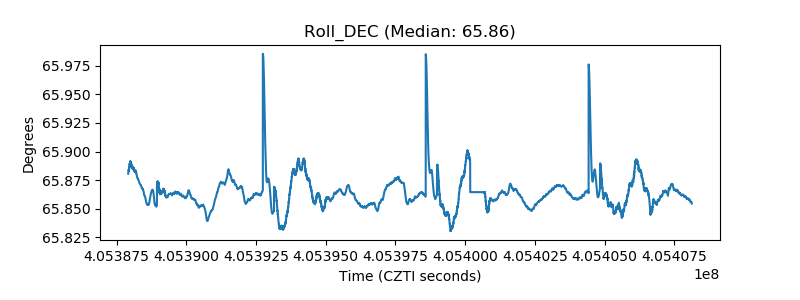 |
| _Roll_RA | 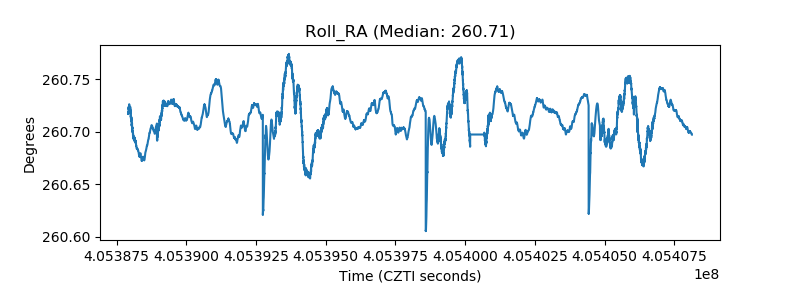 |
| Veto Counter | 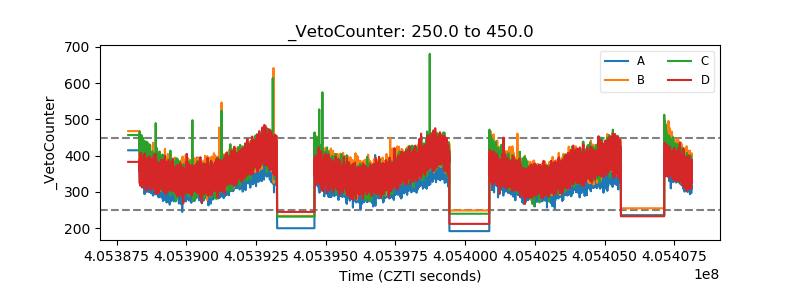 |