| Param | Original file | Final file |
|---|---|---|
| Filename | modeM0/AS1A12_018T01_9000005386_38428cztM0_level2.fits | modeM0/AS1A12_018T01_9000005386_38428cztM0_level2_quad_clean.evt |
| Size (bytes) | 344,914,560 | 92,036,160 |
| Size | 328.9 MB | 87.8 MB |
| Events in quadrant A | 3,181,284 | 620,455 |
| Events in quadrant B | 3,158,709 | 622,324 |
| Events in quadrant C | 2,705,528 | 605,125 |
| Events in quadrant D | 3,293,975 | 554,141 |
| Mode SS | |||
|---|---|---|---|
| Quadrant | BADHDUFLAG | Total packets | Discarded packets |
| A | 0 | 112 | 0 |
| B | 0 | 112 | 0 |
| C | 0 | 112 | 0 |
| D | 0 | 112 | 0 |
| Mode M9 | |||
|---|---|---|---|
| Quadrant | BADHDUFLAG | Total packets | Discarded packets |
| A | 0 | 19 | 0 |
| B | 0 | 19 | 0 |
| C | 0 | 19 | 0 |
| D | 0 | 20 | 0 |
| Mode M0 | |||
|---|---|---|---|
| Quadrant | BADHDUFLAG | Total packets | Discarded packets |
| A | 0 | 12834 | 3 |
| B | 0 | 12916 | 2 |
| C | 0 | 11515 | 2 |
| D | 0 | 13529 | 2 |
| Quadrant | Total seconds | Saturated seconds | Saturation percentage |
|---|---|---|---|
| A | 5496 | 91 | 1.655750% |
| B | 5496 | 195 | 3.548035% |
| C | 5496 | 12 | 0.218341% |
| D | 5496 | 117 | 2.128821% |
Noise dominated data is calculated using 1-second bins in cleaned event files. If a bin has >2000 counts, and if more than 50% of those come from <1% of pixels, then it is considered to be noise-dominated and hence unusable.
| Quadrant | # 1 sec bins | Bins with >0 counts | Bins with >2000 counts | High rate bins dominated by noise | Noise dominated (total time) | Noise dominated (detector-on time) | Marked lightcurve |
|---|---|---|---|---|---|---|---|
| A | 7138 | 5497 | 59 | 59 | 0.83% | 1.07% | 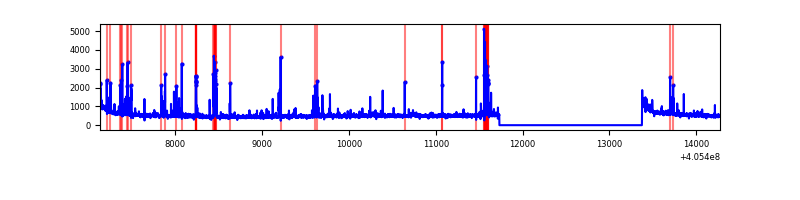 |
| B | 7138 | 5497 | 119 | 119 | 1.67% | 2.16% | 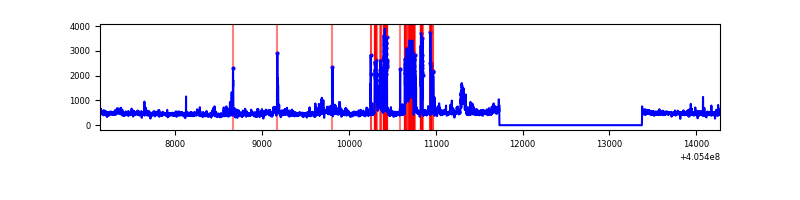 |
| C | 7138 | 5497 | 6 | 6 | 0.08% | 0.11% | 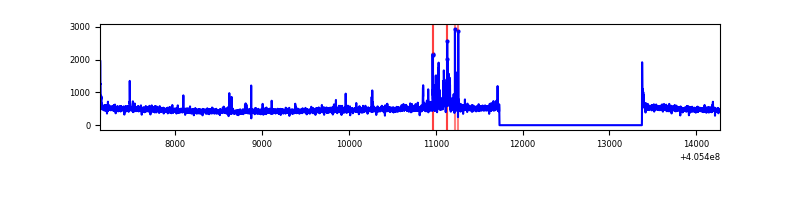 |
| D | 7138 | 5497 | 71 | 71 | 0.99% | 1.29% | 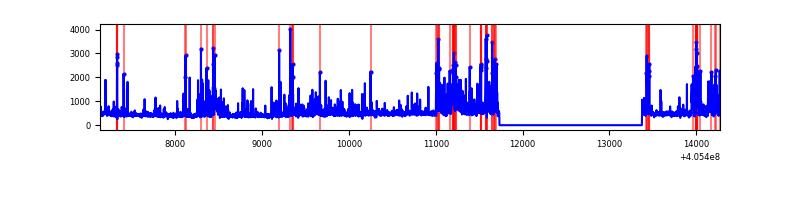 |
Top three noisy pixels from each quadrant. If the there are fewer than three noisy pixels in the level2.evt file, extra rows are filled as -1
| Pixel properties | Quadrant properties | ||||||
|---|---|---|---|---|---|---|---|
| Quadrant | DetID | PixID | Counts | Sigma | Mean | Median | Sigma |
| A | 10 | 83 | 409221 | 3264.0 | 616 | 603 | 125.2 |
| A | 9 | 143 | 349787 | 2789.24 | 616 | 603 | 125.2 |
| A | 12 | 189 | 18961 | 146.64 | 616 | 603 | 125.2 |
| B | 5 | 184 | 273274 | 2337.24 | 606 | 590 | 116.7 |
| B | 4 | 232 | 201053 | 1718.21 | 606 | 590 | 116.7 |
| B | 0 | 183 | 170794 | 1458.86 | 606 | 590 | 116.7 |
| C | 15 | 214 | 236063 | 1698.24 | 595 | 597 | 138.7 |
| C | 15 | 159 | 88660 | 635.13 | 595 | 597 | 138.7 |
| C | 14 | 254 | 36468 | 258.71 | 595 | 597 | 138.7 |
| D | 2 | 250 | 440087 | 3079.29 | 595 | 578 | 142.7 |
| D | 2 | 153 | 255189 | 1783.86 | 595 | 578 | 142.7 |
| D | 12 | 235 | 87215 | 607.0 | 595 | 578 | 142.7 |
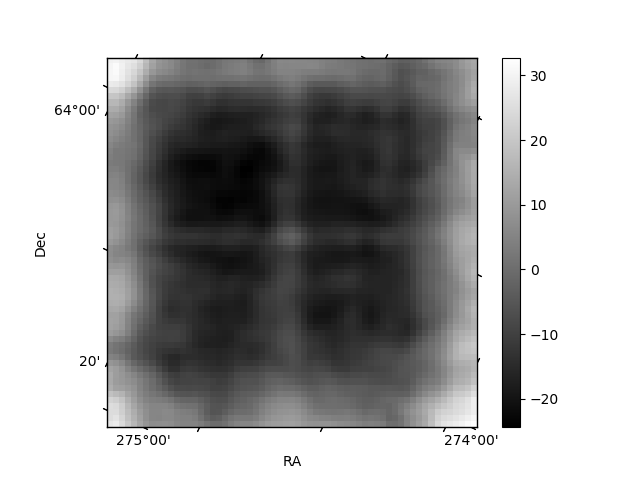
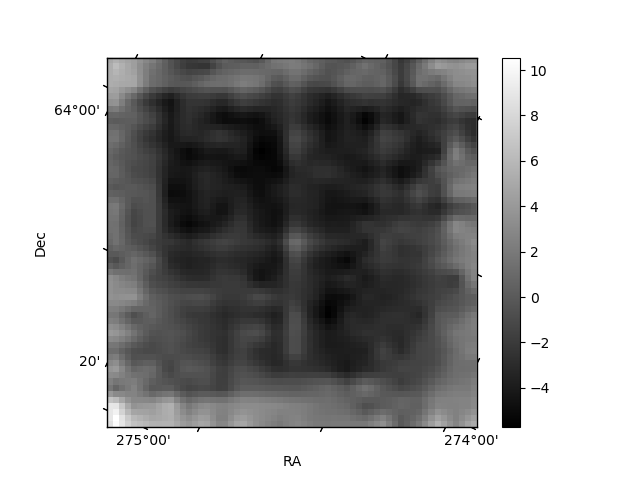
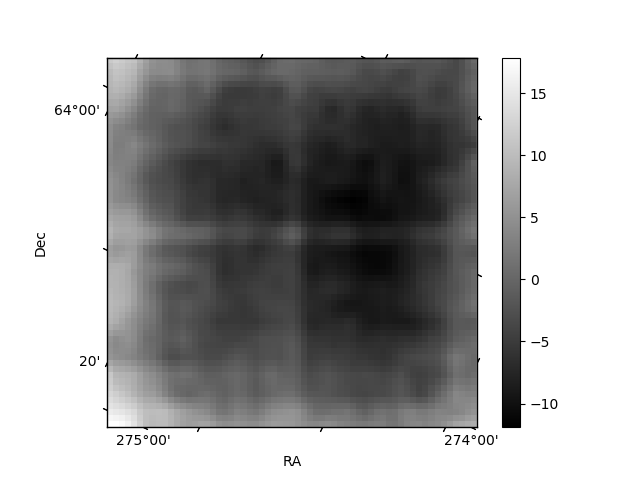
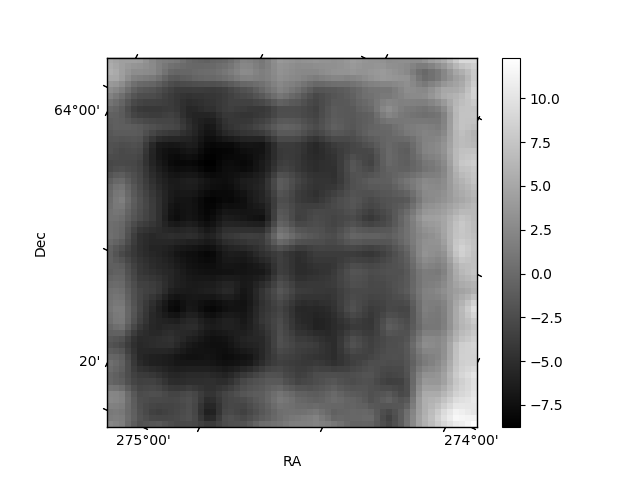
Histogram calculated using DETX and DETY for each event in the final _common_clean file
| Quadrant A | 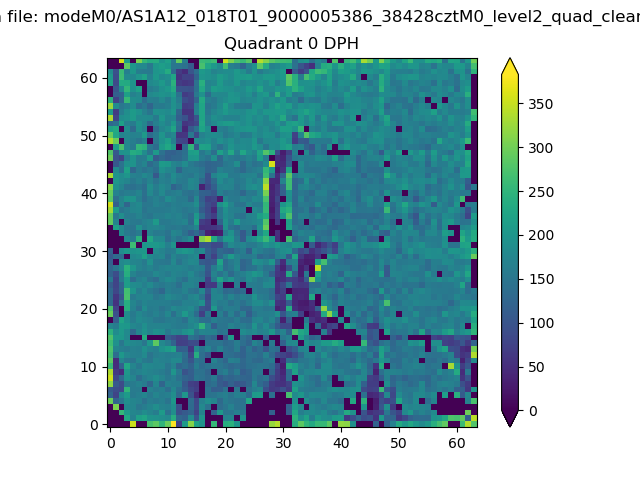 |
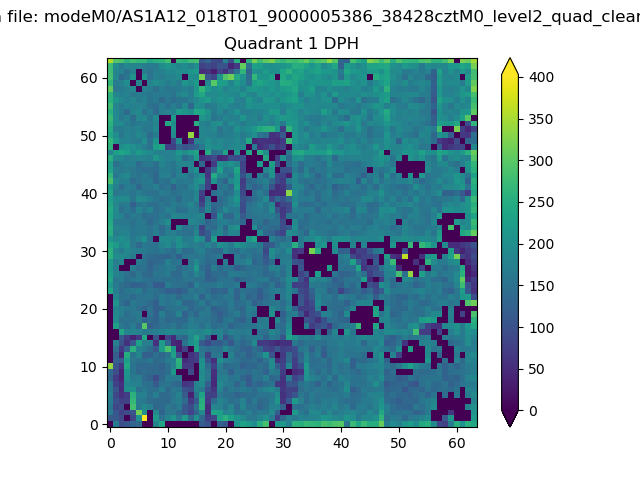 |
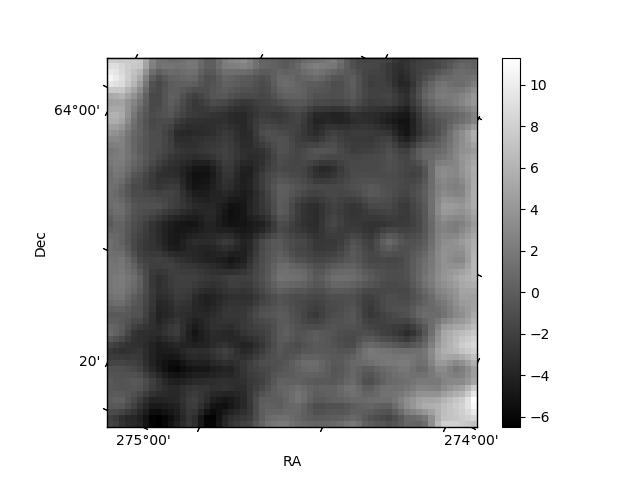
Quadrant B |
|---|---|---|---|
| Quadrant D | 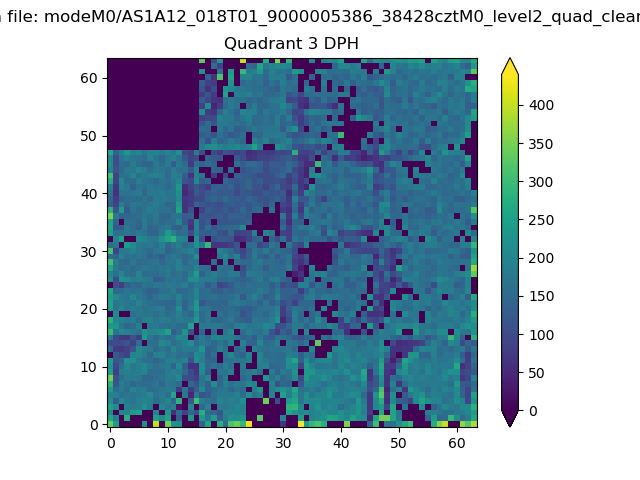 |
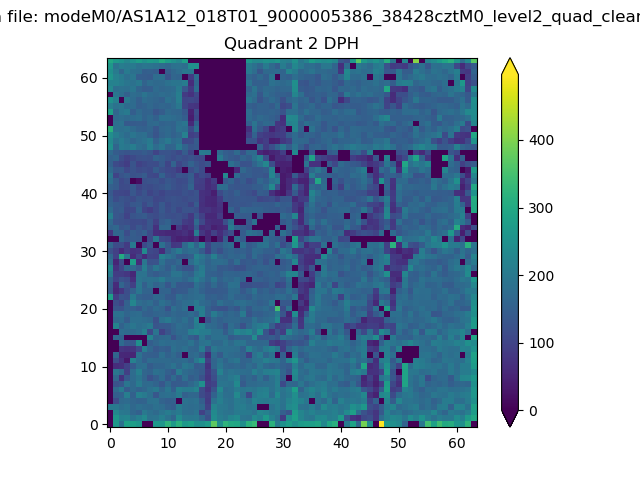 |
Quadrant C |
| Plot type | Count rate plots | Images |
|---|---|---|
| Comparison with Poisson distribution Blue bars denote a histogram of data divided into 1 sec bins. Red curve is a Poisson curve with rate = median count rate of data. |
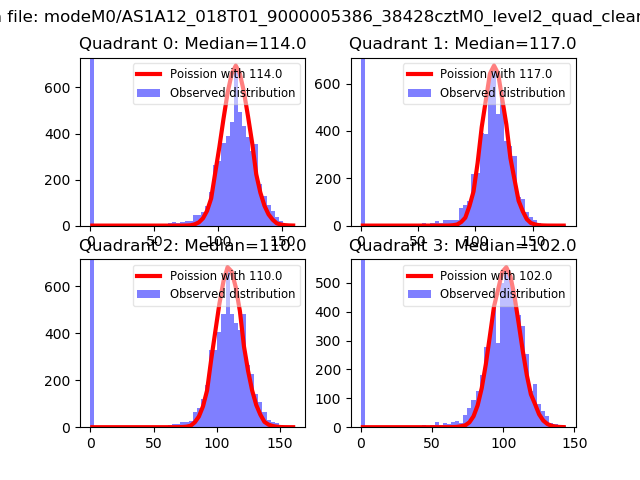 |
 |
| Quadrant-wise count rates Data is divided into 100 sec bins |
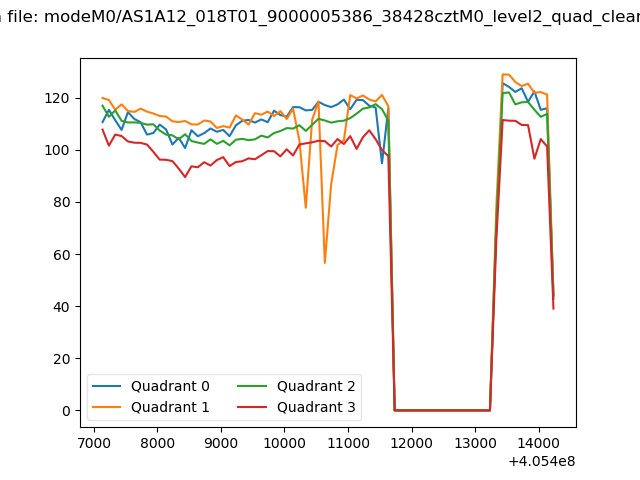 |
|
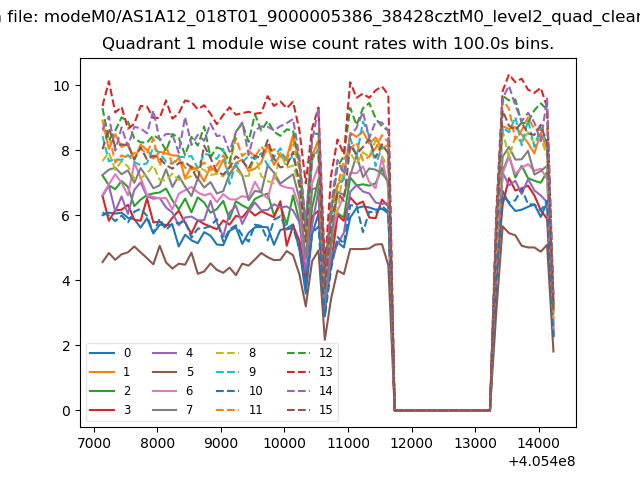
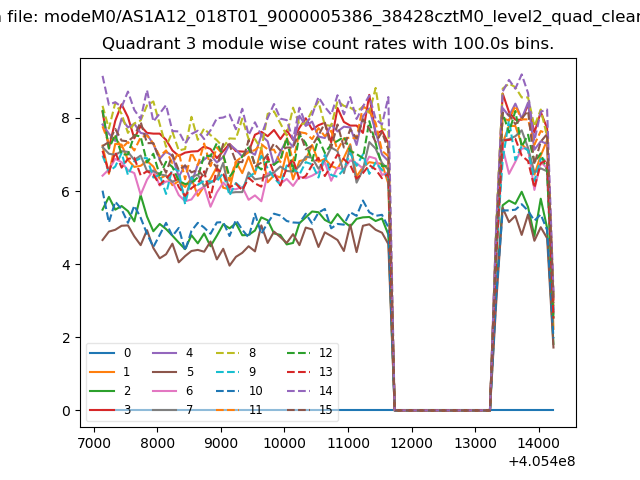
| Module-wise count rates for Quadrant A Data is divided into 100 sec bins |
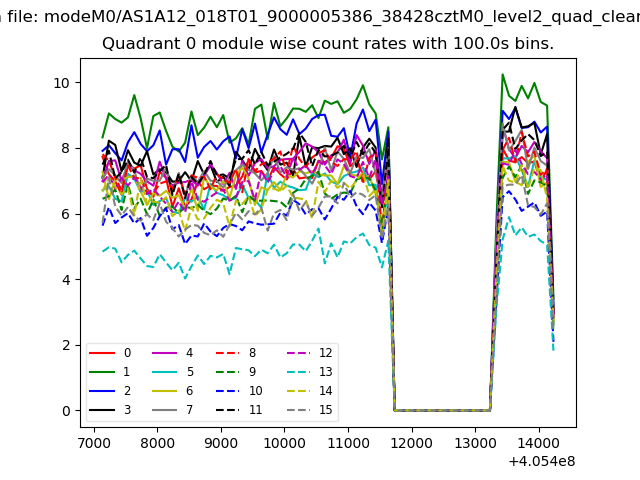 |
 |
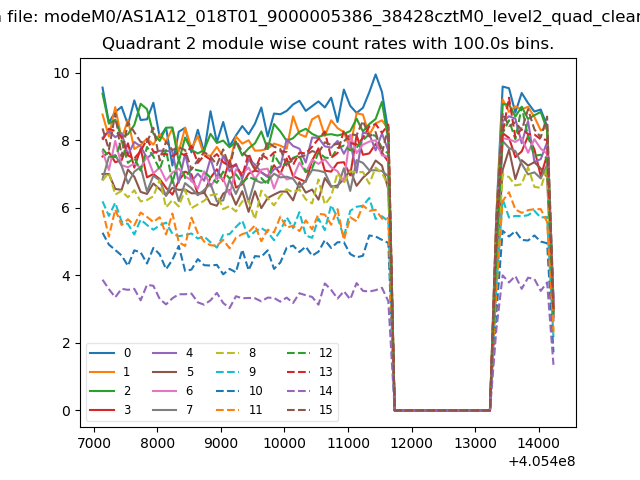
| Module-wise count rates for Quadrant B Data is divided into 100 sec bins |
 |
 |
| Module-wise count rates for Quadrant C Data is divided into 100 sec bins |
 |
 |
| Module-wise count rates for Quadrant D Data is divided into 100 sec bins |
 |
 |
| Parameter | Plot |
|---|---|
| CZT HV Monitor | 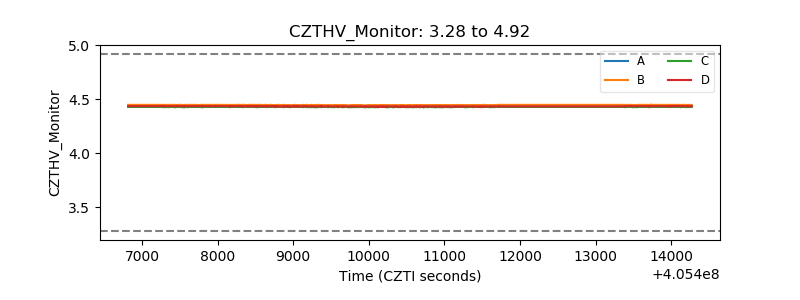 |
| D_VDD | 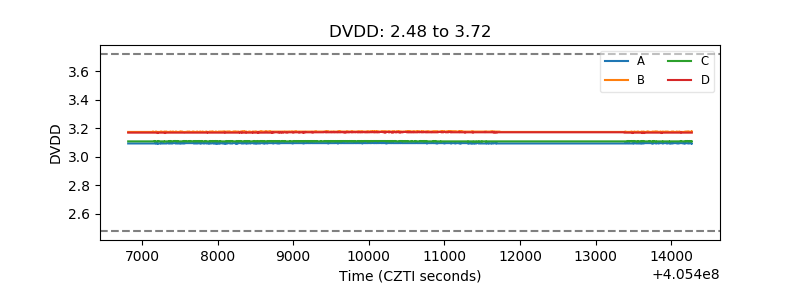 |
| Temperature 1 | 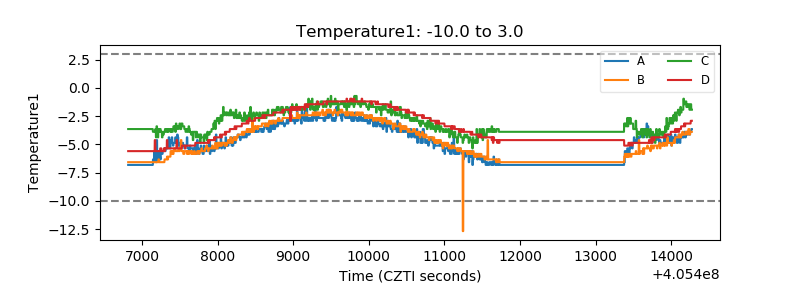 |
| Veto HV Monitor | 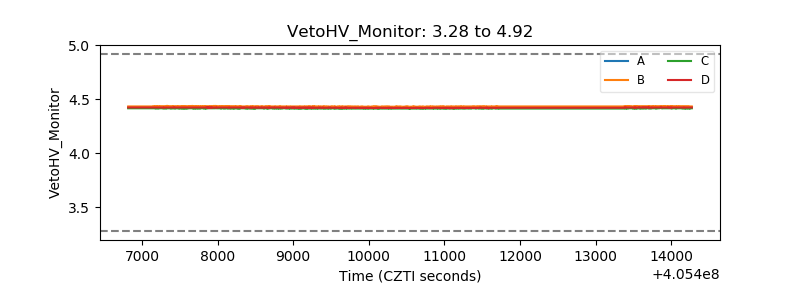 |
| Veto LLD | 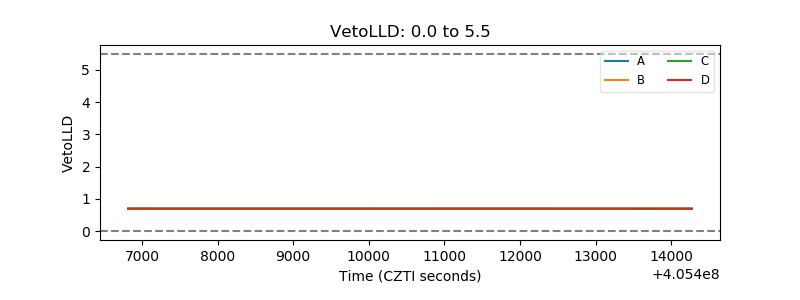 |
| Alpha Counter | 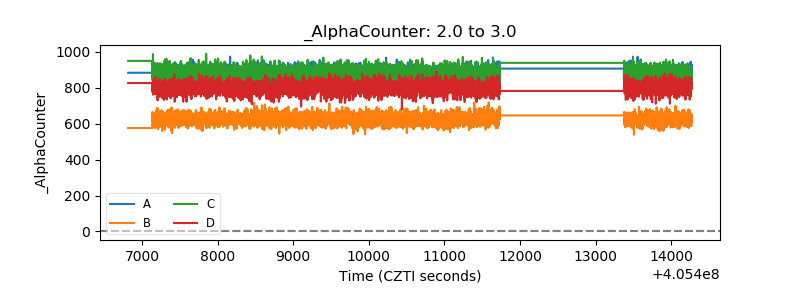 |
| _CPM_Rate | 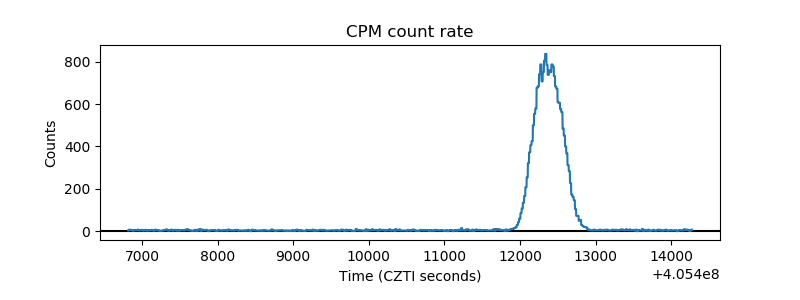 |
| CZT Counter | 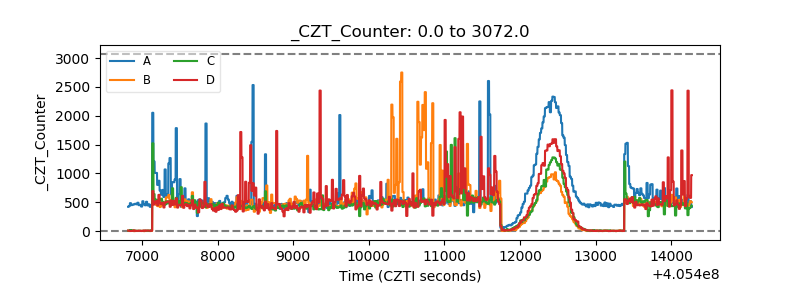 |
| +2.5 Volts monitor | 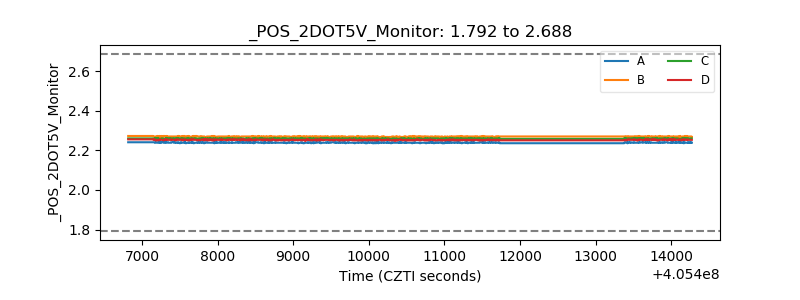 |
| +5 Volts monitor | 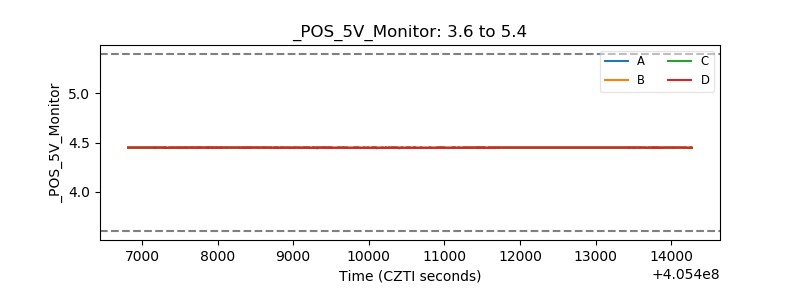 |
| _ROLL_ROT | 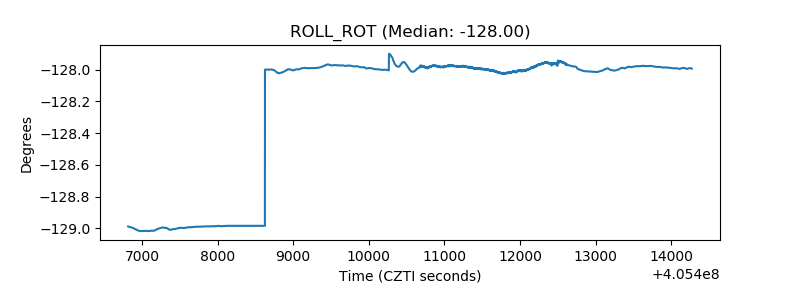 |
| _Roll_DEC | 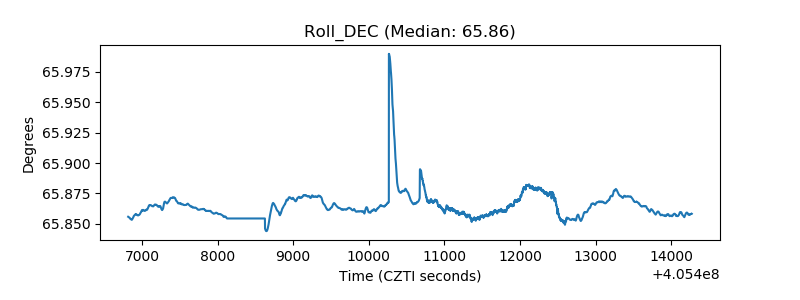 |
| _Roll_RA | 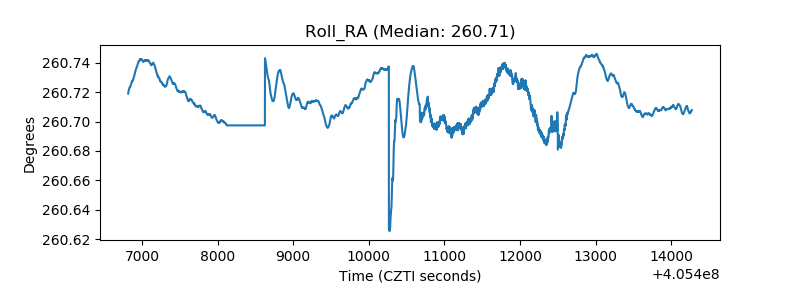 |
| Veto Counter | 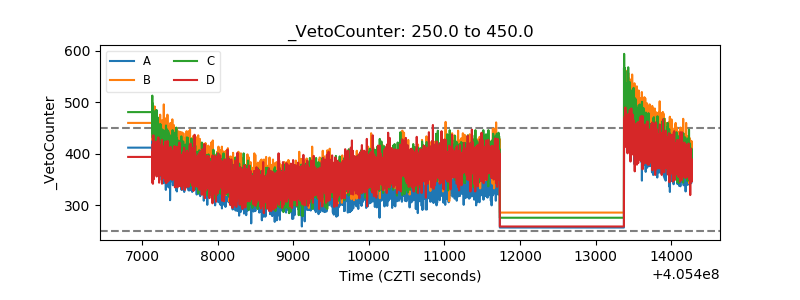 |