| Param | Original file | Final file |
|---|---|---|
| Filename | modeM0/AS1A12_018T01_9000005386_38430cztM0_level2.fits | modeM0/AS1A12_018T01_9000005386_38430cztM0_level2_quad_clean.evt |
| Size (bytes) | 359,245,440 | 92,047,680 |
| Size | 342.6 MB | 87.8 MB |
| Events in quadrant A | 2,981,553 | 634,028 |
| Events in quadrant B | 3,519,696 | 626,626 |
| Events in quadrant C | 2,563,201 | 604,792 |
| Events in quadrant D | 3,820,461 | 550,657 |
| Mode SS | |||
|---|---|---|---|
| Quadrant | BADHDUFLAG | Total packets | Discarded packets |
| A | 0 | 106 | 0 |
| B | 0 | 106 | 0 |
| C | 0 | 106 | 0 |
| D | 0 | 106 | 0 |
| Mode M9 | |||
|---|---|---|---|
| Quadrant | BADHDUFLAG | Total packets | Discarded packets |
| A | 0 | 18 | 0 |
| B | 0 | 18 | 0 |
| C | 0 | 18 | 0 |
| D | 0 | 18 | 0 |
| Mode M0 | |||
|---|---|---|---|
| Quadrant | BADHDUFLAG | Total packets | Discarded packets |
| A | 0 | 12093 | 2 |
| B | 0 | 13814 | 1 |
| C | 0 | 10836 | 1 |
| D | 0 | 15007 | 1 |
| Quadrant | Total seconds | Saturated seconds | Saturation percentage |
|---|---|---|---|
| A | 5308 | 43 | 0.810098% |
| B | 5308 | 229 | 4.314243% |
| C | 5308 | 6 | 0.113037% |
| D | 5308 | 180 | 3.391108% |
Noise dominated data is calculated using 1-second bins in cleaned event files. If a bin has >2000 counts, and if more than 50% of those come from <1% of pixels, then it is considered to be noise-dominated and hence unusable.
| Quadrant | # 1 sec bins | Bins with >0 counts | Bins with >2000 counts | High rate bins dominated by noise | Noise dominated (total time) | Noise dominated (detector-on time) | Marked lightcurve |
|---|---|---|---|---|---|---|---|
| A | 7071 | 5309 | 22 | 22 | 0.31% | 0.41% | 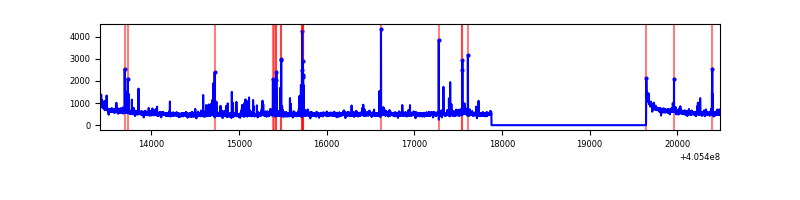 |
| B | 7071 | 5309 | 151 | 151 | 2.14% | 2.84% | 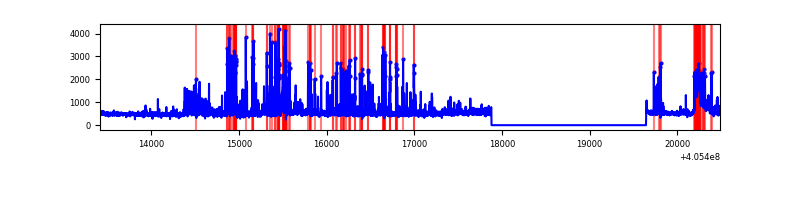 |
| C | 7071 | 5309 | 2 | 2 | 0.03% | 0.04% | 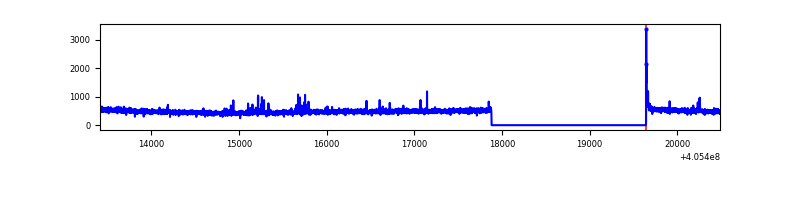 |
| D | 7071 | 5309 | 146 | 146 | 2.06% | 2.75% | 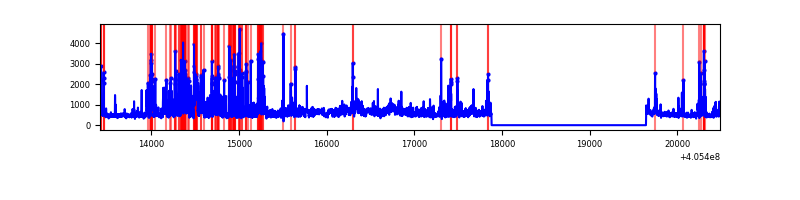 |
Top three noisy pixels from each quadrant. If the there are fewer than three noisy pixels in the level2.evt file, extra rows are filled as -1
| Pixel properties | Quadrant properties | ||||||
|---|---|---|---|---|---|---|---|
| Quadrant | DetID | PixID | Counts | Sigma | Mean | Median | Sigma |
| A | 10 | 83 | 387203 | 3145.8 | 608 | 596 | 122.9 |
| A | 9 | 143 | 166907 | 1353.26 | 608 | 596 | 122.9 |
| A | 7 | 3 | 38657 | 309.7 | 608 | 596 | 122.9 |
| B | 0 | 183 | 755451 | 6714.08 | 592 | 577 | 112.4 |
| B | 4 | 232 | 303635 | 2695.49 | 592 | 577 | 112.4 |
| B | 0 | 229 | 45903 | 403.14 | 592 | 577 | 112.4 |
| C | 15 | 214 | 227173 | 1672.69 | 584 | 588 | 135.5 |
| C | 15 | 159 | 21836 | 156.86 | 584 | 588 | 135.5 |
| C | 0 | 10 | 17100 | 121.89 | 584 | 588 | 135.5 |
| D | 12 | 235 | 446331 | 3142.93 | 584 | 567 | 141.8 |
| D | 2 | 250 | 373762 | 2631.27 | 584 | 567 | 141.8 |
| D | 13 | 249 | 279160 | 1964.26 | 584 | 567 | 141.8 |
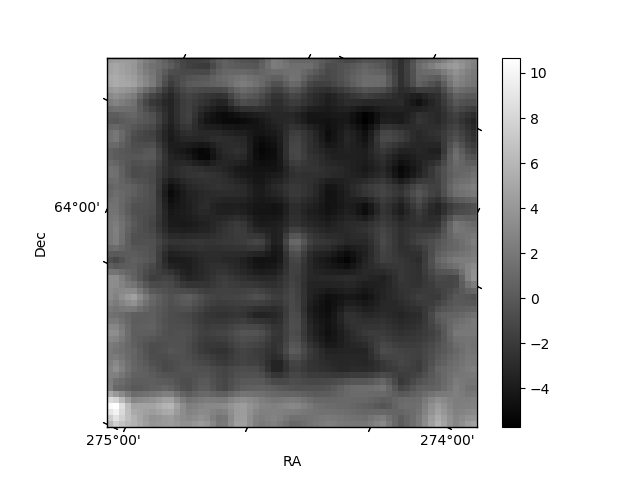
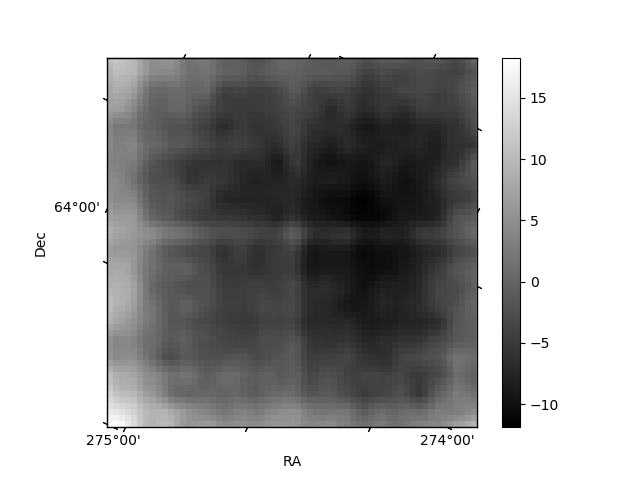
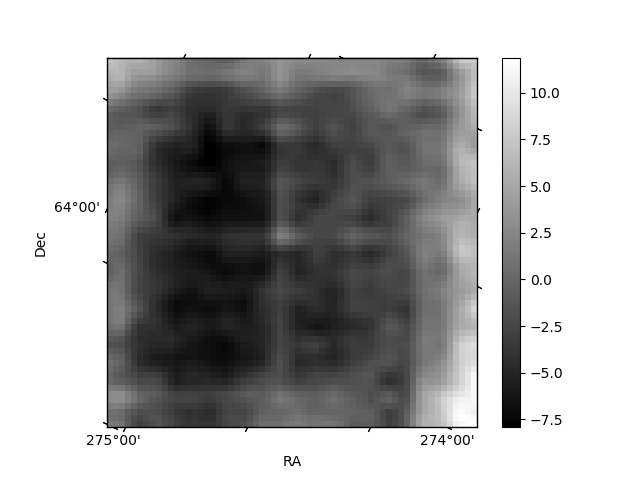
Histogram calculated using DETX and DETY for each event in the final _common_clean file
| Quadrant A |  |
 |
Quadrant B |
|---|---|---|---|
| Quadrant D |  |
 |
Quadrant C |
| Plot type | Count rate plots | Images |
|---|---|---|
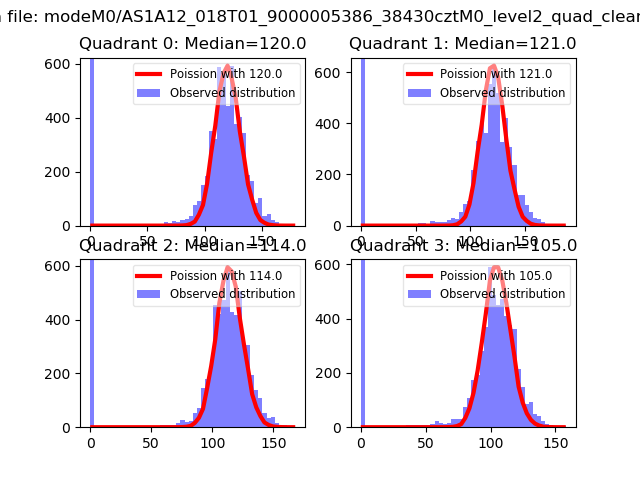
| Comparison with Poisson distribution Blue bars denote a histogram of data divided into 1 sec bins. Red curve is a Poisson curve with rate = median count rate of data. |
 |
 |
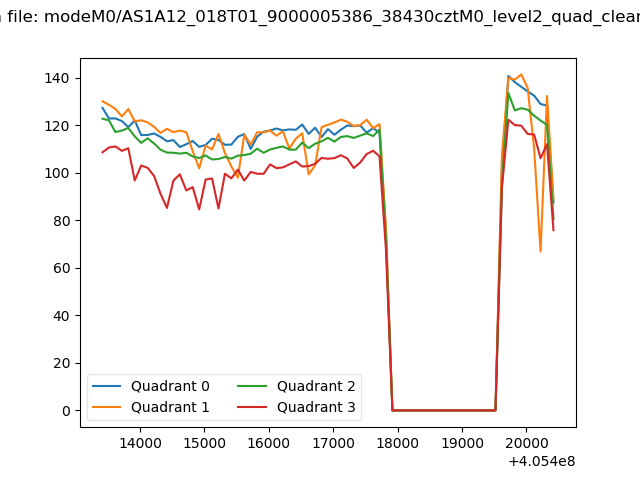
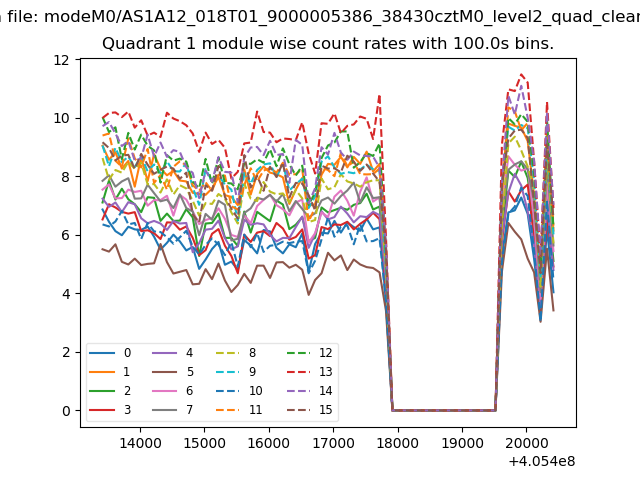
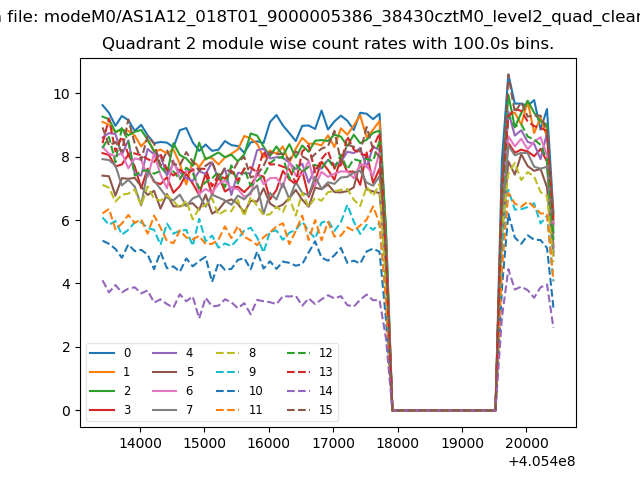
| Quadrant-wise count rates Data is divided into 100 sec bins |
 |
|
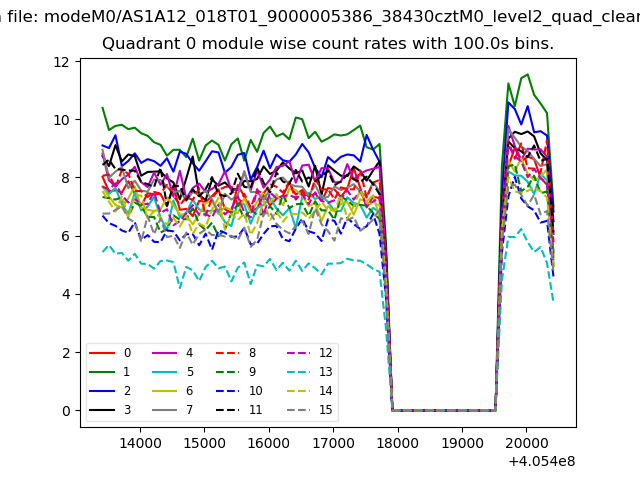
| Module-wise count rates for Quadrant A Data is divided into 100 sec bins |
 |
 |
| Module-wise count rates for Quadrant B Data is divided into 100 sec bins |
 |
 |
| Module-wise count rates for Quadrant C Data is divided into 100 sec bins |
 |
 |
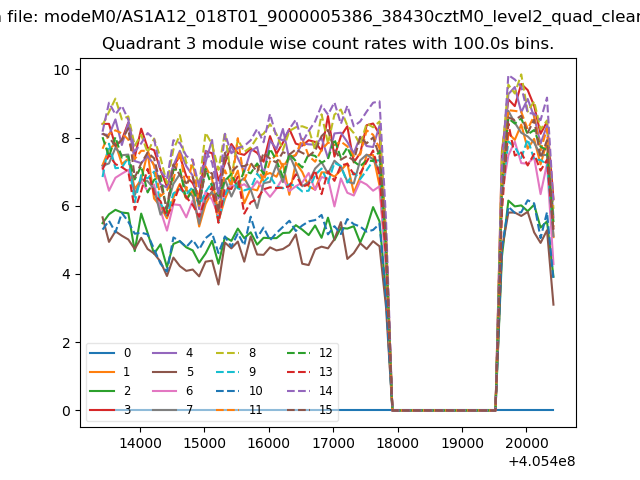
| Module-wise count rates for Quadrant D Data is divided into 100 sec bins |
 |
 |
| Parameter | Plot |
|---|---|
| CZT HV Monitor | 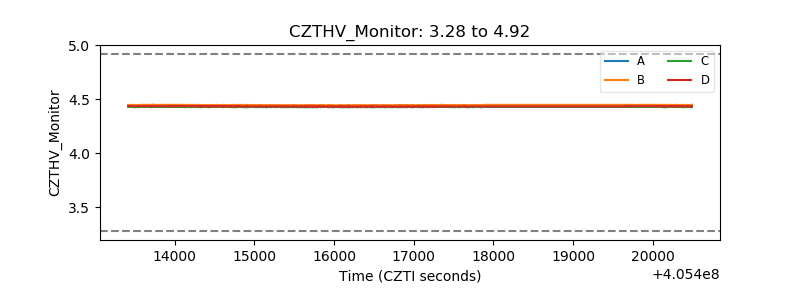 |
| D_VDD | 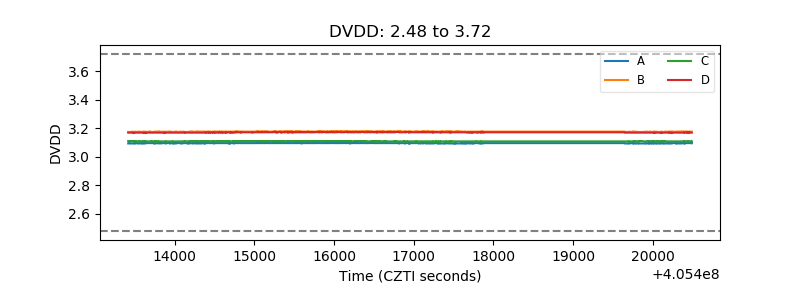 |
| Temperature 1 | 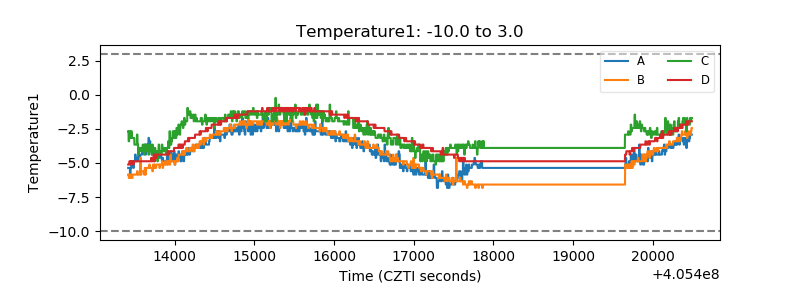 |
| Veto HV Monitor | 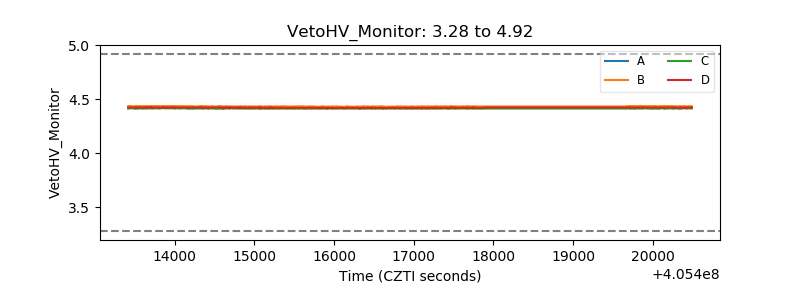 |
| Veto LLD | 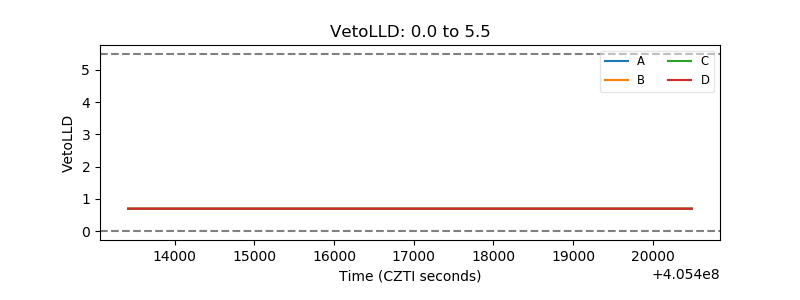 |
| Alpha Counter | 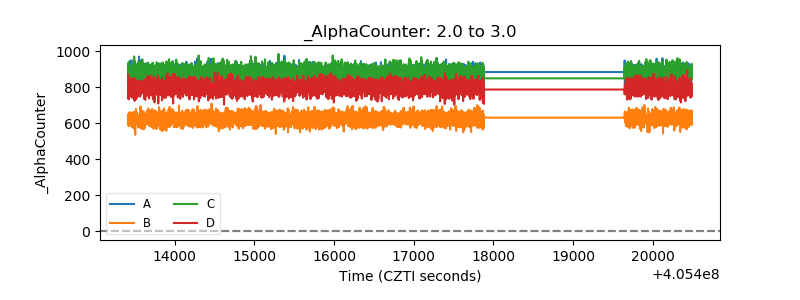 |
| _CPM_Rate | 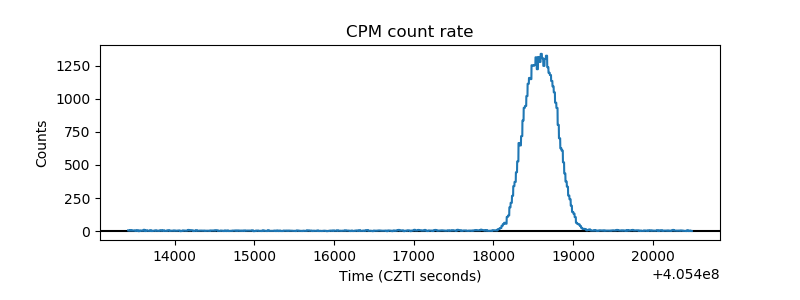 |
| CZT Counter | 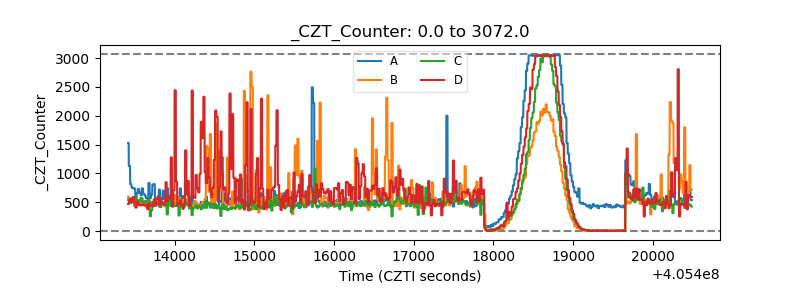 |
| +2.5 Volts monitor | 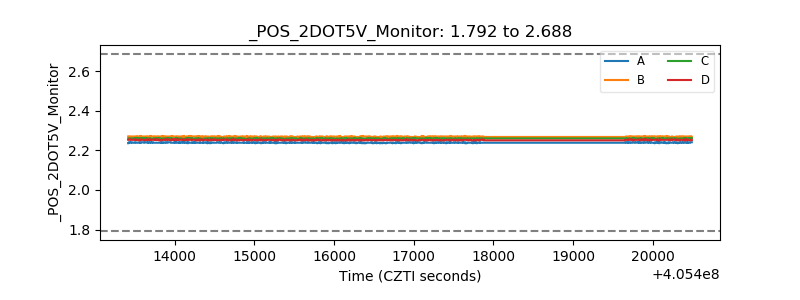 |
| +5 Volts monitor | 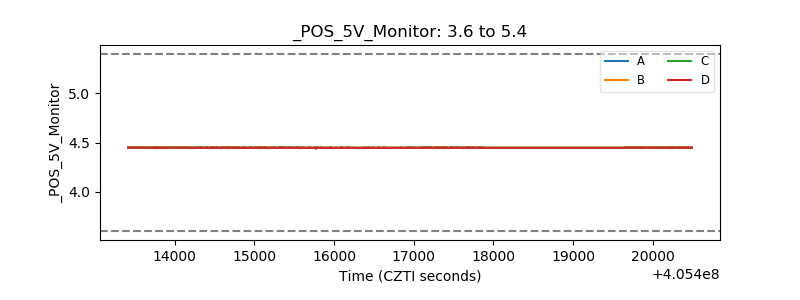 |
| _ROLL_ROT | 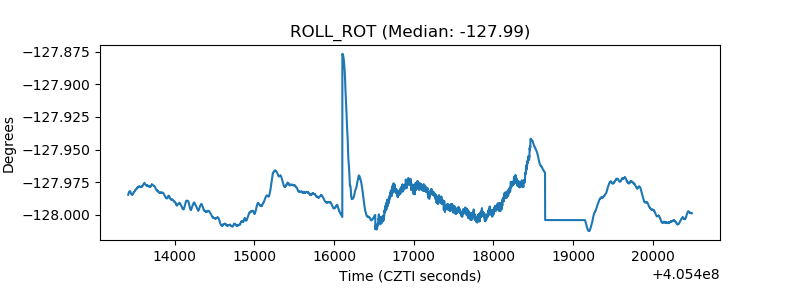 |
| _Roll_DEC |  |
| _Roll_RA | 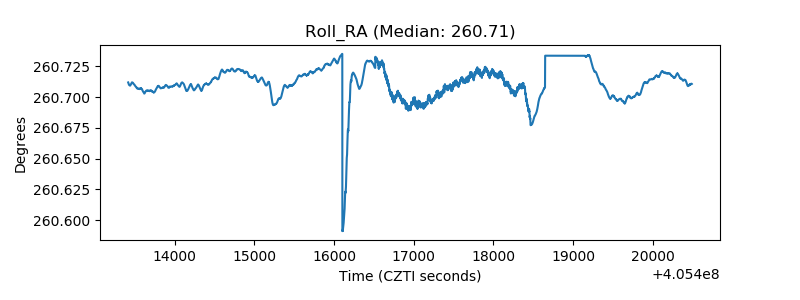 |
| Veto Counter | 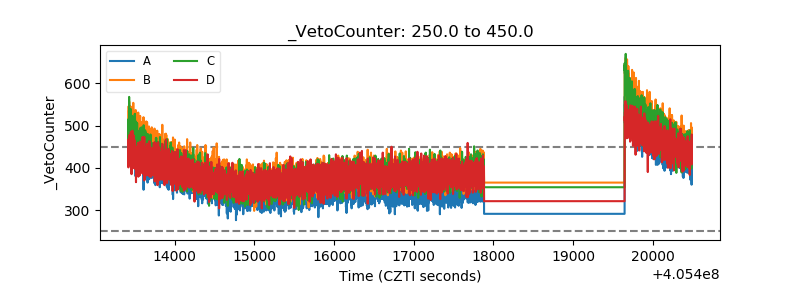 |