| Param | Original file | Final file |
|---|---|---|
| Filename | modeM0/AS1A12_018T01_9000005386_38431cztM0_level2.fits | modeM0/AS1A12_018T01_9000005386_38431cztM0_level2_quad_clean.evt |
| Size (bytes) | 364,124,160 | 95,063,040 |
| Size | 347.3 MB | 90.7 MB |
| Events in quadrant A | 3,526,561 | 661,829 |
| Events in quadrant B | 3,203,043 | 655,515 |
| Events in quadrant C | 2,575,776 | 622,236 |
| Events in quadrant D | 3,767,453 | 573,715 |
| Mode SS | |||
|---|---|---|---|
| Quadrant | BADHDUFLAG | Total packets | Discarded packets |
| A | 0 | 106 | 0 |
| B | 0 | 106 | 0 |
| C | 0 | 106 | 0 |
| D | 0 | 106 | 0 |
| Mode M9 | |||
|---|---|---|---|
| Quadrant | BADHDUFLAG | Total packets | Discarded packets |
| A | 0 | 23 | 0 |
| B | 0 | 23 | 0 |
| C | 0 | 23 | 0 |
| D | 0 | 24 | 0 |
| Mode M0 | |||
|---|---|---|---|
| Quadrant | BADHDUFLAG | Total packets | Discarded packets |
| A | 0 | 13837 | 3 |
| B | 0 | 12820 | 2 |
| C | 0 | 10672 | 2 |
| D | 0 | 14811 | 2 |
| Quadrant | Total seconds | Saturated seconds | Saturation percentage |
|---|---|---|---|
| A | 5217 | 50 | 0.958405% |
| B | 5217 | 181 | 3.469427% |
| C | 5217 | 13 | 0.249185% |
| D | 5217 | 146 | 2.798543% |
Noise dominated data is calculated using 1-second bins in cleaned event files. If a bin has >2000 counts, and if more than 50% of those come from <1% of pixels, then it is considered to be noise-dominated and hence unusable.
| Quadrant | # 1 sec bins | Bins with >0 counts | Bins with >2000 counts | High rate bins dominated by noise | Noise dominated (total time) | Noise dominated (detector-on time) | Marked lightcurve |
|---|---|---|---|---|---|---|---|
| A | 7129 | 5218 | 38 | 38 | 0.53% | 0.73% | 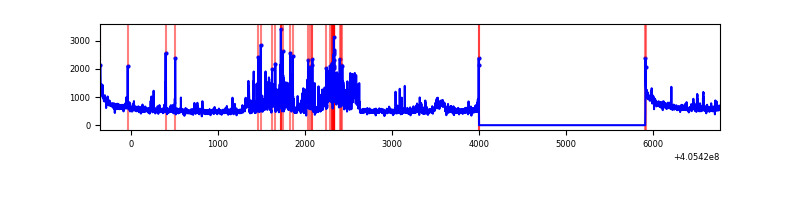 |
| B | 7129 | 5218 | 115 | 115 | 1.61% | 2.20% | 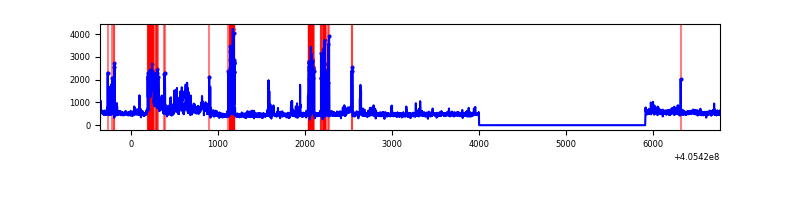 |
| C | 7129 | 5218 | 4 | 4 | 0.06% | 0.08% | 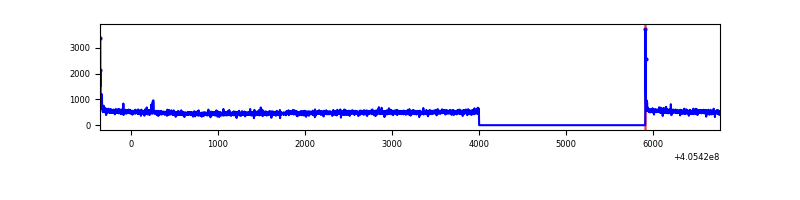 |
| D | 7129 | 5218 | 115 | 115 | 1.61% | 2.20% | 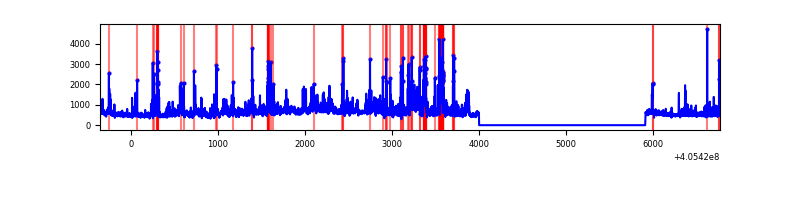 |
Top three noisy pixels from each quadrant. If the there are fewer than three noisy pixels in the level2.evt file, extra rows are filled as -1
| Pixel properties | Quadrant properties | ||||||
|---|---|---|---|---|---|---|---|
| Quadrant | DetID | PixID | Counts | Sigma | Mean | Median | Sigma |
| A | 7 | 3 | 573609 | 4639.6 | 616 | 606 | 123.5 |
| A | 10 | 83 | 402276 | 3252.32 | 616 | 606 | 123.5 |
| A | 12 | 189 | 67988 | 545.59 | 616 | 606 | 123.5 |
| B | 0 | 183 | 353469 | 3083.7 | 599 | 584 | 114.4 |
| B | 4 | 232 | 283072 | 2468.53 | 599 | 584 | 114.4 |
| B | 5 | 184 | 113940 | 990.57 | 599 | 584 | 114.4 |
| C | 15 | 214 | 224685 | 1645.62 | 588 | 591 | 136.2 |
| C | 0 | 10 | 30092 | 216.64 | 588 | 591 | 136.2 |
| C | 10 | 70 | 12496 | 87.42 | 588 | 591 | 136.2 |
| D | 2 | 16 | 406896 | 2872.55 | 590 | 575 | 141.4 |
| D | 13 | 249 | 258524 | 1823.61 | 590 | 575 | 141.4 |
| D | 12 | 235 | 251908 | 1776.84 | 590 | 575 | 141.4 |
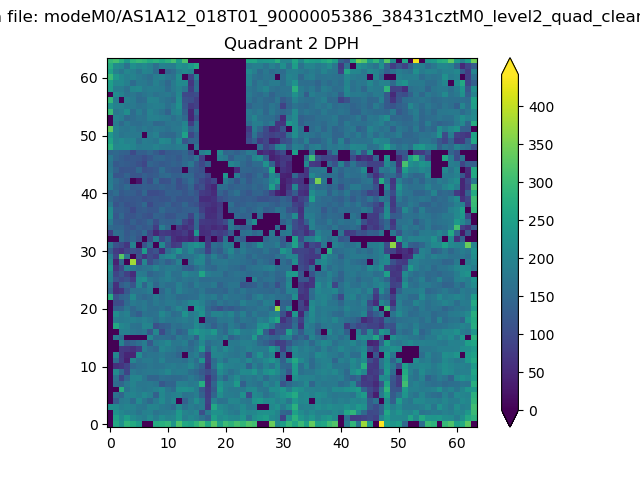
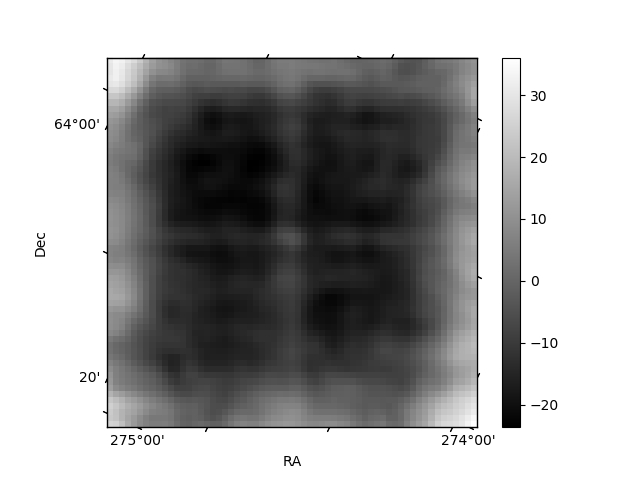
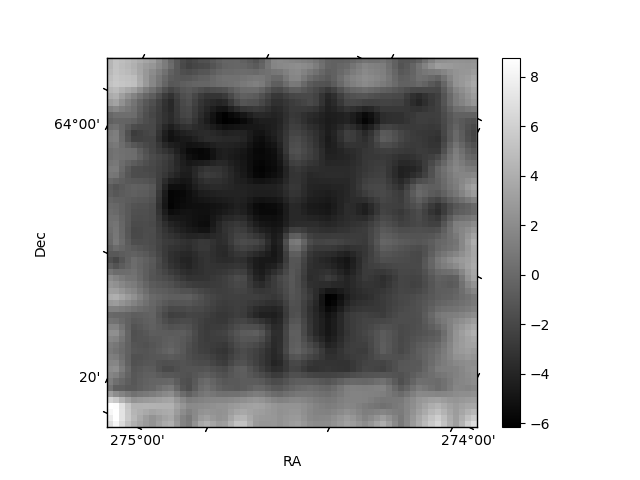
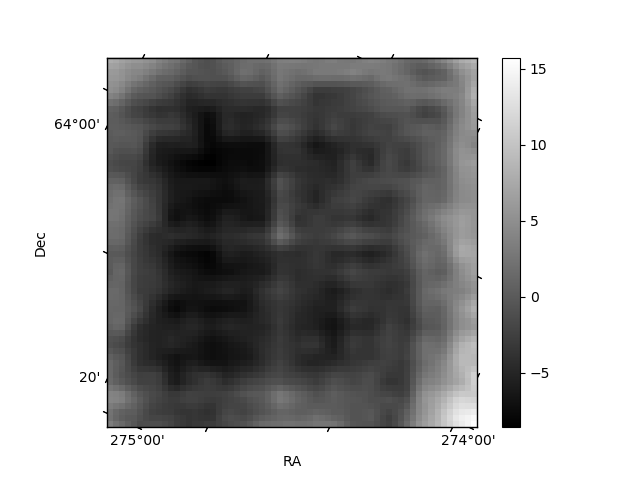
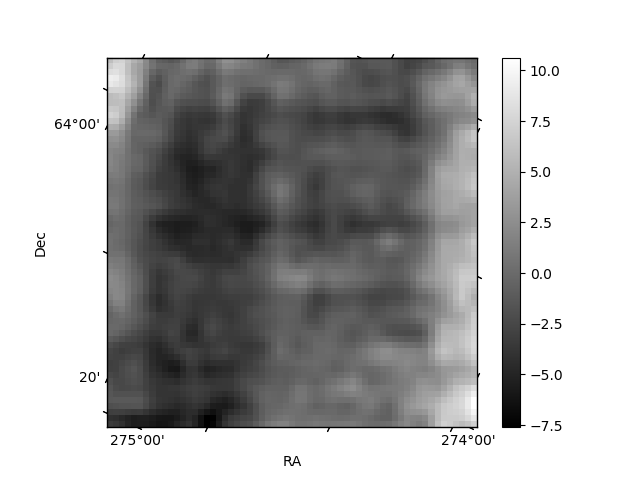
Histogram calculated using DETX and DETY for each event in the final _common_clean file
| Quadrant A | 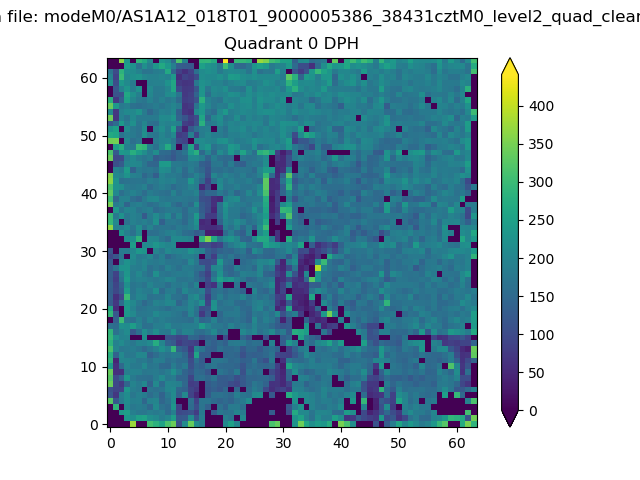 |
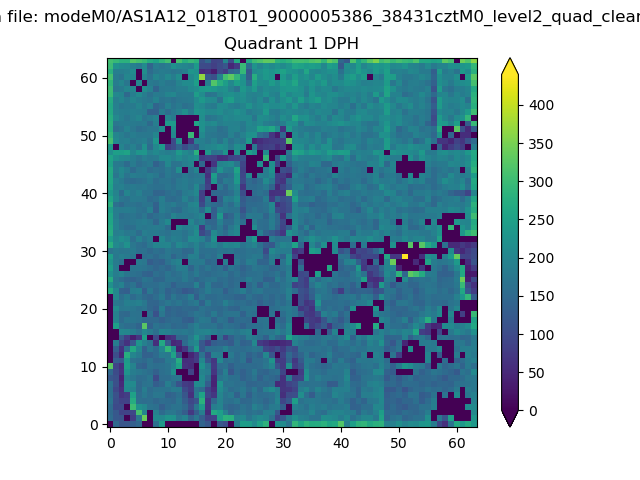 |
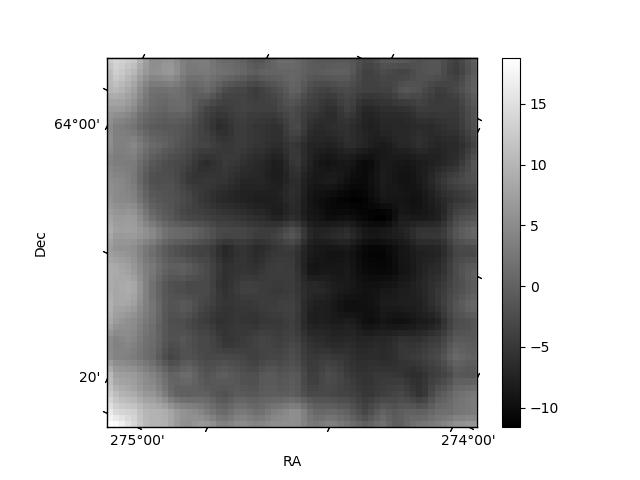
Quadrant B |
|---|---|---|---|
| Quadrant D | 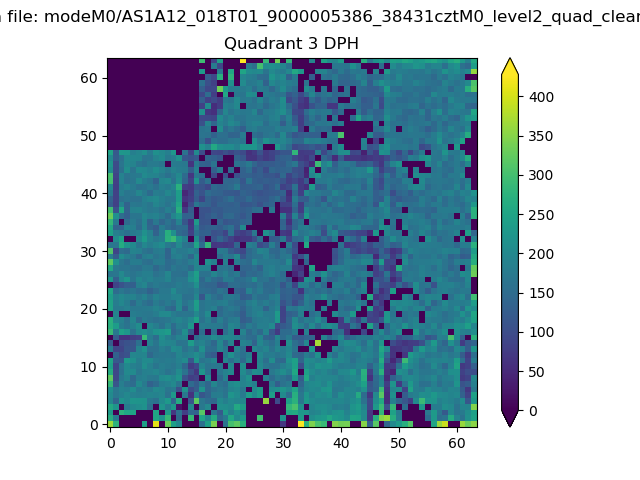 |
 |
Quadrant C |
| Plot type | Count rate plots | Images |
|---|---|---|
| Comparison with Poisson distribution Blue bars denote a histogram of data divided into 1 sec bins. Red curve is a Poisson curve with rate = median count rate of data. |
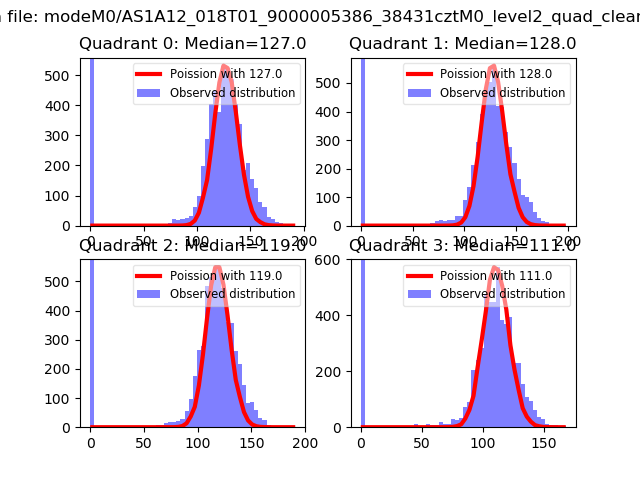 |
 |
| Quadrant-wise count rates Data is divided into 100 sec bins |
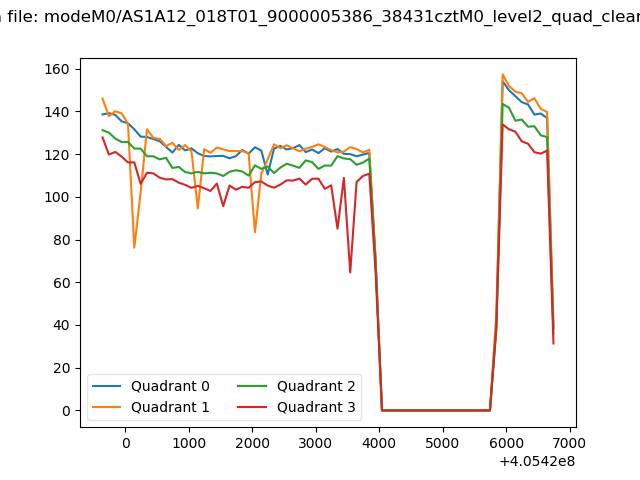 |
|
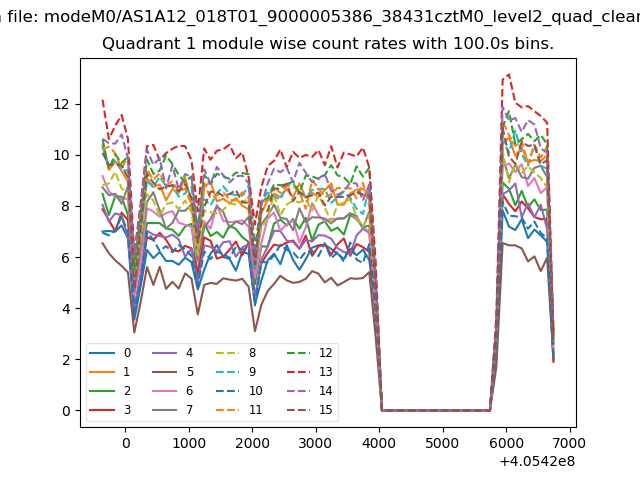
| Module-wise count rates for Quadrant A Data is divided into 100 sec bins |
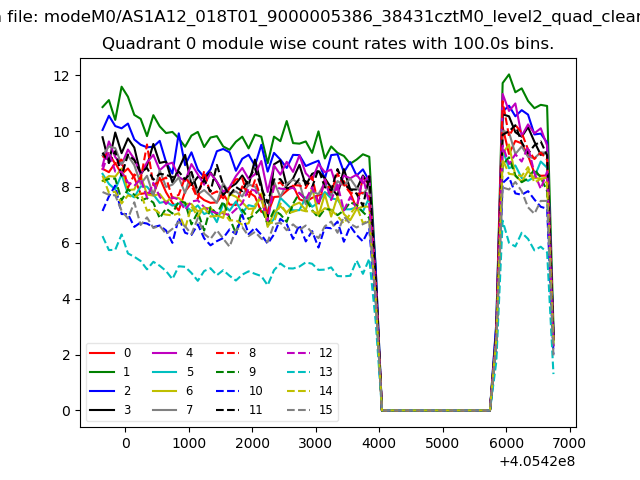 |
 |
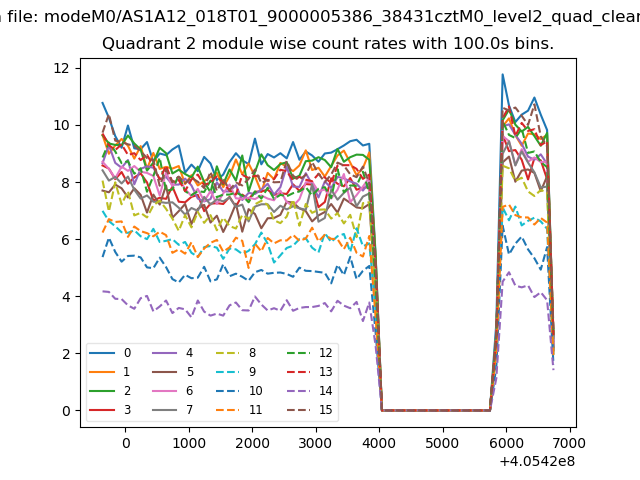
| Module-wise count rates for Quadrant B Data is divided into 100 sec bins |
 |
 |
| Module-wise count rates for Quadrant C Data is divided into 100 sec bins |
 |
 |
| Module-wise count rates for Quadrant D Data is divided into 100 sec bins |
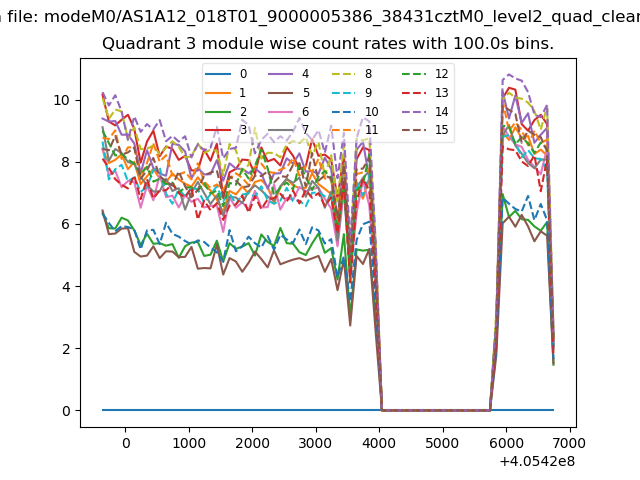 |
 |
| Parameter | Plot |
|---|---|
| CZT HV Monitor | 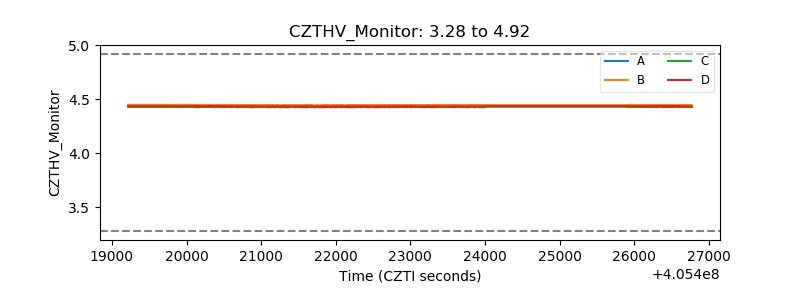 |
| D_VDD | 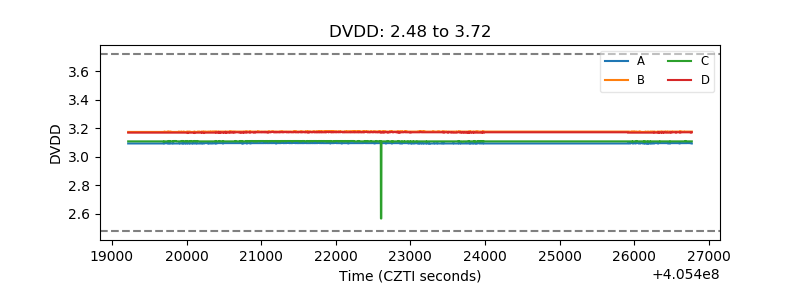 |
| Temperature 1 | 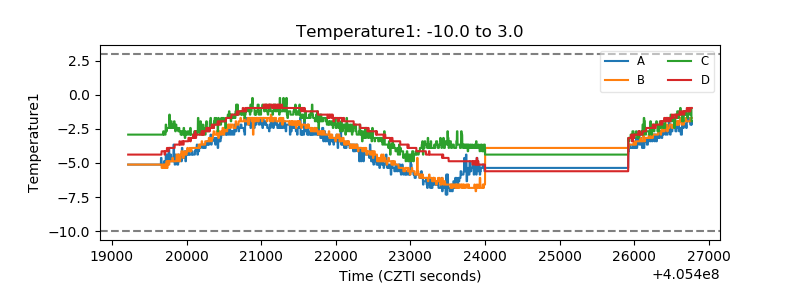 |
| Veto HV Monitor | 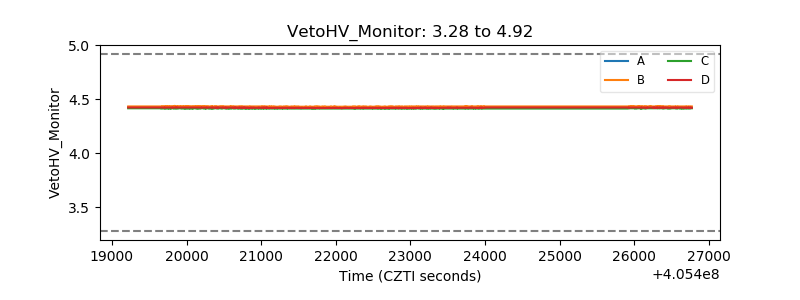 |
| Veto LLD | 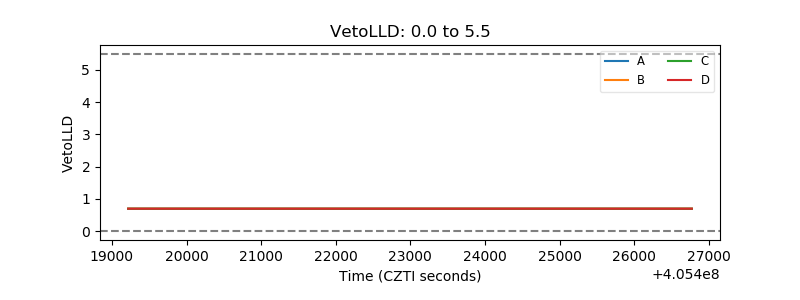 |
| Alpha Counter | 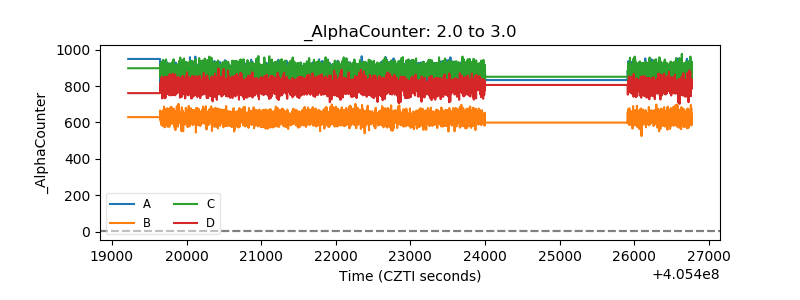 |
| _CPM_Rate | 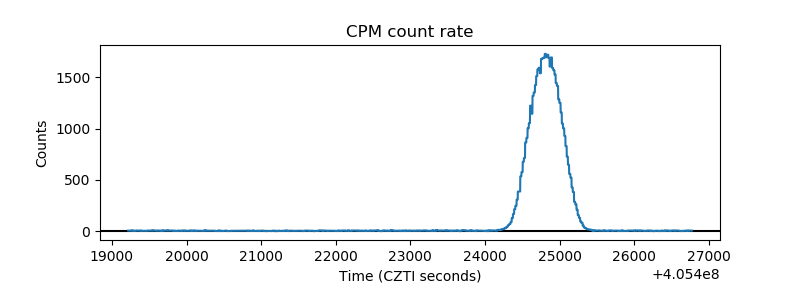 |
| CZT Counter | 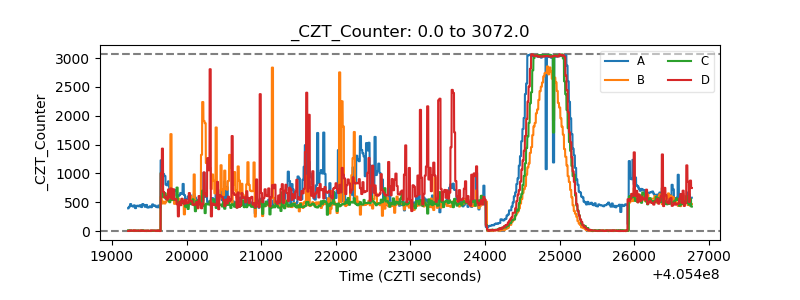 |
| +2.5 Volts monitor | 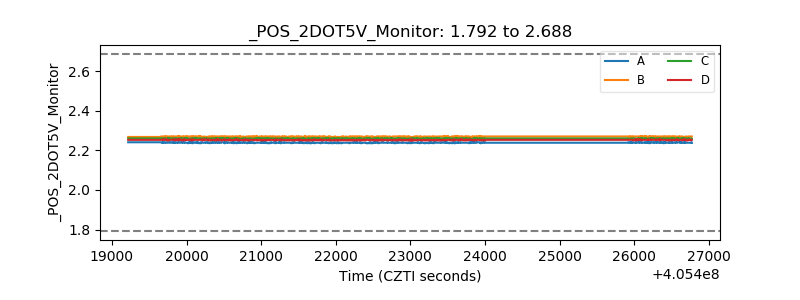 |
| +5 Volts monitor | 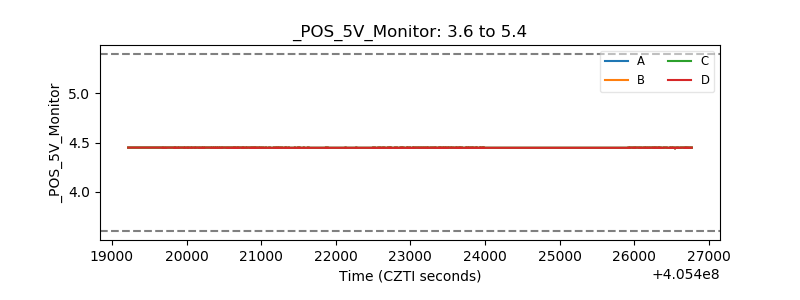 |
| _ROLL_ROT | 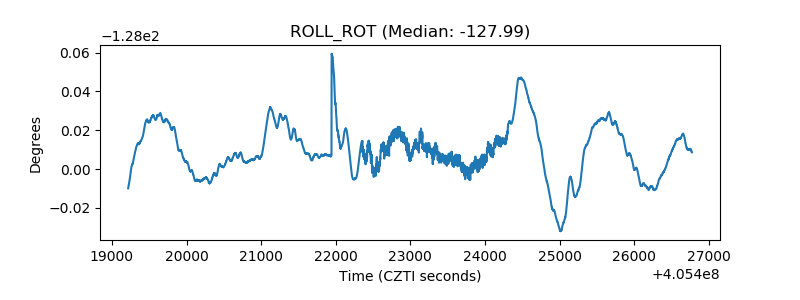 |
| _Roll_DEC | 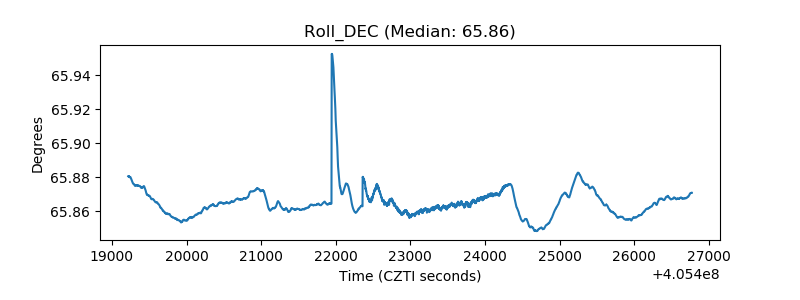 |
| _Roll_RA | 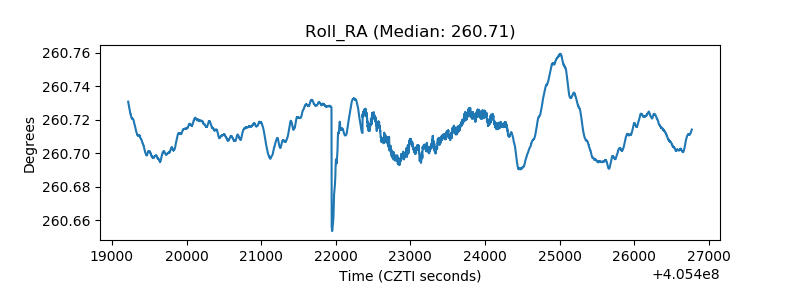 |
| Veto Counter | 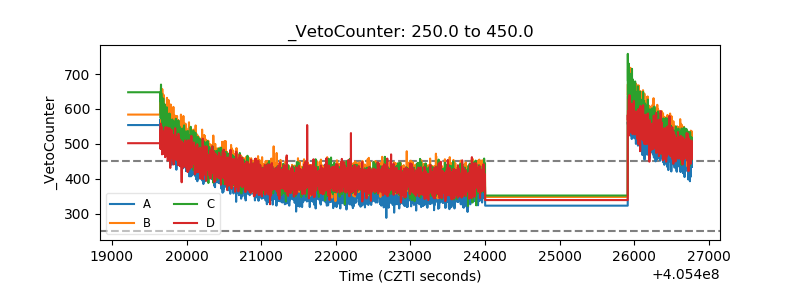 |