| Param | Original file | Final file |
|---|---|---|
| Filename | modeM0/AS1A12_018T01_9000005386_38432cztM0_level2.fits | modeM0/AS1A12_018T01_9000005386_38432cztM0_level2_quad_clean.evt |
| Size (bytes) | 349,228,800 | 94,138,560 |
| Size | 333.1 MB | 89.8 MB |
| Events in quadrant A | 2,897,960 | 664,057 |
| Events in quadrant B | 2,843,978 | 656,635 |
| Events in quadrant C | 3,379,020 | 599,723 |
| Events in quadrant D | 3,415,564 | 578,462 |
| Mode SS | |||
|---|---|---|---|
| Quadrant | BADHDUFLAG | Total packets | Discarded packets |
| A | 0 | 102 | 0 |
| B | 0 | 102 | 0 |
| C | 0 | 102 | 0 |
| D | 0 | 102 | 0 |
| Mode M9 | |||
|---|---|---|---|
| Quadrant | BADHDUFLAG | Total packets | Discarded packets |
| A | 0 | 20 | 0 |
| B | 0 | 20 | 0 |
| C | 0 | 20 | 0 |
| D | 0 | 20 | 0 |
| Mode M0 | |||
|---|---|---|---|
| Quadrant | BADHDUFLAG | Total packets | Discarded packets |
| A | 0 | 11654 | 2 |
| B | 0 | 11561 | 1 |
| C | 0 | 13046 | 1 |
| D | 0 | 13459 | 1 |
| Quadrant | Total seconds | Saturated seconds | Saturation percentage |
|---|---|---|---|
| A | 5022 | 22 | 0.438072% |
| B | 5022 | 108 | 2.150538% |
| C | 5022 | 274 | 5.455994% |
| D | 5022 | 100 | 1.991239% |
Noise dominated data is calculated using 1-second bins in cleaned event files. If a bin has >2000 counts, and if more than 50% of those come from <1% of pixels, then it is considered to be noise-dominated and hence unusable.
| Quadrant | # 1 sec bins | Bins with >0 counts | Bins with >2000 counts | High rate bins dominated by noise | Noise dominated (total time) | Noise dominated (detector-on time) | Marked lightcurve |
|---|---|---|---|---|---|---|---|
| A | 7054 | 5023 | 7 | 7 | 0.10% | 0.14% | 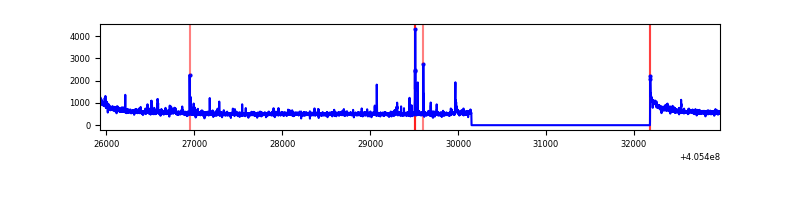 |
| B | 7054 | 5023 | 60 | 60 | 0.85% | 1.19% | 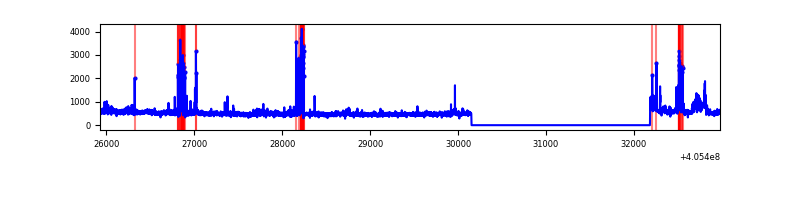 |
| C | 7054 | 5023 | 206 | 206 | 2.92% | 4.10% | 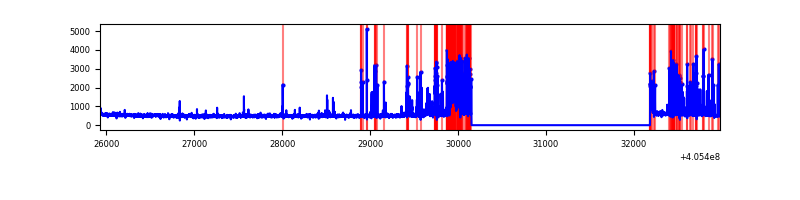 |
| D | 7054 | 5023 | 93 | 93 | 1.32% | 1.85% | 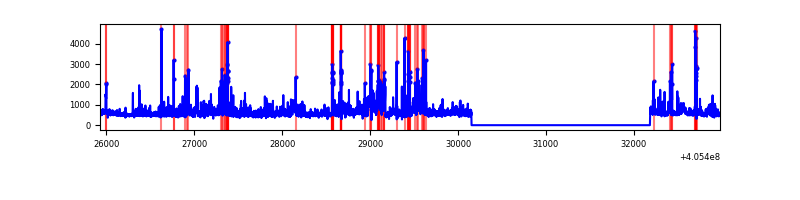 |
Top three noisy pixels from each quadrant. If the there are fewer than three noisy pixels in the level2.evt file, extra rows are filled as -1
| Pixel properties | Quadrant properties | ||||||
|---|---|---|---|---|---|---|---|
| Quadrant | DetID | PixID | Counts | Sigma | Mean | Median | Sigma |
| A | 10 | 83 | 394480 | 3234.62 | 606 | 594 | 121.8 |
| A | 9 | 143 | 59783 | 486.07 | 606 | 594 | 121.8 |
| A | 12 | 189 | 36537 | 295.17 | 606 | 594 | 121.8 |
| B | 4 | 232 | 182115 | 1638.31 | 590 | 577 | 110.8 |
| B | 5 | 184 | 102189 | 917.01 | 590 | 577 | 110.8 |
| B | 0 | 183 | 78732 | 705.32 | 590 | 577 | 110.8 |
| C | 4 | 254 | 836276 | 6463.95 | 566 | 571 | 129.3 |
| C | 15 | 214 | 210470 | 1623.51 | 566 | 571 | 129.3 |
| C | 14 | 254 | 36836 | 280.5 | 566 | 571 | 129.3 |
| D | 12 | 227 | 275680 | 1993.9 | 584 | 570 | 138.0 |
| D | 13 | 249 | 181996 | 1314.91 | 584 | 570 | 138.0 |
| D | 2 | 16 | 136479 | 985.02 | 584 | 570 | 138.0 |
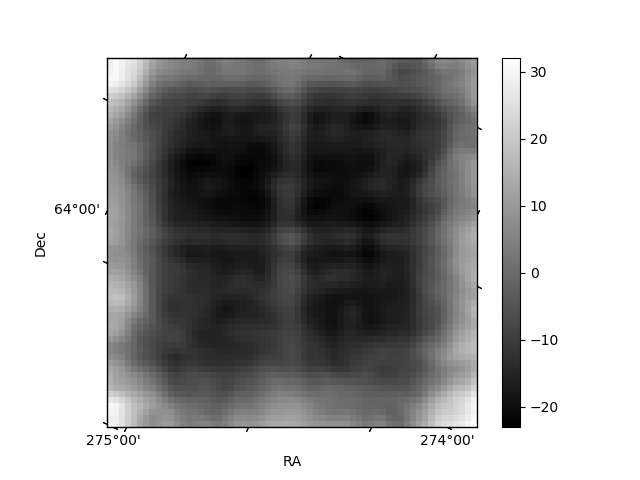
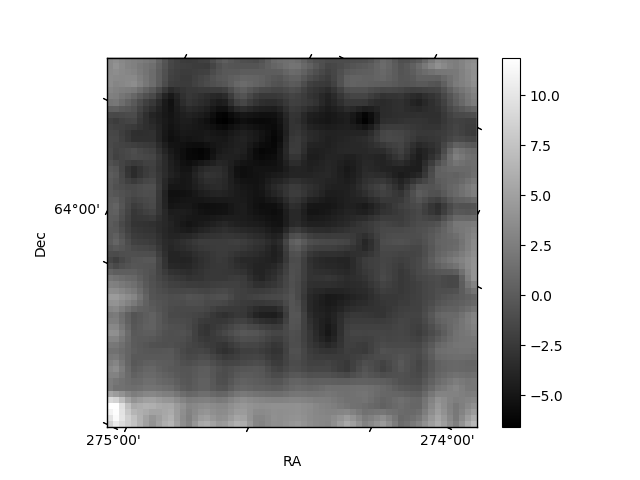
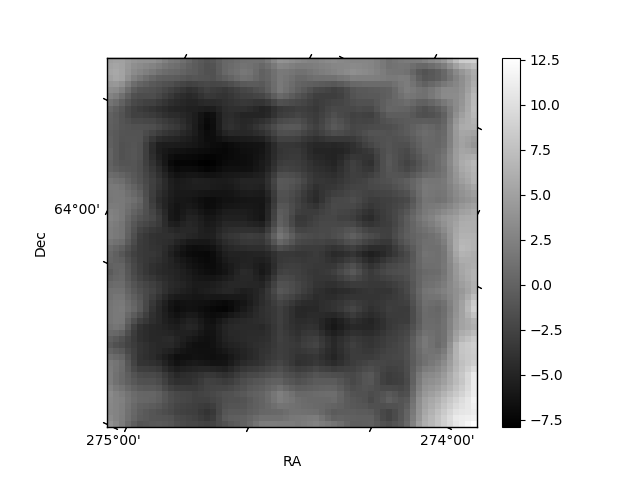
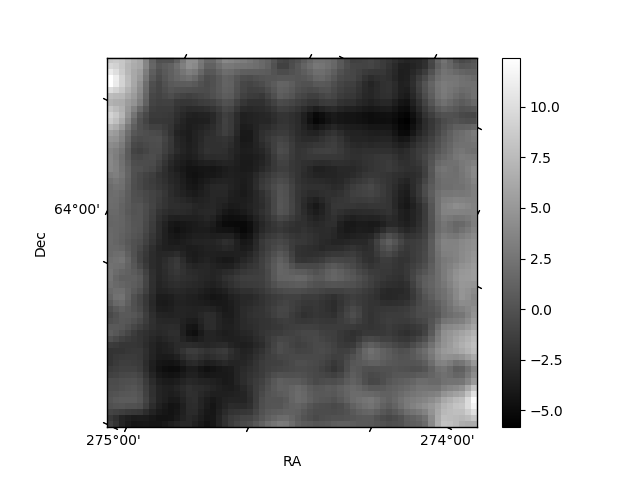
Histogram calculated using DETX and DETY for each event in the final _common_clean file
| Quadrant A | 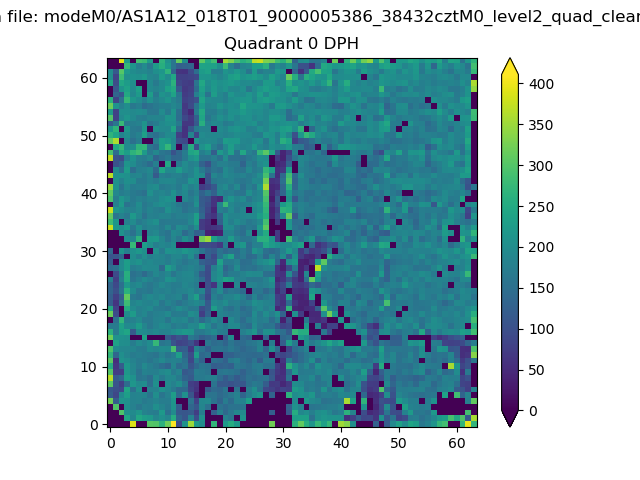 |
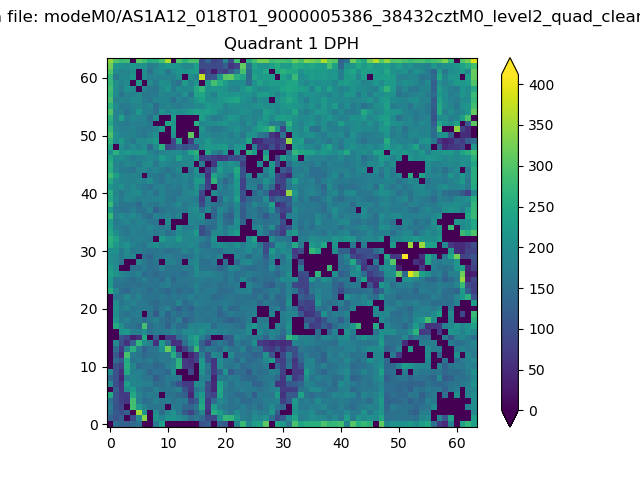 |
Quadrant B |
|---|---|---|---|
| Quadrant D | 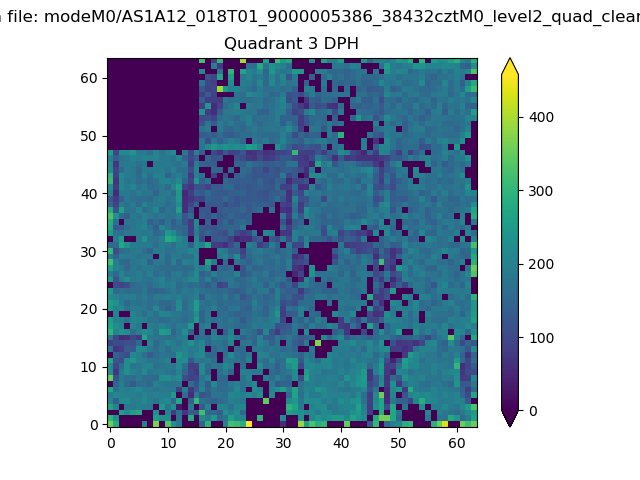 |
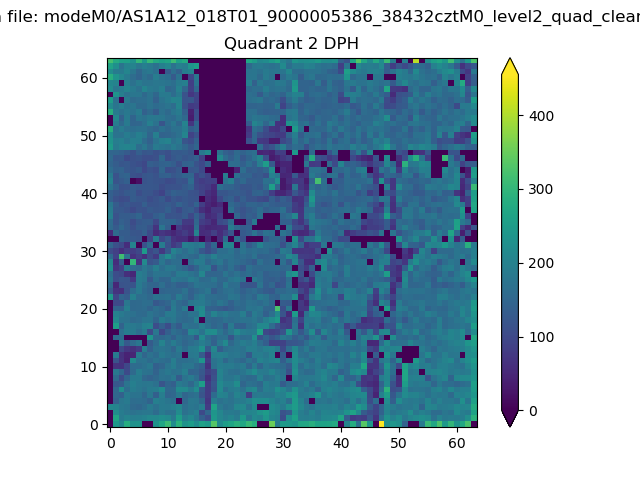 |
Quadrant C |
| Plot type | Count rate plots | Images |
|---|---|---|
| Comparison with Poisson distribution Blue bars denote a histogram of data divided into 1 sec bins. Red curve is a Poisson curve with rate = median count rate of data. |
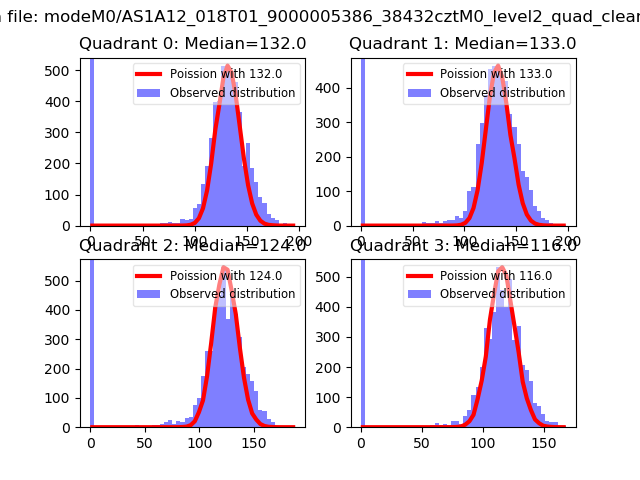 |
 |
| Quadrant-wise count rates Data is divided into 100 sec bins |
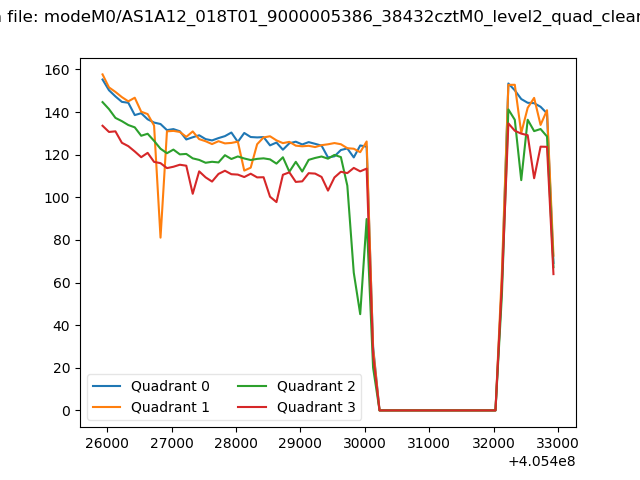 |
|
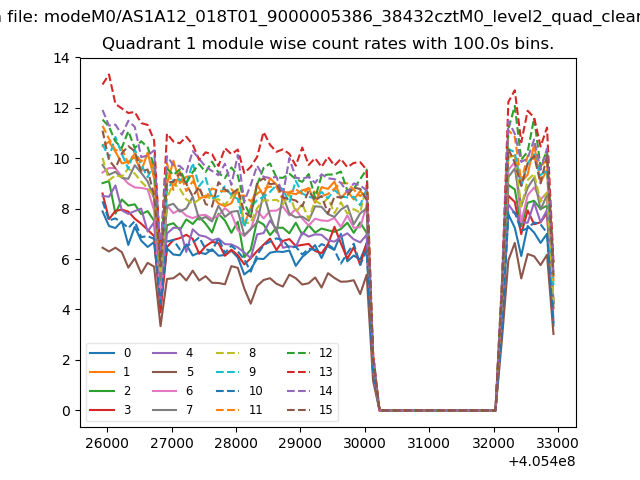
| Module-wise count rates for Quadrant A Data is divided into 100 sec bins |
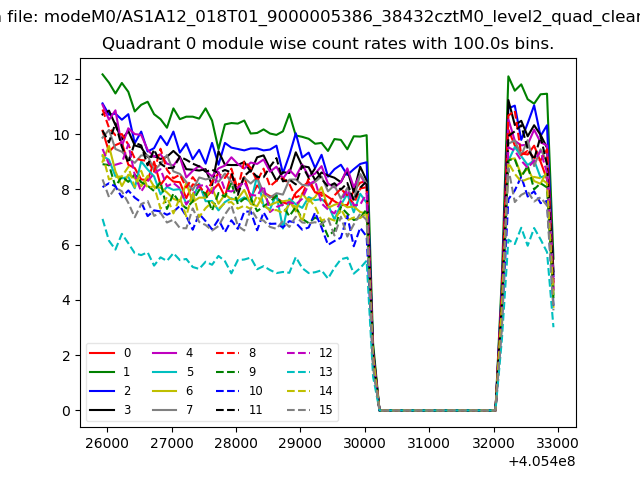 |
 |
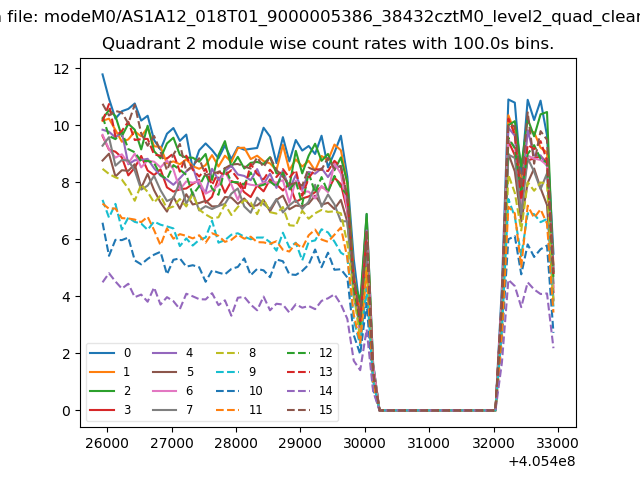
| Module-wise count rates for Quadrant B Data is divided into 100 sec bins |
 |
 |
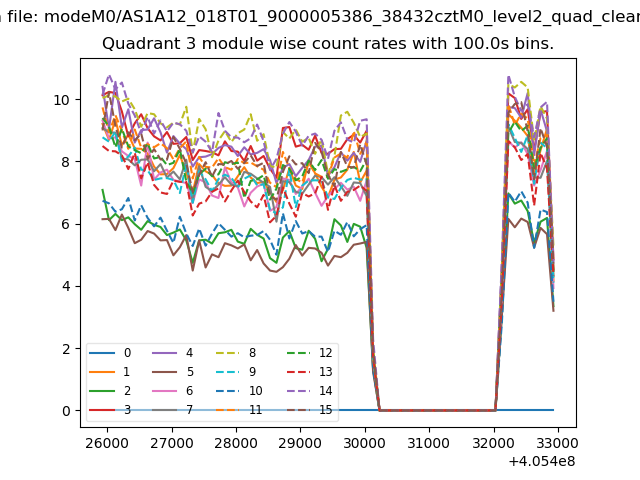
| Module-wise count rates for Quadrant C Data is divided into 100 sec bins |
 |
 |
| Module-wise count rates for Quadrant D Data is divided into 100 sec bins |
 |
 |
| Parameter | Plot |
|---|---|
| CZT HV Monitor | 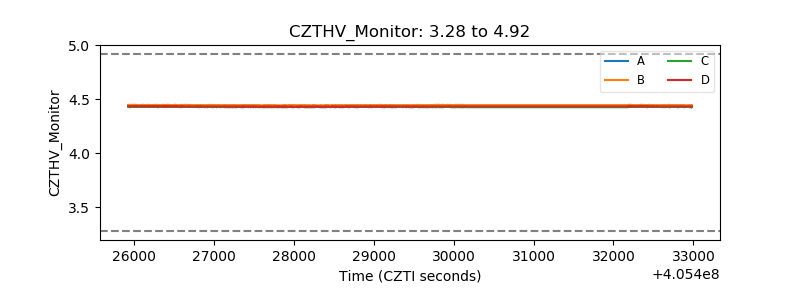 |
| D_VDD | 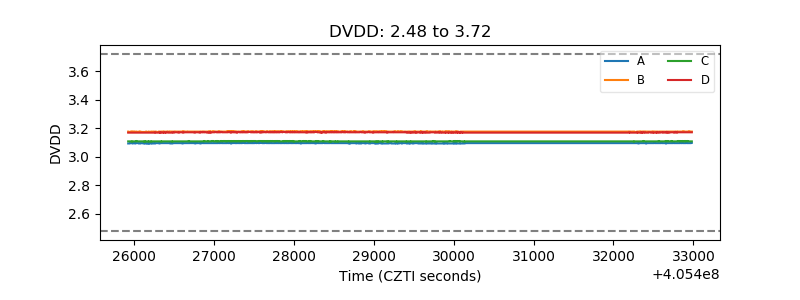 |
| Temperature 1 | 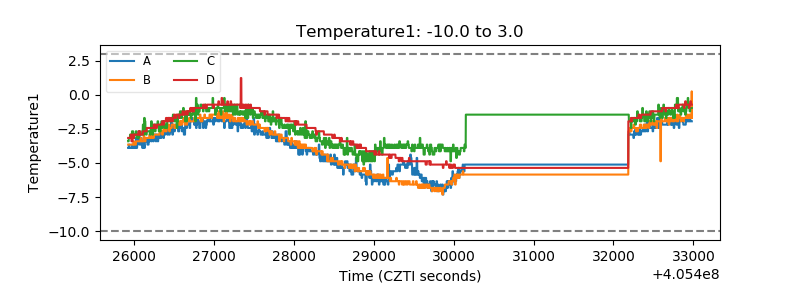 |
| Veto HV Monitor | 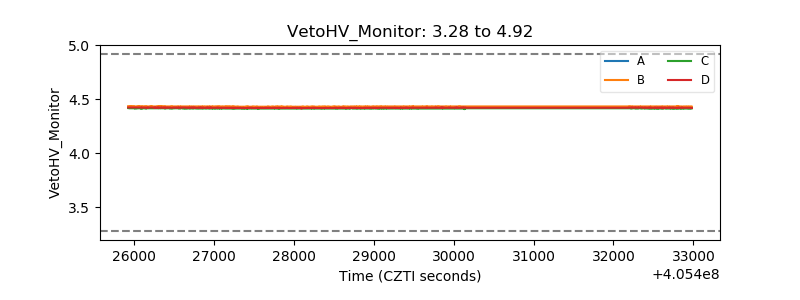 |
| Veto LLD | 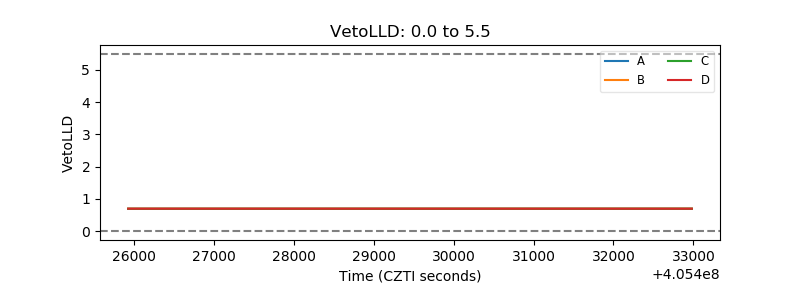 |
| Alpha Counter | 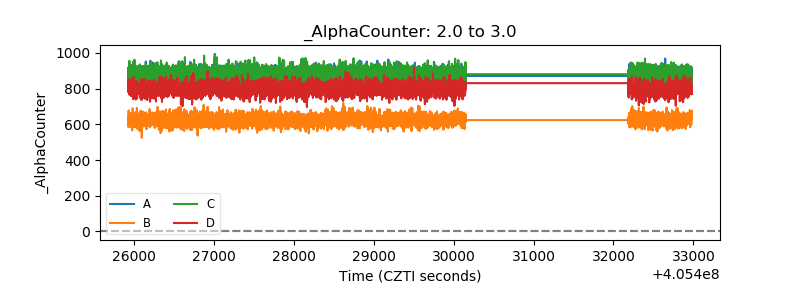 |
| _CPM_Rate | 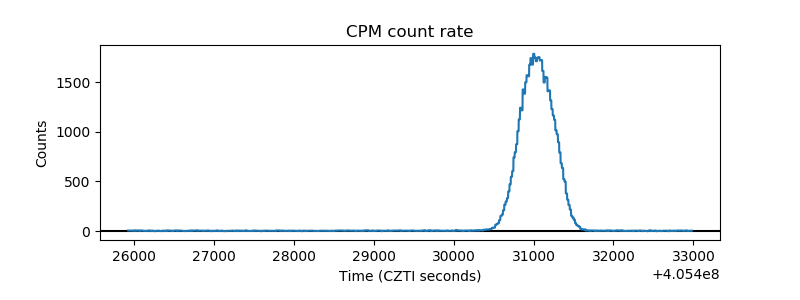 |
| CZT Counter | 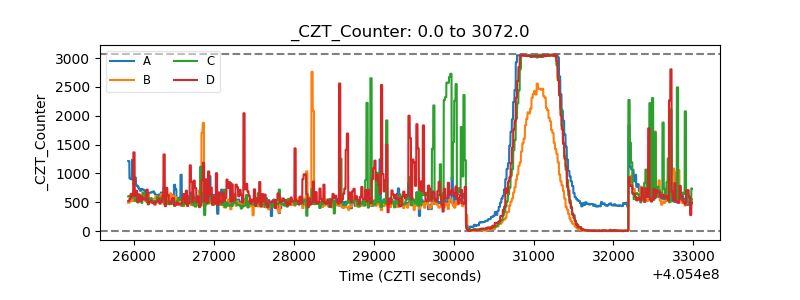 |
| +2.5 Volts monitor | 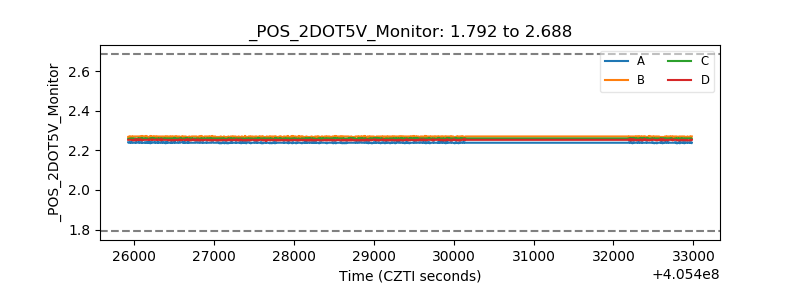 |
| +5 Volts monitor | 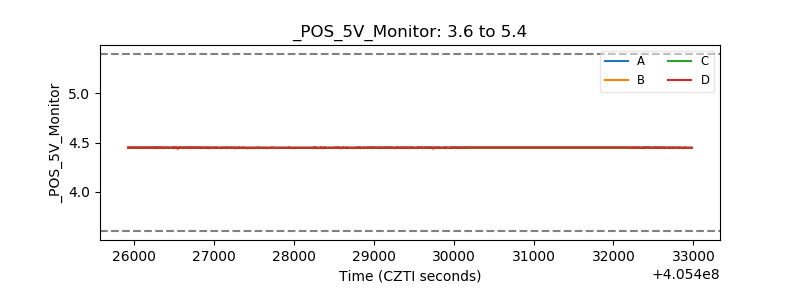 |
| _ROLL_ROT | 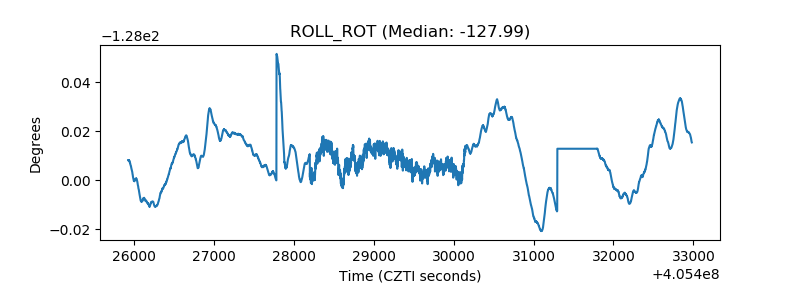 |
| _Roll_DEC | 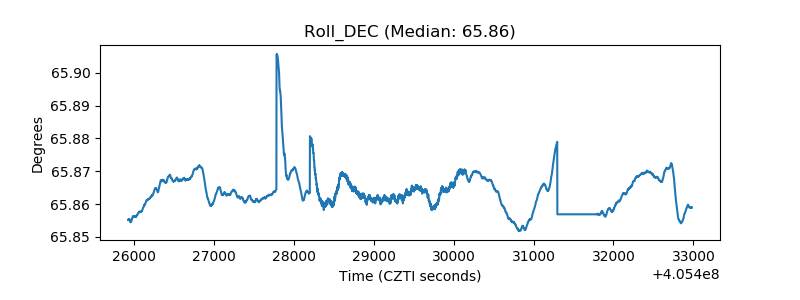 |
| _Roll_RA | 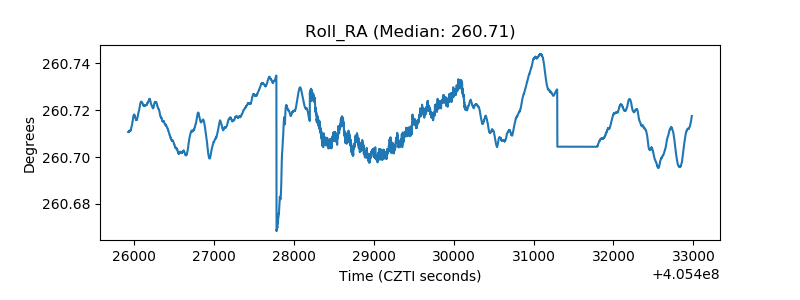 |
| Veto Counter | 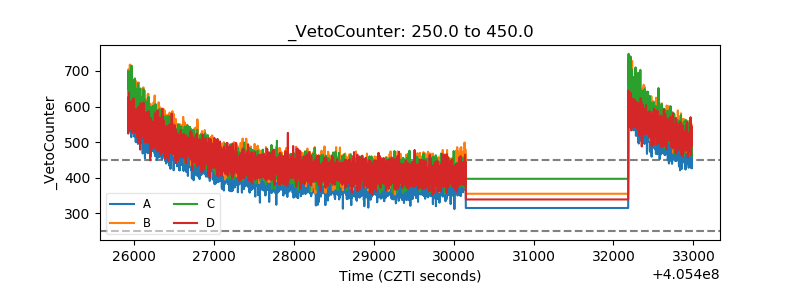 |