| Param | Original file | Final file |
|---|---|---|
| Filename | modeM0/AS1A12_018T01_9000005386_38433cztM0_level2.fits | modeM0/AS1A12_018T01_9000005386_38433cztM0_level2_quad_clean.evt |
| Size (bytes) | 384,523,200 | 97,894,080 |
| Size | 366.7 MB | 93.4 MB |
| Events in quadrant A | 3,037,876 | 689,530 |
| Events in quadrant B | 3,312,549 | 667,819 |
| Events in quadrant C | 3,601,648 | 636,196 |
| Events in quadrant D | 3,875,735 | 605,483 |
| Mode SS | |||
|---|---|---|---|
| Quadrant | BADHDUFLAG | Total packets | Discarded packets |
| A | 0 | 106 | 0 |
| B | 0 | 106 | 0 |
| C | 0 | 106 | 0 |
| D | 0 | 106 | 0 |
| Mode M9 | |||
|---|---|---|---|
| Quadrant | BADHDUFLAG | Total packets | Discarded packets |
| A | 0 | 24 | 0 |
| B | 0 | 24 | 0 |
| C | 0 | 24 | 0 |
| D | 0 | 25 | 0 |
| Mode M0 | |||
|---|---|---|---|
| Quadrant | BADHDUFLAG | Total packets | Discarded packets |
| A | 0 | 12126 | 3 |
| B | 0 | 13054 | 2 |
| C | 0 | 13829 | 2 |
| D | 0 | 15196 | 2 |
| Quadrant | Total seconds | Saturated seconds | Saturation percentage |
|---|---|---|---|
| A | 5219 | 31 | 0.593984% |
| B | 5219 | 220 | 4.215367% |
| C | 5219 | 243 | 4.656064% |
| D | 5219 | 133 | 2.548381% |
Noise dominated data is calculated using 1-second bins in cleaned event files. If a bin has >2000 counts, and if more than 50% of those come from <1% of pixels, then it is considered to be noise-dominated and hence unusable.
| Quadrant | # 1 sec bins | Bins with >0 counts | Bins with >2000 counts | High rate bins dominated by noise | Noise dominated (total time) | Noise dominated (detector-on time) | Marked lightcurve |
|---|---|---|---|---|---|---|---|
| A | 7313 | 5220 | 20 | 20 | 0.27% | 0.38% | 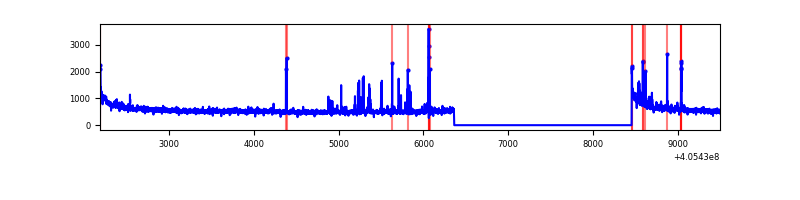 |
| B | 7313 | 5220 | 162 | 162 | 2.22% | 3.10% | 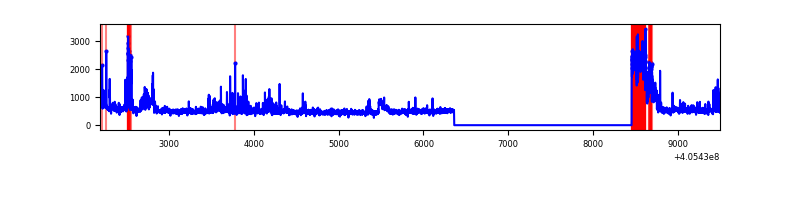 |
| C | 7313 | 5220 | 186 | 186 | 2.54% | 3.56% | 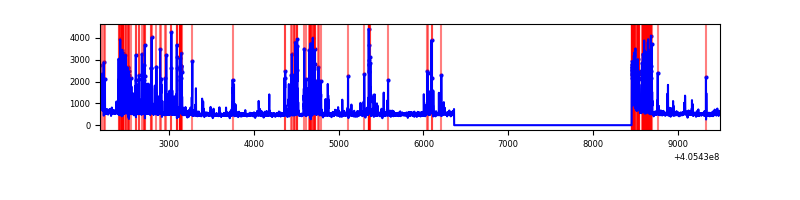 |
| D | 7313 | 5220 | 103 | 103 | 1.41% | 1.97% | 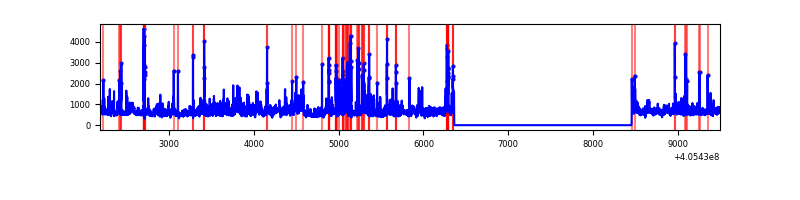 |
Top three noisy pixels from each quadrant. If the there are fewer than three noisy pixels in the level2.evt file, extra rows are filled as -1
| Pixel properties | Quadrant properties | ||||||
|---|---|---|---|---|---|---|---|
| Quadrant | DetID | PixID | Counts | Sigma | Mean | Median | Sigma |
| A | 10 | 83 | 418849 | 3341.58 | 626 | 614 | 125.2 |
| A | 13 | 248 | 79772 | 632.45 | 626 | 614 | 125.2 |
| A | 9 | 143 | 60580 | 479.11 | 626 | 614 | 125.2 |
| B | 5 | 184 | 565913 | 4961.99 | 610 | 595 | 113.9 |
| B | 0 | 186 | 77694 | 676.72 | 610 | 595 | 113.9 |
| B | 0 | 183 | 72336 | 629.7 | 610 | 595 | 113.9 |
| C | 4 | 254 | 962438 | 7016.59 | 599 | 602 | 137.1 |
| C | 15 | 214 | 218623 | 1590.46 | 599 | 602 | 137.1 |
| C | 0 | 10 | 36734 | 263.58 | 599 | 602 | 137.1 |
| D | 12 | 235 | 401021 | 2765.71 | 610 | 595 | 144.8 |
| D | 13 | 200 | 262487 | 1808.87 | 610 | 595 | 144.8 |
| D | 13 | 249 | 257318 | 1773.16 | 610 | 595 | 144.8 |
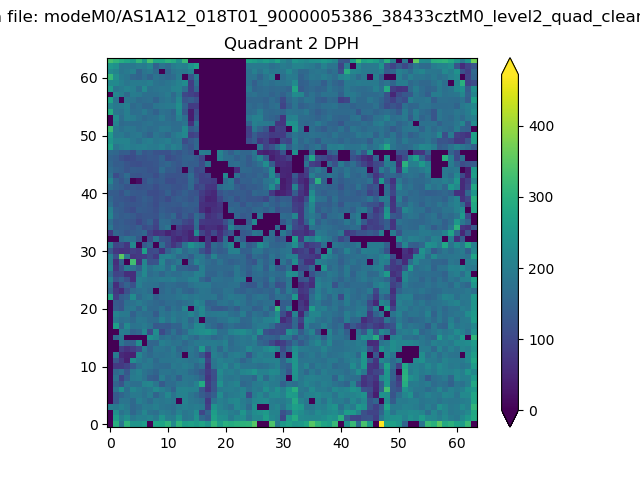
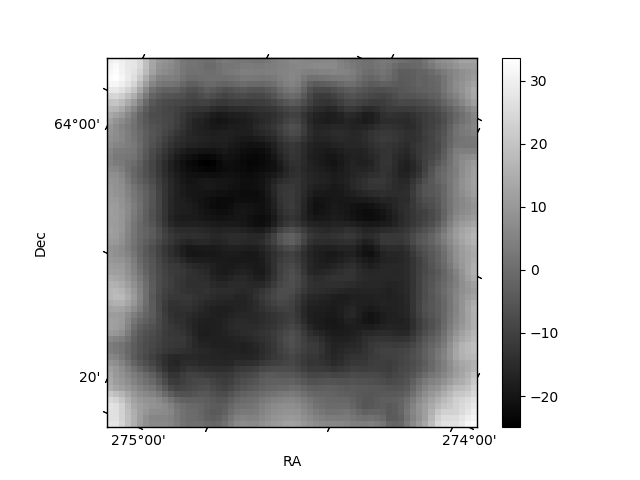
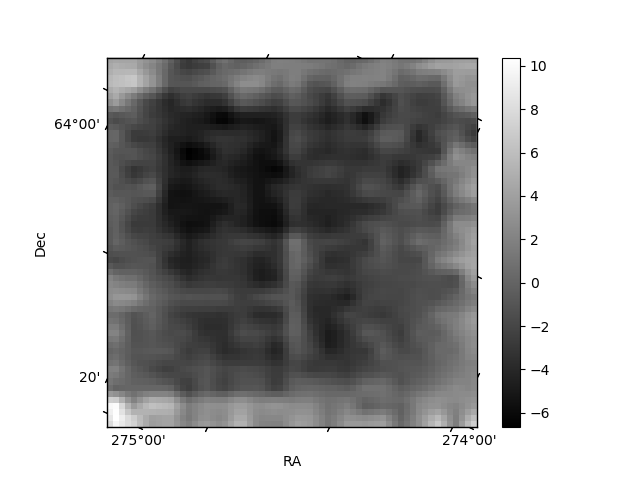
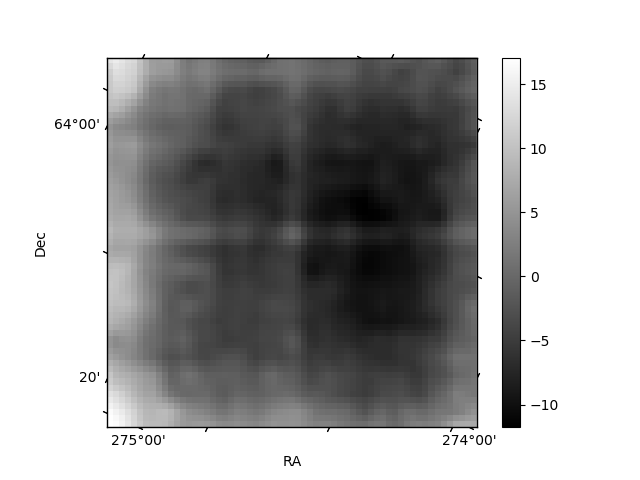
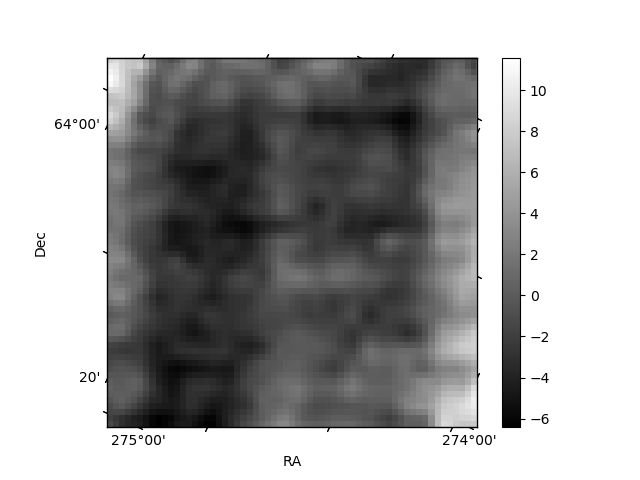
Histogram calculated using DETX and DETY for each event in the final _common_clean file
| Quadrant A | 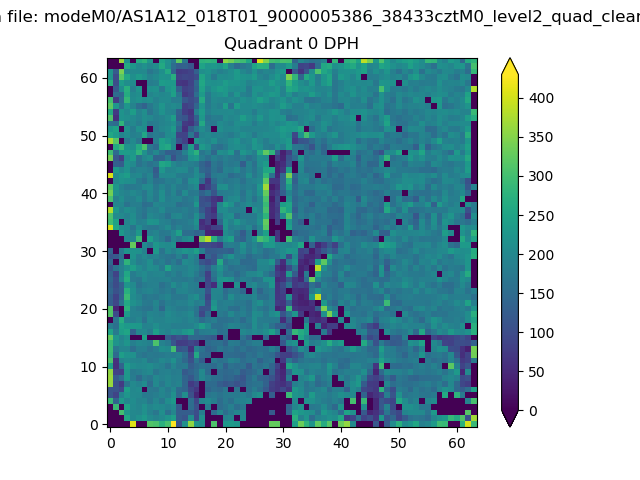 |
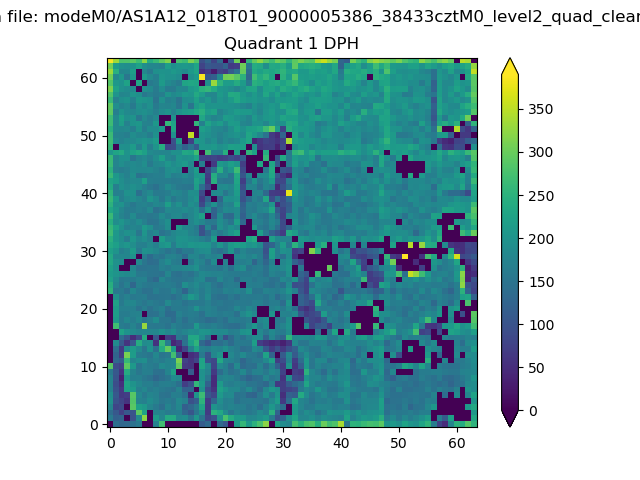 |
Quadrant B |
|---|---|---|---|
| Quadrant D | 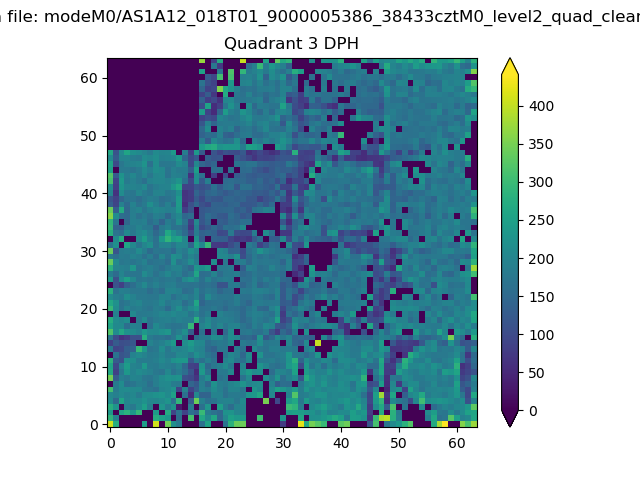 |
 |
Quadrant C |
| Plot type | Count rate plots | Images |
|---|---|---|
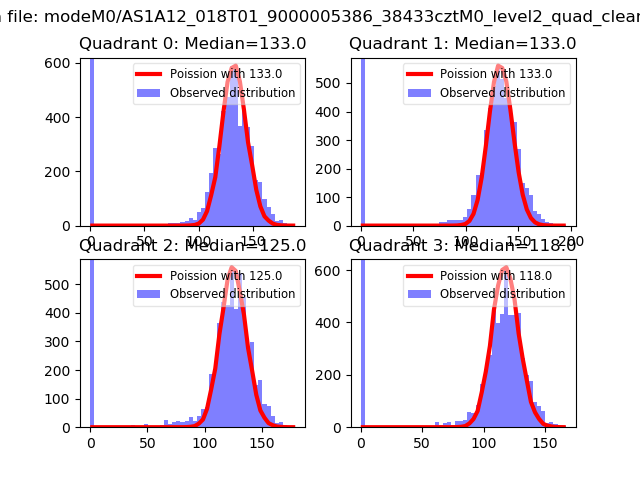
| Comparison with Poisson distribution Blue bars denote a histogram of data divided into 1 sec bins. Red curve is a Poisson curve with rate = median count rate of data. |
 |
 |
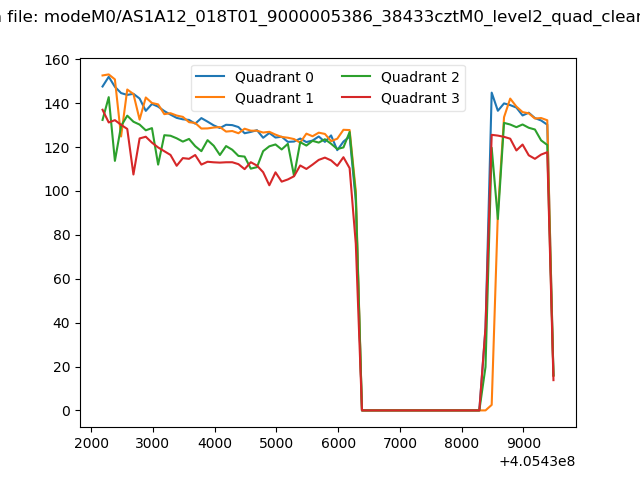
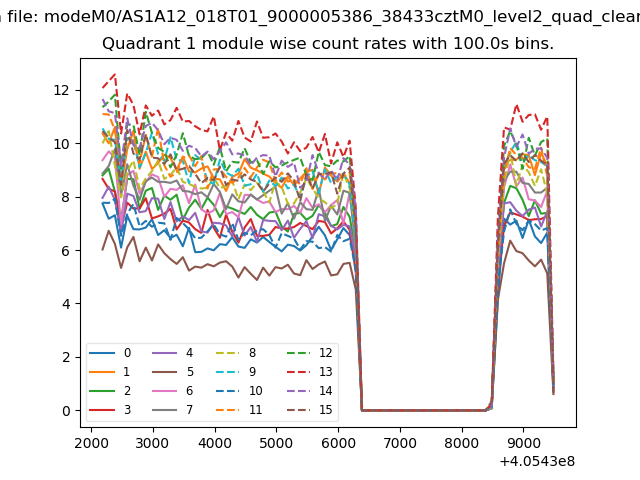
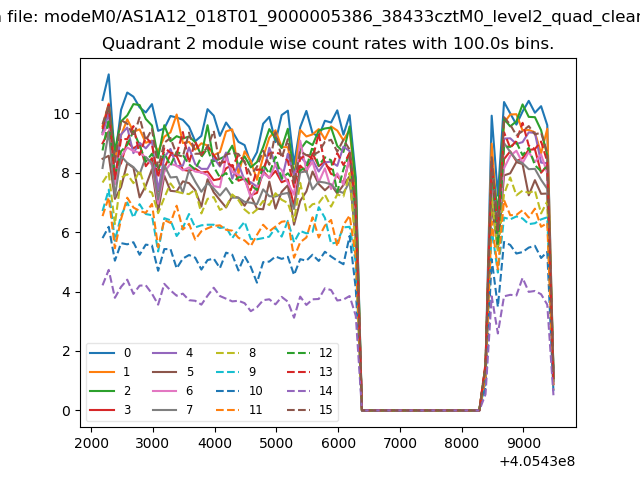
| Quadrant-wise count rates Data is divided into 100 sec bins |
 |
|
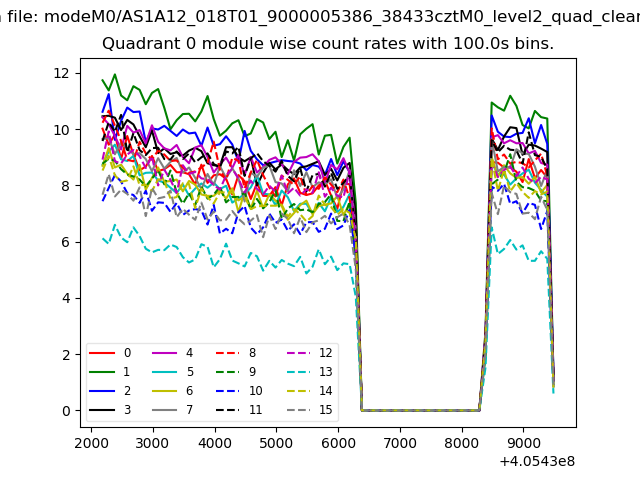
| Module-wise count rates for Quadrant A Data is divided into 100 sec bins |
 |
 |
| Module-wise count rates for Quadrant B Data is divided into 100 sec bins |
 |
 |
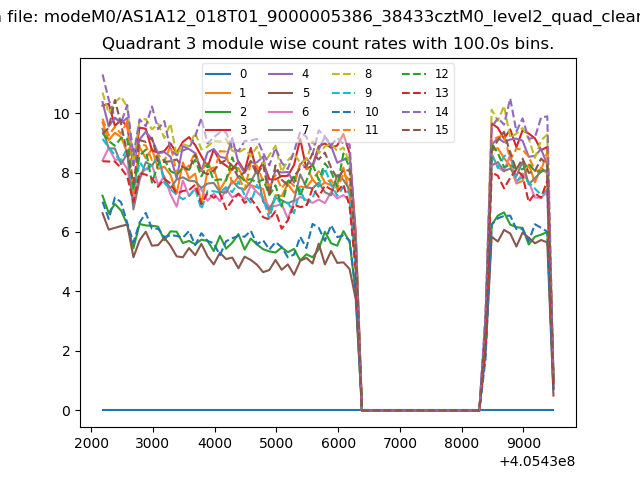
| Module-wise count rates for Quadrant C Data is divided into 100 sec bins |
 |
 |
| Module-wise count rates for Quadrant D Data is divided into 100 sec bins |
 |
 |
| Parameter | Plot |
|---|---|
| CZT HV Monitor | 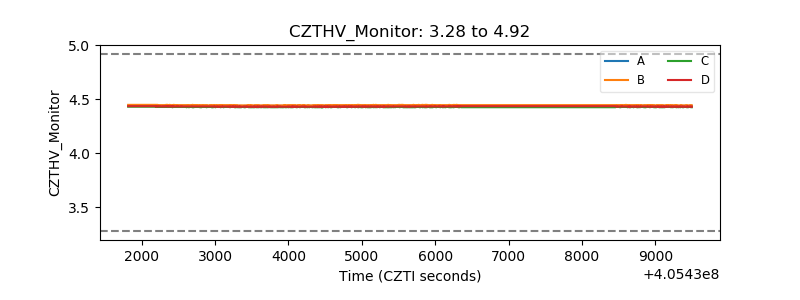 |
| D_VDD | 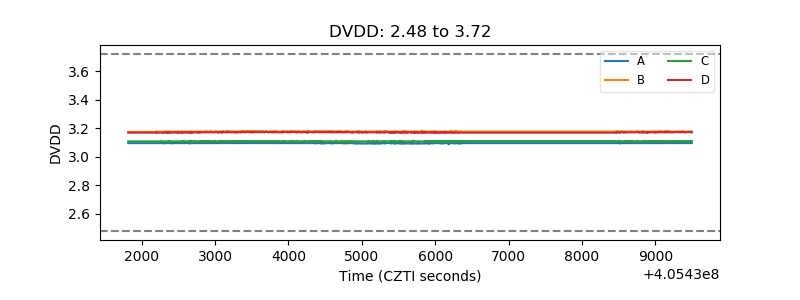 |
| Temperature 1 | 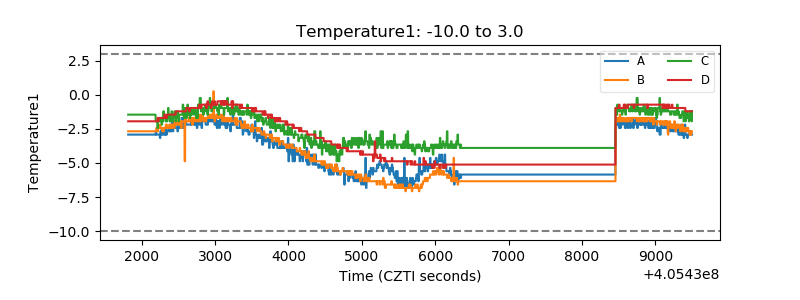 |
| Veto HV Monitor | 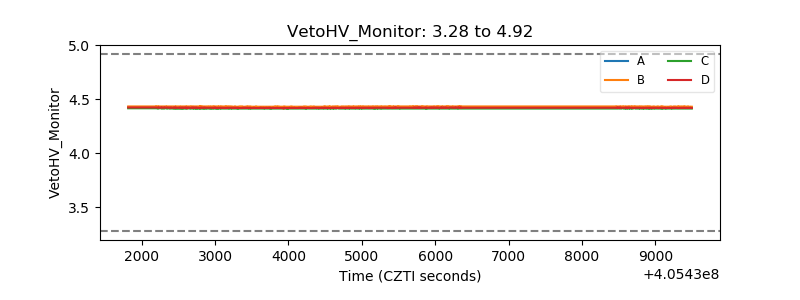 |
| Veto LLD | 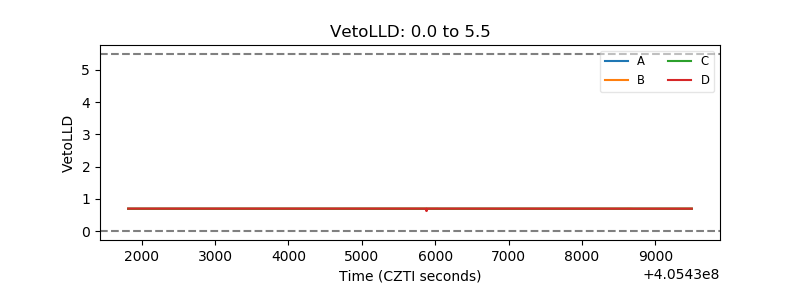 |
| Alpha Counter |  |
| _CPM_Rate | 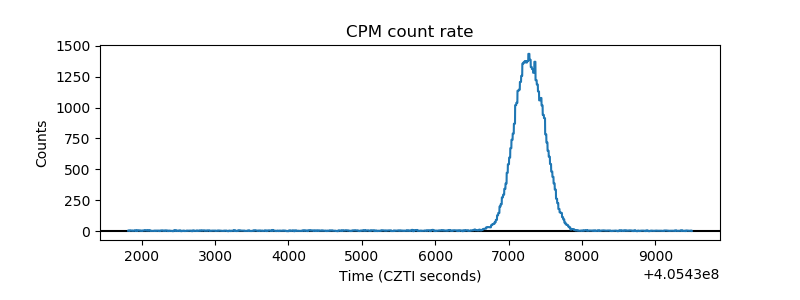 |
| CZT Counter | 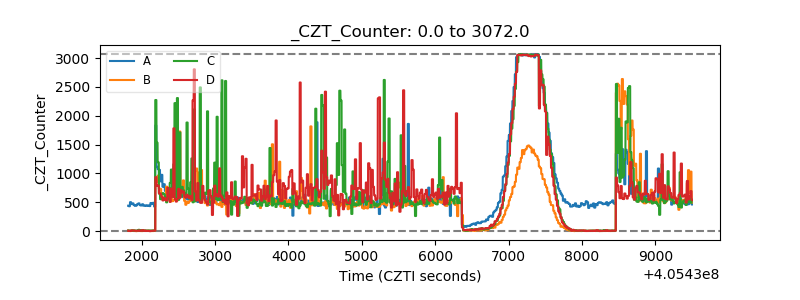 |
| +2.5 Volts monitor |  |
| +5 Volts monitor | 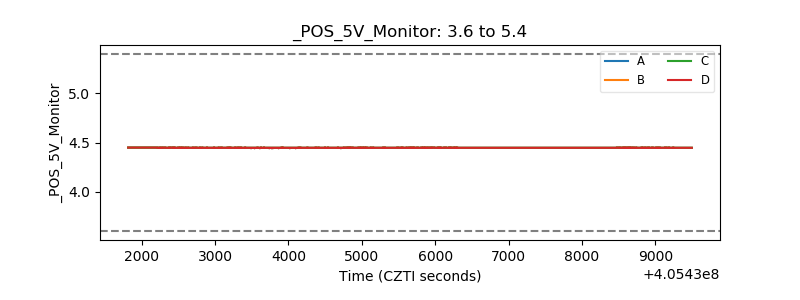 |
| _ROLL_ROT | 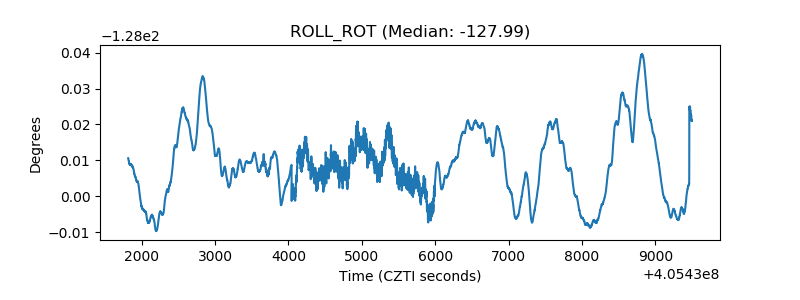 |
| _Roll_DEC | 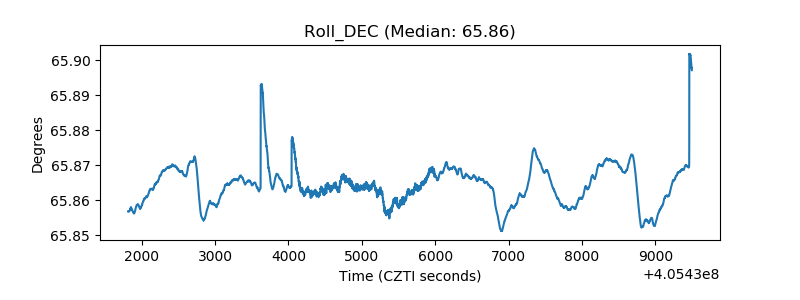 |
| _Roll_RA | 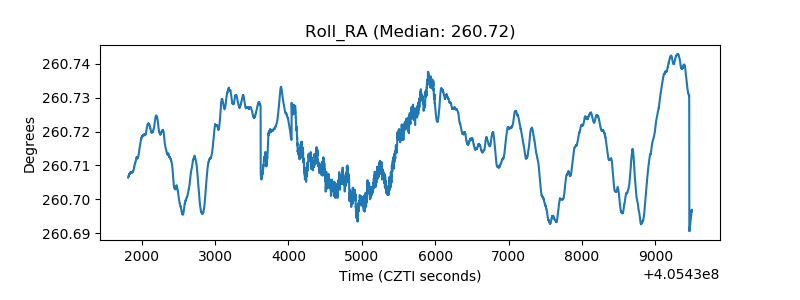 |
| Veto Counter | 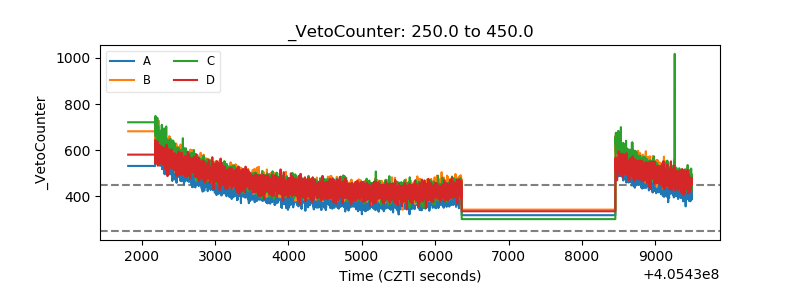 |