| Param | Original file | Final file |
|---|---|---|
| Filename | modeM0/AS1A12_018T01_9000005386_38434cztM0_level2.fits | modeM0/AS1A12_018T01_9000005386_38434cztM0_level2_quad_clean.evt |
| Size (bytes) | 396,875,520 | 89,311,680 |
| Size | 378.5 MB | 85.2 MB |
| Events in quadrant A | 2,824,136 | 637,070 |
| Events in quadrant B | 3,585,802 | 614,733 |
| Events in quadrant C | 2,883,344 | 606,818 |
| Events in quadrant D | 5,005,368 | 492,460 |
| Mode SS | |||
|---|---|---|---|
| Quadrant | BADHDUFLAG | Total packets | Discarded packets |
| A | 0 | 102 | 0 |
| B | 0 | 102 | 0 |
| C | 0 | 102 | 0 |
| D | 0 | 102 | 0 |
| Mode M9 | |||
|---|---|---|---|
| Quadrant | BADHDUFLAG | Total packets | Discarded packets |
| A | 0 | 22 | 0 |
| B | 0 | 22 | 0 |
| C | 0 | 22 | 0 |
| D | 0 | 22 | 0 |
| Mode M0 | |||
|---|---|---|---|
| Quadrant | BADHDUFLAG | Total packets | Discarded packets |
| A | 0 | 11444 | 3 |
| B | 0 | 13812 | 2 |
| C | 0 | 11482 | 2 |
| D | 0 | 18336 | 2 |
| Quadrant | Total seconds | Saturated seconds | Saturation percentage |
|---|---|---|---|
| A | 5043 | 17 | 0.337101% |
| B | 5043 | 284 | 5.631569% |
| C | 5043 | 82 | 1.626016% |
| D | 5043 | 804 | 15.942891% |
Noise dominated data is calculated using 1-second bins in cleaned event files. If a bin has >2000 counts, and if more than 50% of those come from <1% of pixels, then it is considered to be noise-dominated and hence unusable.
| Quadrant | # 1 sec bins | Bins with >0 counts | Bins with >2000 counts | High rate bins dominated by noise | Noise dominated (total time) | Noise dominated (detector-on time) | Marked lightcurve |
|---|---|---|---|---|---|---|---|
| A | 7167 | 5044 | 12 | 12 | 0.17% | 0.24% | 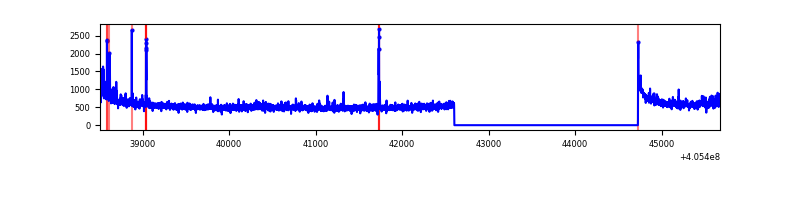 |
| B | 7167 | 5044 | 211 | 211 | 2.94% | 4.18% | 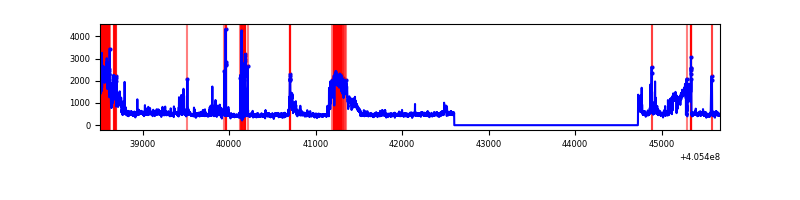 |
| C | 7167 | 5044 | 66 | 66 | 0.92% | 1.31% | 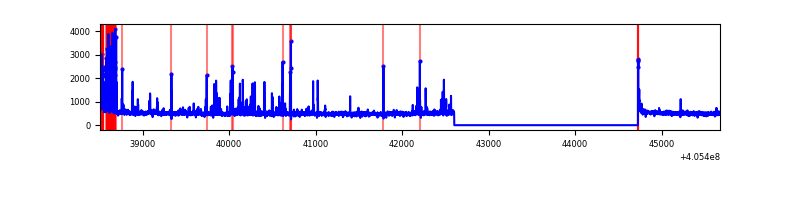 |
| D | 7167 | 5044 | 679 | 679 | 9.47% | 13.46% | 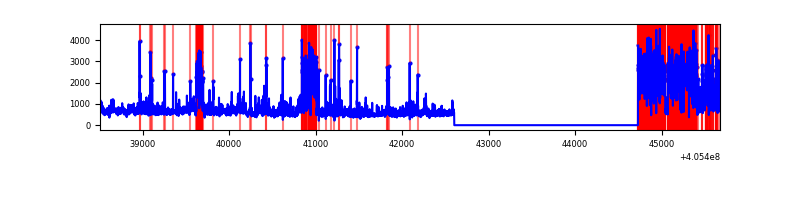 |
Top three noisy pixels from each quadrant. If the there are fewer than three noisy pixels in the level2.evt file, extra rows are filled as -1
| Pixel properties | Quadrant properties | ||||||
|---|---|---|---|---|---|---|---|
| Quadrant | DetID | PixID | Counts | Sigma | Mean | Median | Sigma |
| A | 10 | 83 | 381452 | 3251.99 | 587 | 576 | 117.1 |
| A | 13 | 248 | 82710 | 701.28 | 587 | 576 | 117.1 |
| A | 9 | 143 | 26948 | 225.17 | 587 | 576 | 117.1 |
| B | 5 | 184 | 788766 | 7311.66 | 572 | 558 | 107.8 |
| B | 0 | 229 | 204324 | 1890.2 | 572 | 558 | 107.8 |
| B | 4 | 232 | 106981 | 987.21 | 572 | 558 | 107.8 |
| C | 4 | 254 | 319495 | 2440.91 | 574 | 579 | 130.7 |
| C | 15 | 214 | 212530 | 1622.23 | 574 | 579 | 130.7 |
| C | 2 | 16 | 66928 | 507.82 | 574 | 579 | 130.7 |
| D | 2 | 16 | 1484358 | 11303.54 | 547 | 534 | 131.3 |
| D | 12 | 235 | 351299 | 2672.07 | 547 | 534 | 131.3 |
| D | 12 | 227 | 339877 | 2585.06 | 547 | 534 | 131.3 |
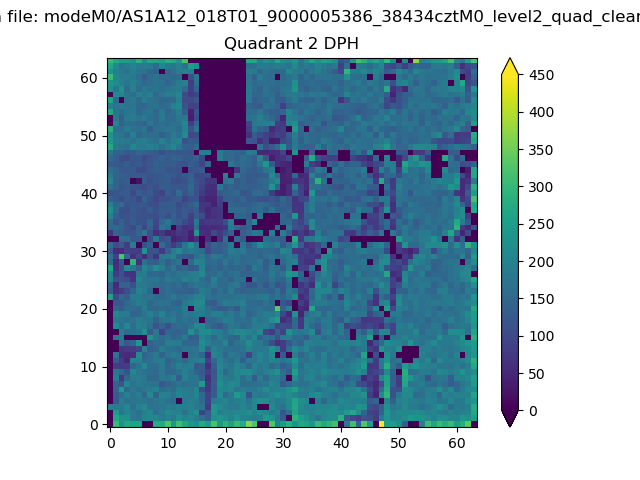
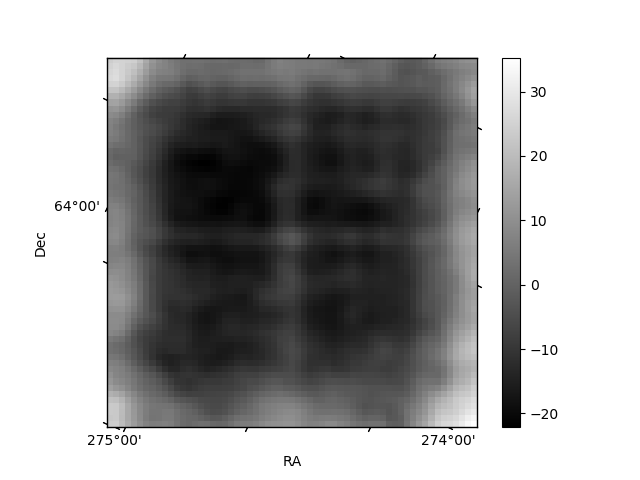
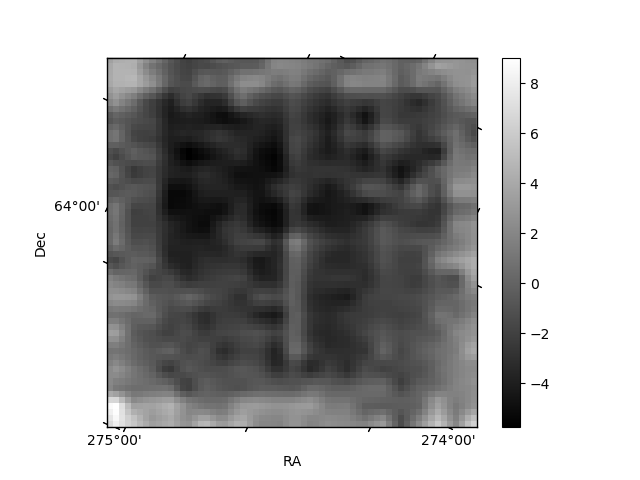
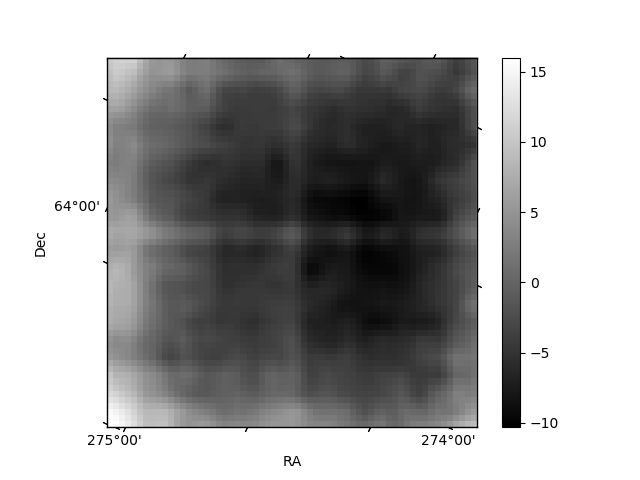
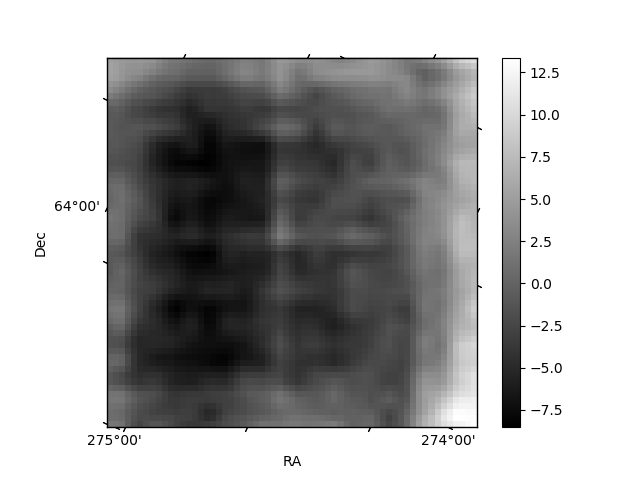
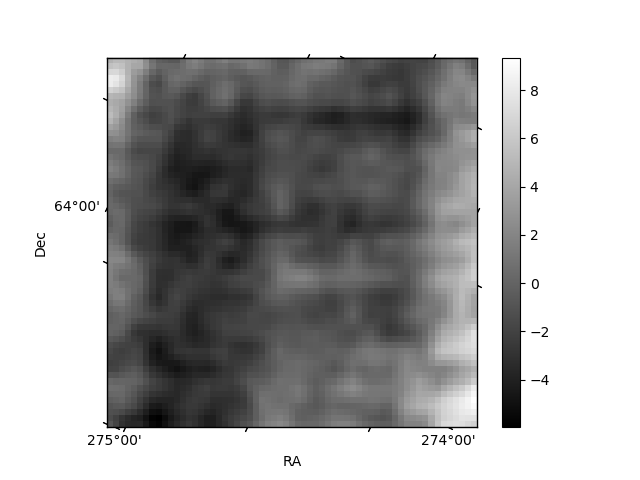
Histogram calculated using DETX and DETY for each event in the final _common_clean file
| Quadrant A | 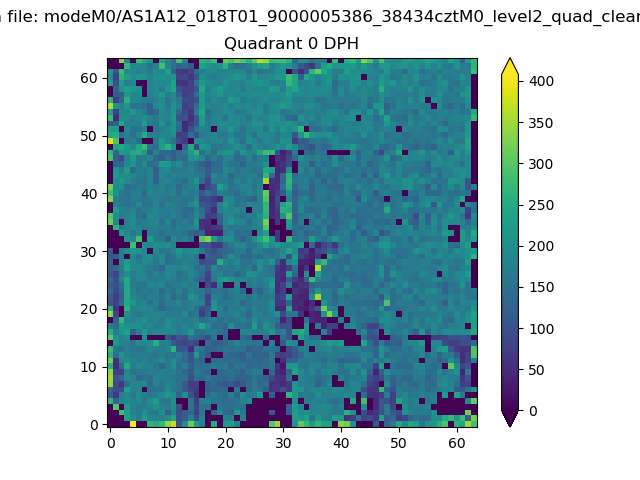 |
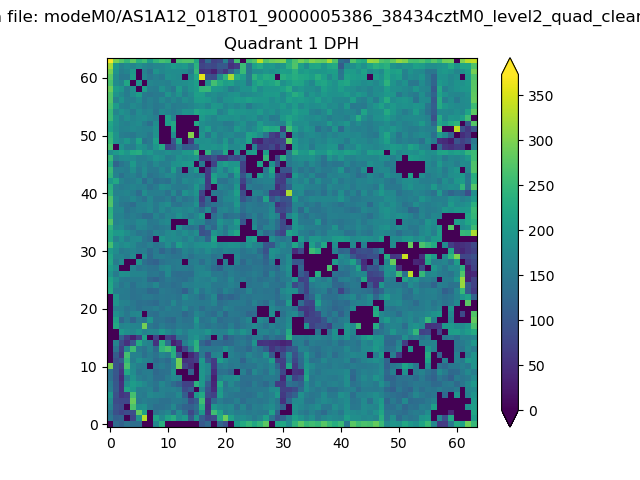 |
Quadrant B |
|---|---|---|---|
| Quadrant D | 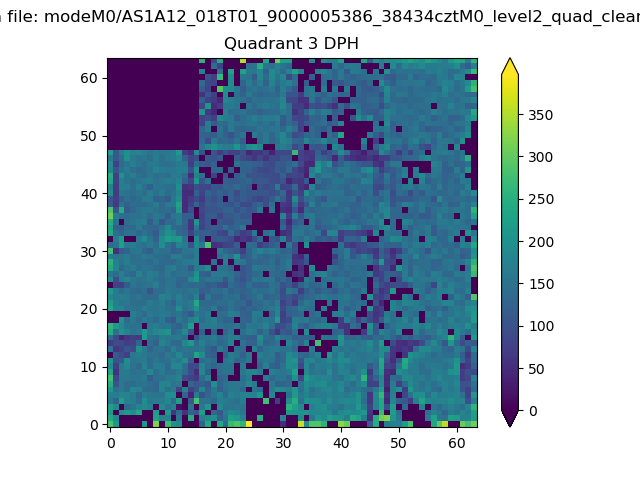 |
 |
Quadrant C |
| Plot type | Count rate plots | Images |
|---|---|---|
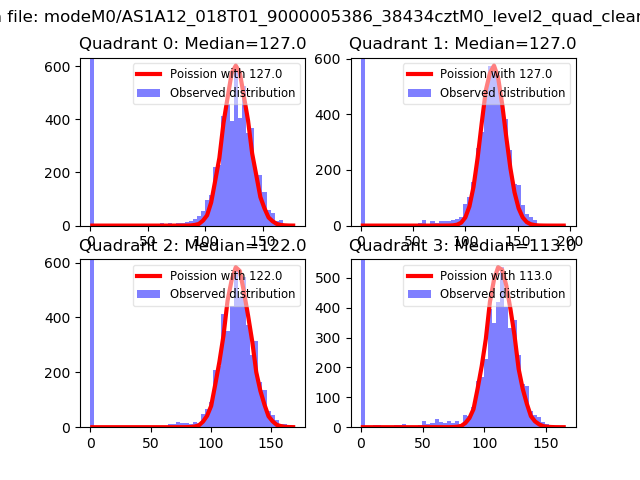
| Comparison with Poisson distribution Blue bars denote a histogram of data divided into 1 sec bins. Red curve is a Poisson curve with rate = median count rate of data. |
 |
 |
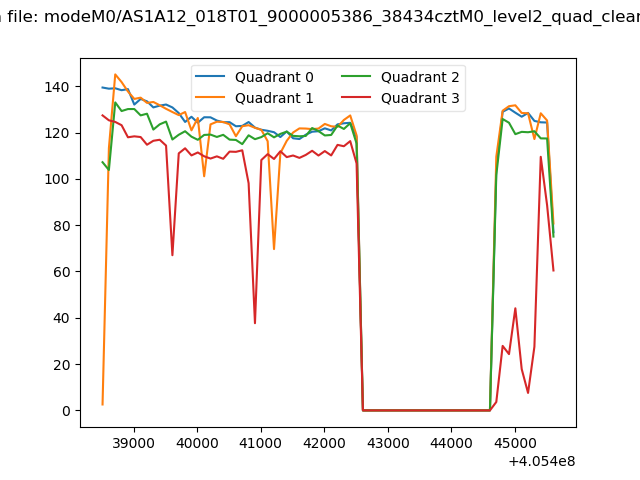
| Quadrant-wise count rates Data is divided into 100 sec bins |
 |
|
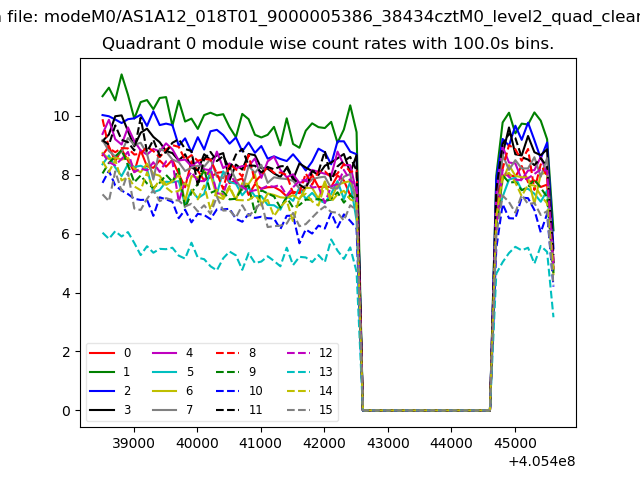
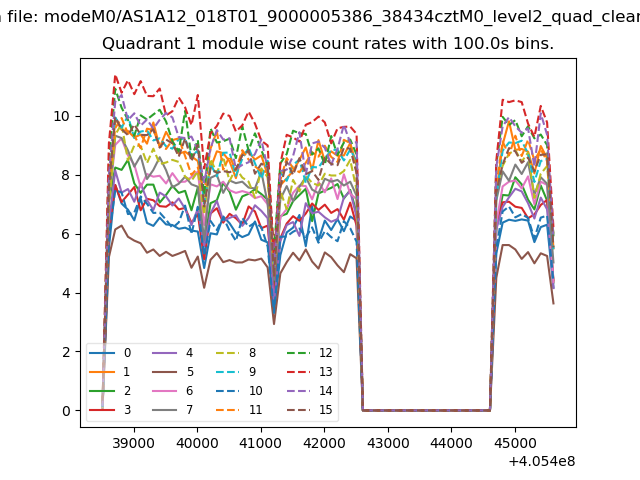
| Module-wise count rates for Quadrant A Data is divided into 100 sec bins |
 |
 |
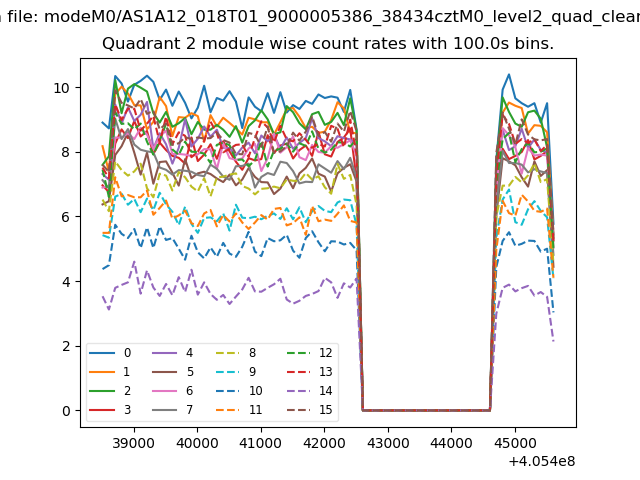
| Module-wise count rates for Quadrant B Data is divided into 100 sec bins |
 |
 |
| Module-wise count rates for Quadrant C Data is divided into 100 sec bins |
 |
 |
| Module-wise count rates for Quadrant D Data is divided into 100 sec bins |
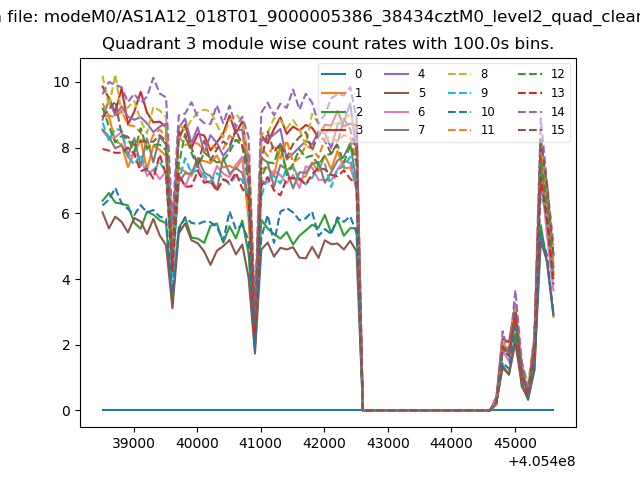 |
 |
| Parameter | Plot |
|---|---|
| CZT HV Monitor | 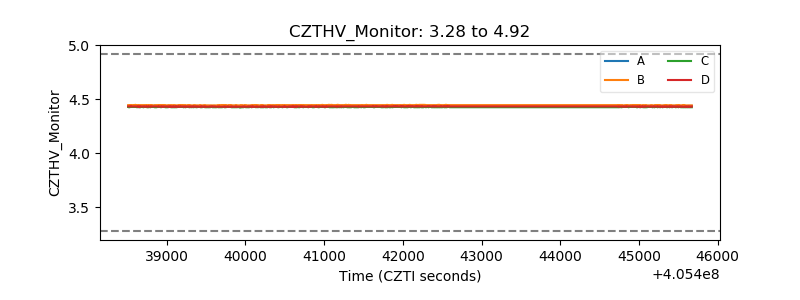 |
| D_VDD | 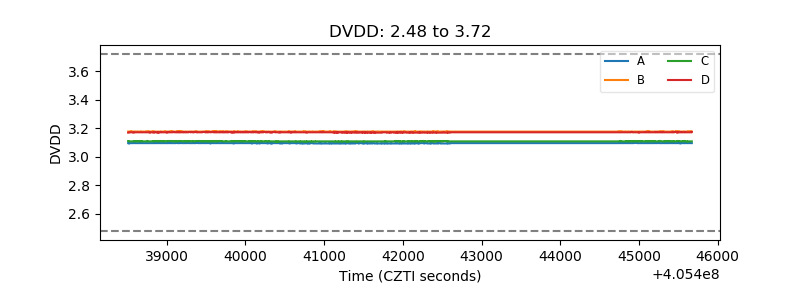 |
| Temperature 1 | 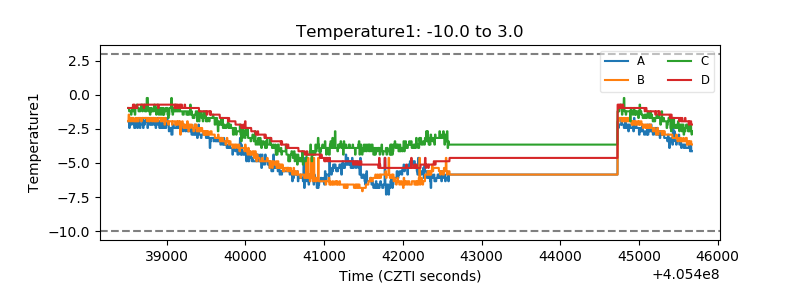 |
| Veto HV Monitor | 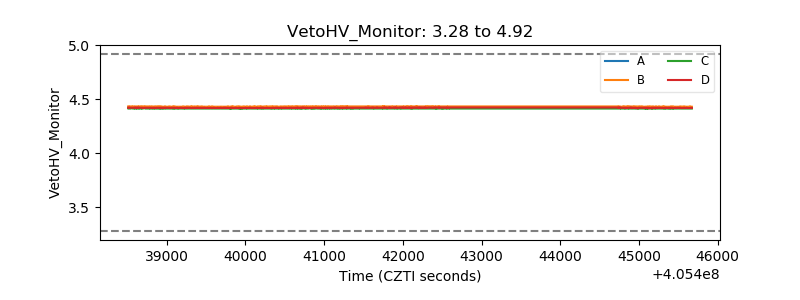 |
| Veto LLD | 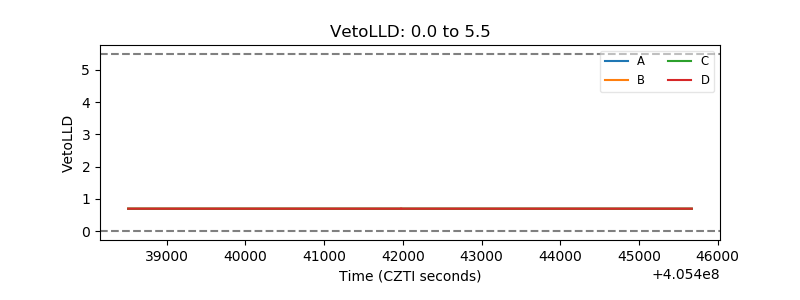 |
| Alpha Counter | 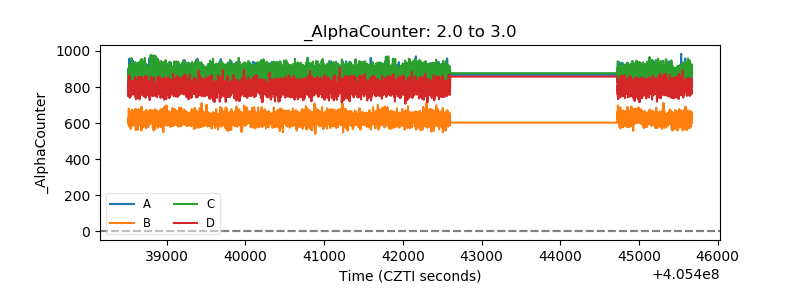 |
| _CPM_Rate | 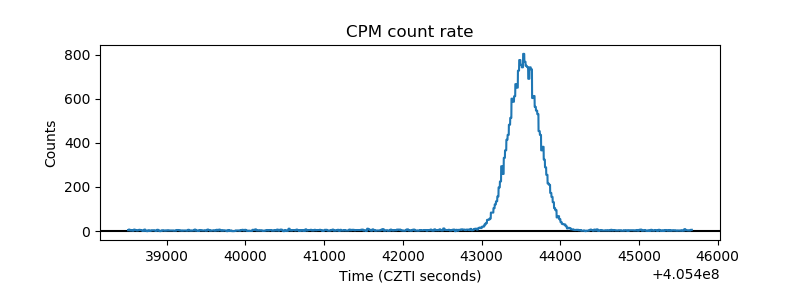 |
| CZT Counter | 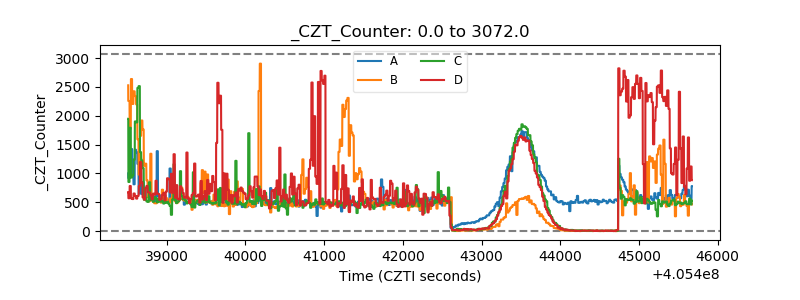 |
| +2.5 Volts monitor | 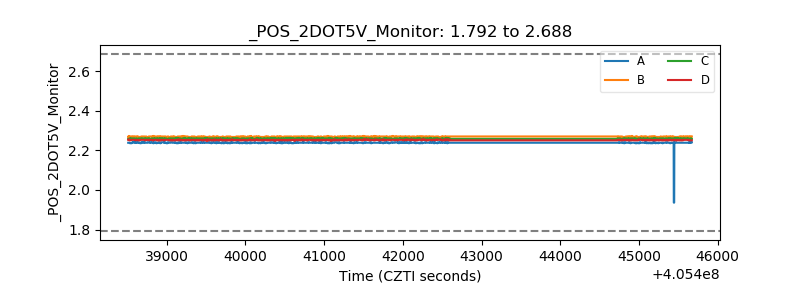 |
| +5 Volts monitor | 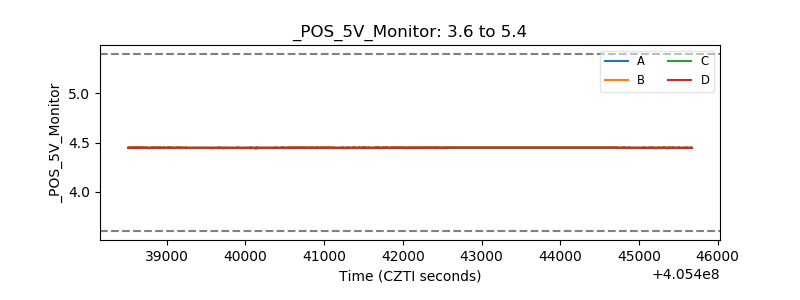 |
| _ROLL_ROT | 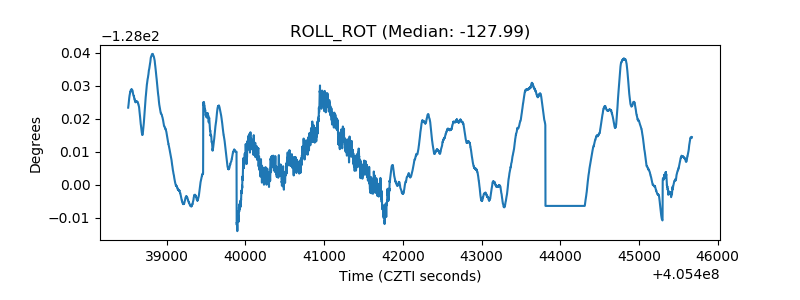 |
| _Roll_DEC | 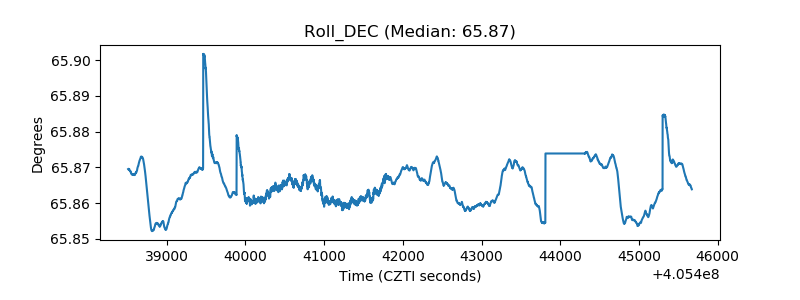 |
| _Roll_RA | 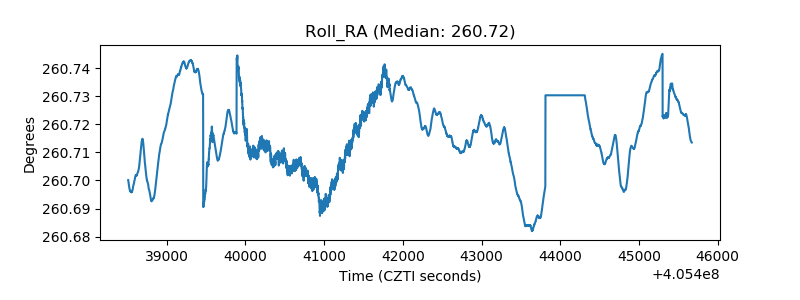 |
| Veto Counter | 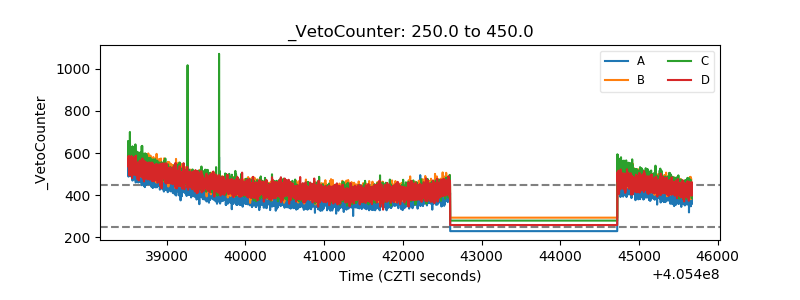 |