| Param | Original file | Final file |
|---|---|---|
| Filename | modeM0/AS1A12_018T01_9000005386_38435cztM0_level2.fits | modeM0/AS1A12_018T01_9000005386_38435cztM0_level2_quad_clean.evt |
| Size (bytes) | 401,880,960 | 85,605,120 |
| Size | 383.3 MB | 81.6 MB |
| Events in quadrant A | 2,838,345 | 597,495 |
| Events in quadrant B | 2,969,001 | 603,717 |
| Events in quadrant C | 2,494,680 | 583,497 |
| Events in quadrant D | 6,182,996 | 454,378 |
| Mode SS | |||
|---|---|---|---|
| Quadrant | BADHDUFLAG | Total packets | Discarded packets |
| A | 0 | 104 | 0 |
| B | 0 | 104 | 0 |
| C | 0 | 104 | 0 |
| D | 0 | 104 | 0 |
| Mode M9 | |||
|---|---|---|---|
| Quadrant | BADHDUFLAG | Total packets | Discarded packets |
| A | 0 | 24 | 0 |
| B | 0 | 24 | 0 |
| C | 0 | 24 | 0 |
| D | 0 | 25 | 0 |
| Mode M0 | |||
|---|---|---|---|
| Quadrant | BADHDUFLAG | Total packets | Discarded packets |
| A | 0 | 11616 | 3 |
| B | 0 | 11984 | 2 |
| C | 0 | 10390 | 2 |
| D | 0 | 21855 | 2 |
| Quadrant | Total seconds | Saturated seconds | Saturation percentage |
|---|---|---|---|
| A | 5031 | 44 | 0.874578% |
| B | 5031 | 91 | 1.808786% |
| C | 5031 | 17 | 0.337905% |
| D | 5031 | 981 | 19.499106% |
Noise dominated data is calculated using 1-second bins in cleaned event files. If a bin has >2000 counts, and if more than 50% of those come from <1% of pixels, then it is considered to be noise-dominated and hence unusable.
| Quadrant | # 1 sec bins | Bins with >0 counts | Bins with >2000 counts | High rate bins dominated by noise | Noise dominated (total time) | Noise dominated (detector-on time) | Marked lightcurve |
|---|---|---|---|---|---|---|---|
| A | 7094 | 5032 | 30 | 30 | 0.42% | 0.60% | 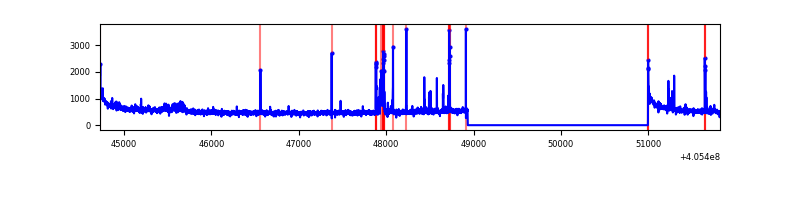 |
| B | 7094 | 5032 | 63 | 63 | 0.89% | 1.25% | 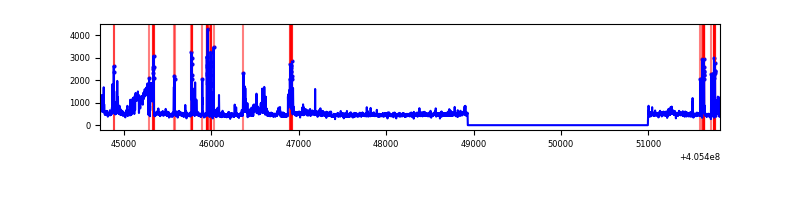 |
| C | 7094 | 5032 | 15 | 15 | 0.21% | 0.30% | 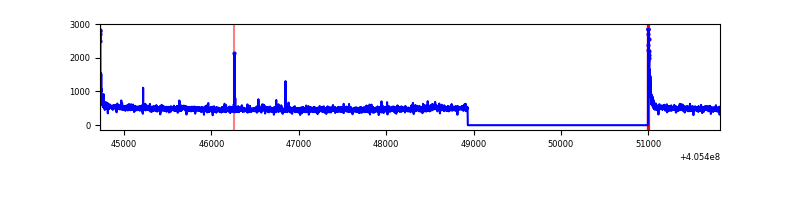 |
| D | 7094 | 5032 | 892 | 892 | 12.57% | 17.73% | 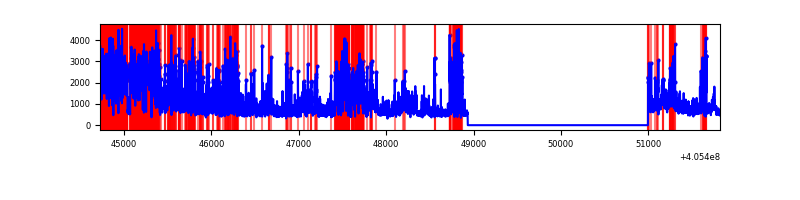 |
Top three noisy pixels from each quadrant. If the there are fewer than three noisy pixels in the level2.evt file, extra rows are filled as -1
| Pixel properties | Quadrant properties | ||||||
|---|---|---|---|---|---|---|---|
| Quadrant | DetID | PixID | Counts | Sigma | Mean | Median | Sigma |
| A | 10 | 83 | 403648 | 3534.14 | 564 | 552 | 114.1 |
| A | 9 | 143 | 167361 | 1462.49 | 564 | 552 | 114.1 |
| A | 12 | 16 | 34562 | 298.18 | 564 | 552 | 114.1 |
| B | 0 | 229 | 207298 | 1939.52 | 561 | 546 | 106.6 |
| B | 4 | 232 | 189426 | 1771.86 | 561 | 546 | 106.6 |
| B | 5 | 184 | 169938 | 1589.05 | 561 | 546 | 106.6 |
| C | 15 | 214 | 213525 | 1647.56 | 559 | 563 | 129.3 |
| C | 0 | 10 | 72473 | 556.33 | 559 | 563 | 129.3 |
| C | 4 | 221 | 10679 | 78.26 | 559 | 563 | 129.3 |
| D | 2 | 16 | 2928656 | 22809.61 | 521 | 505 | 128.4 |
| D | 13 | 249 | 467705 | 3639.38 | 521 | 505 | 128.4 |
| D | 2 | 250 | 272958 | 2122.35 | 521 | 505 | 128.4 |
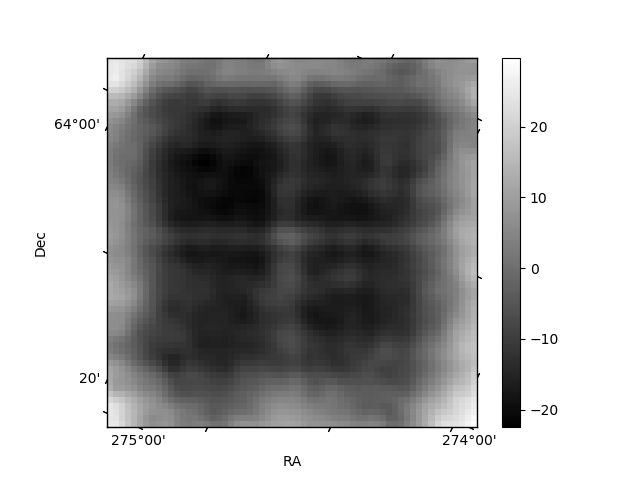
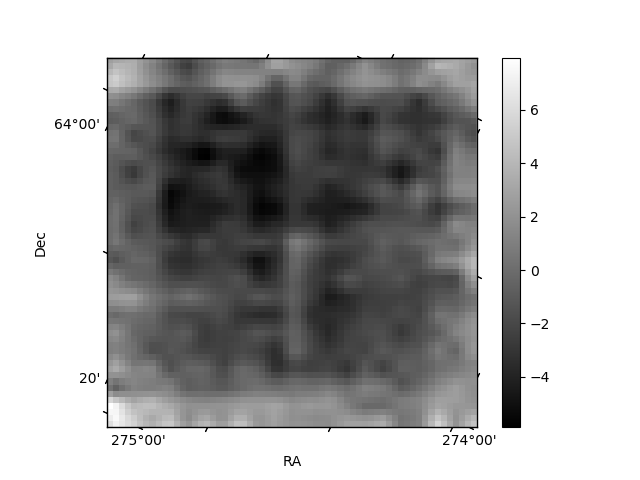
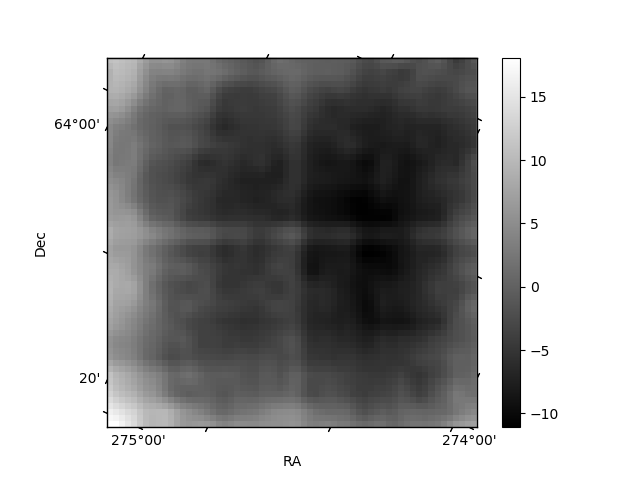
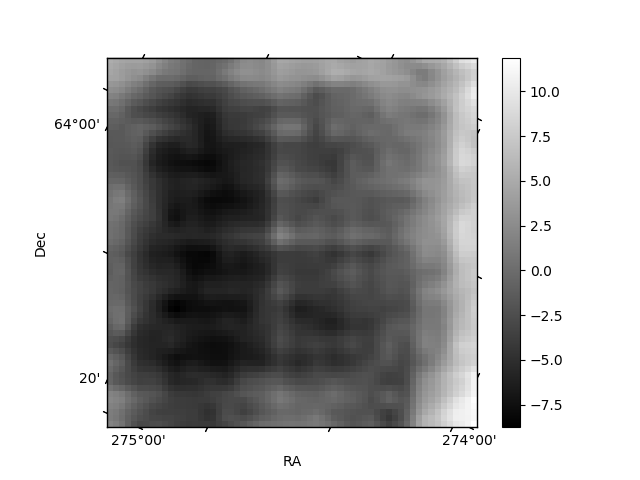
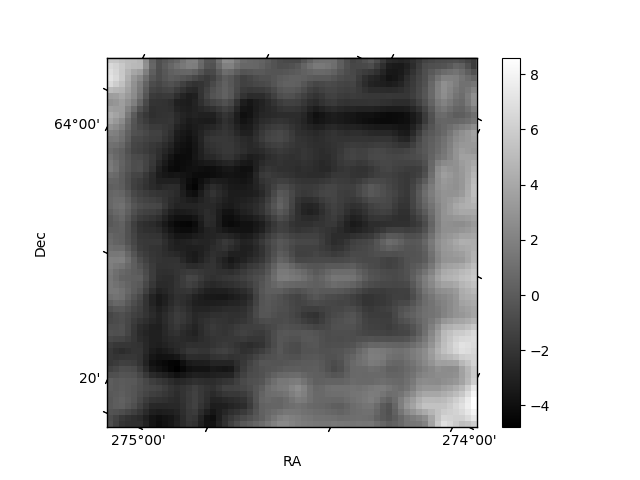
Histogram calculated using DETX and DETY for each event in the final _common_clean file
| Quadrant A | 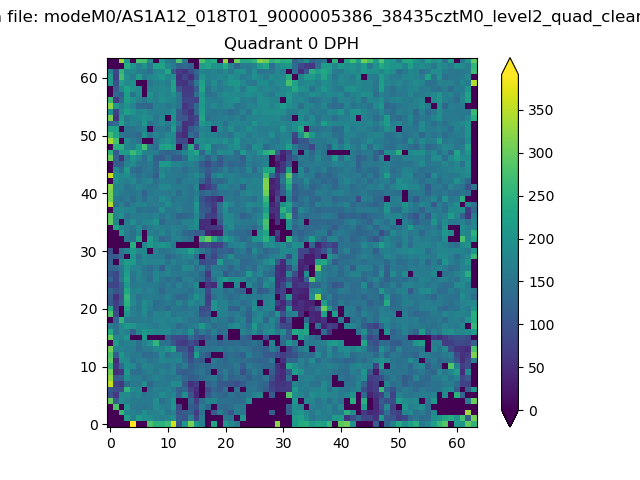 |
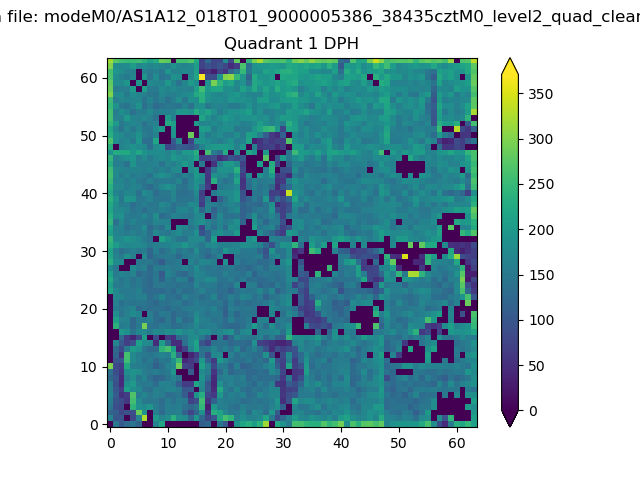 |
Quadrant B |
|---|---|---|---|
| Quadrant D | 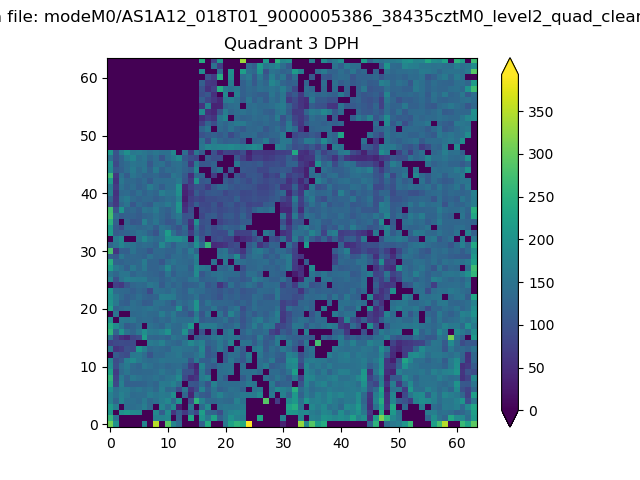 |
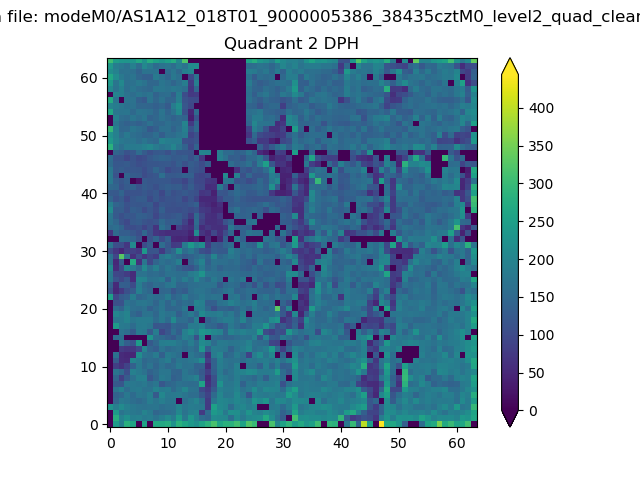 |
Quadrant C |
| Plot type | Count rate plots | Images |
|---|---|---|
| Comparison with Poisson distribution Blue bars denote a histogram of data divided into 1 sec bins. Red curve is a Poisson curve with rate = median count rate of data. |
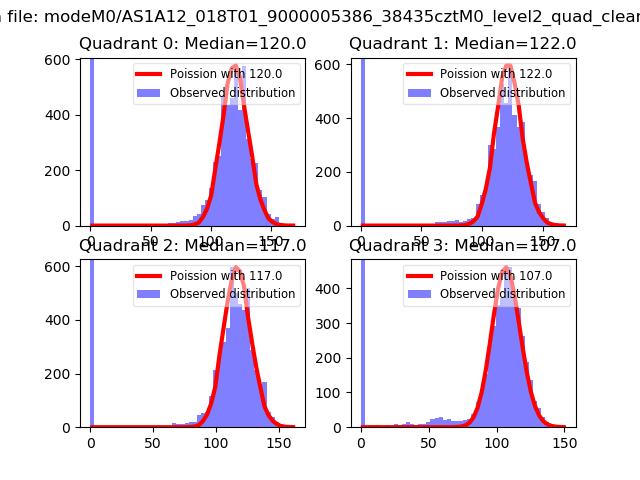 |
 |
| Quadrant-wise count rates Data is divided into 100 sec bins |
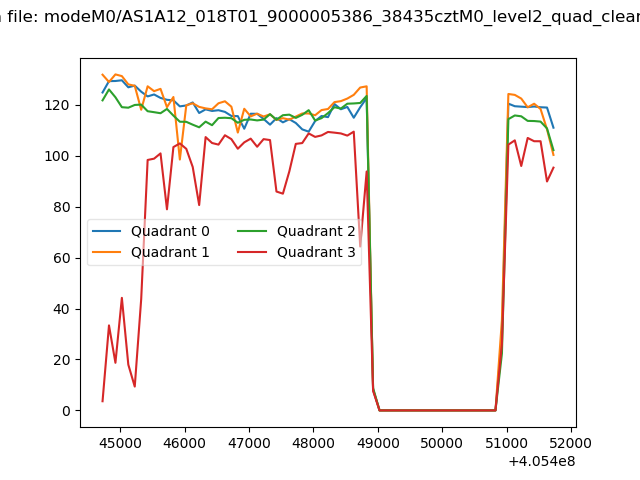 |
|
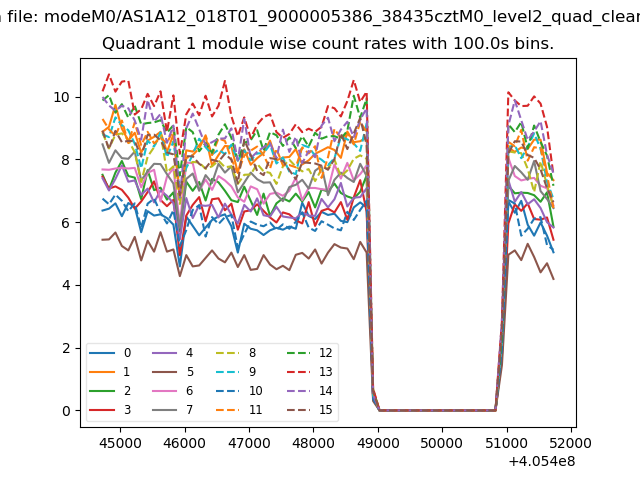
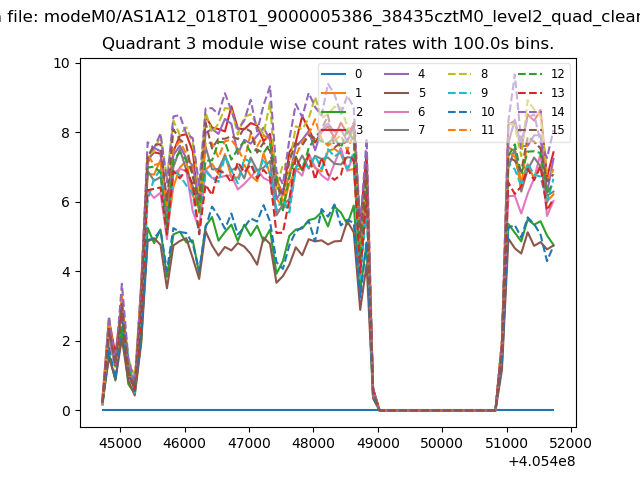
| Module-wise count rates for Quadrant A Data is divided into 100 sec bins |
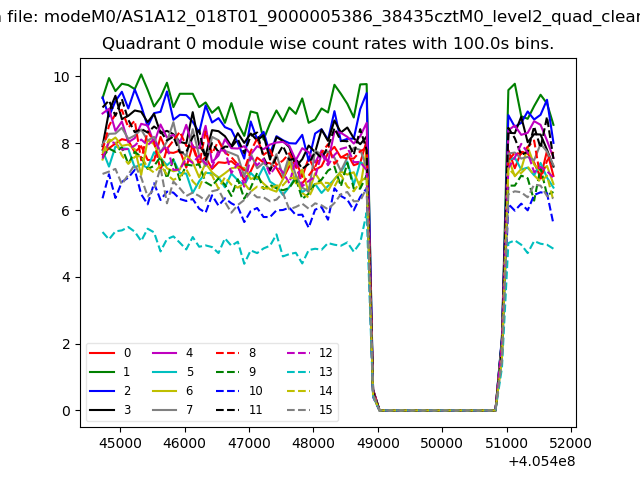 |
 |
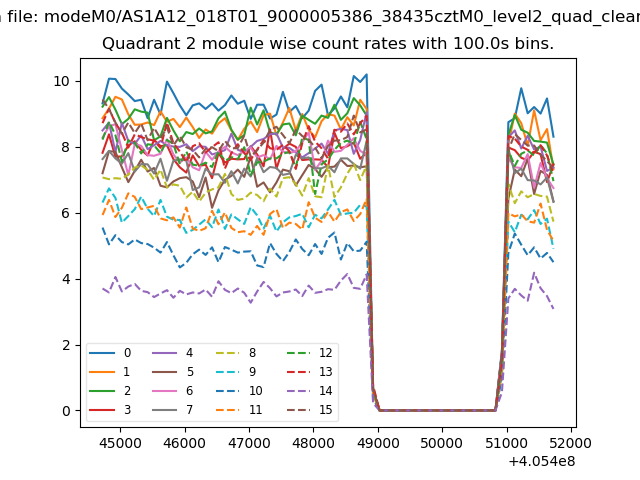
| Module-wise count rates for Quadrant B Data is divided into 100 sec bins |
 |
 |
| Module-wise count rates for Quadrant C Data is divided into 100 sec bins |
 |
 |
| Module-wise count rates for Quadrant D Data is divided into 100 sec bins |
 |
 |
| Parameter | Plot |
|---|---|
| CZT HV Monitor | 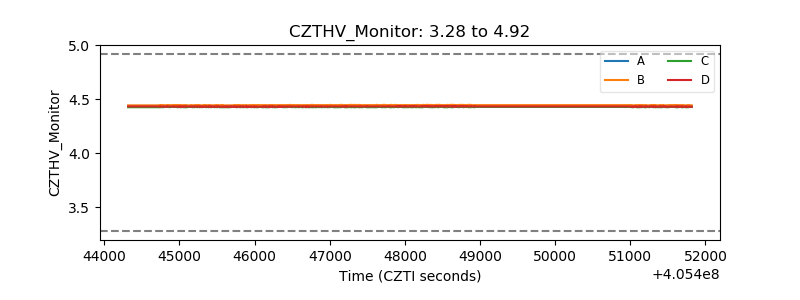 |
| D_VDD | 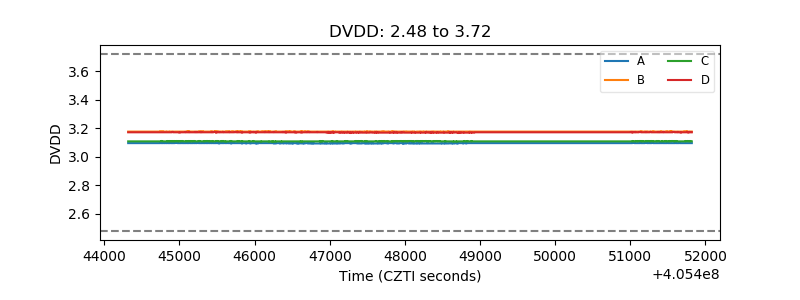 |
| Temperature 1 | 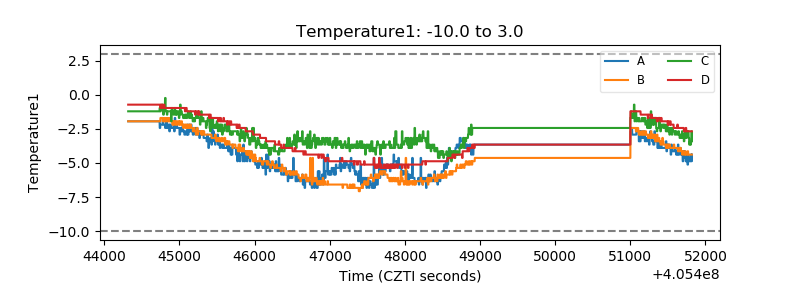 |
| Veto HV Monitor | 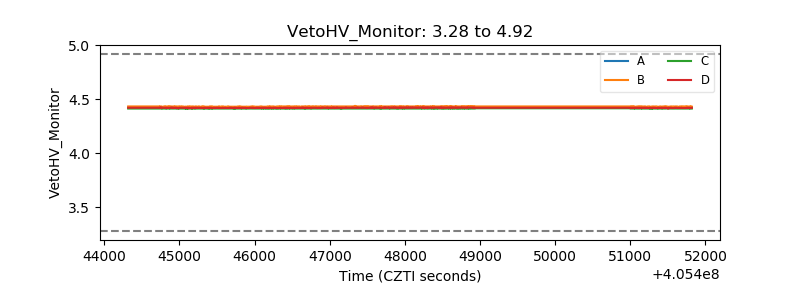 |
| Veto LLD | 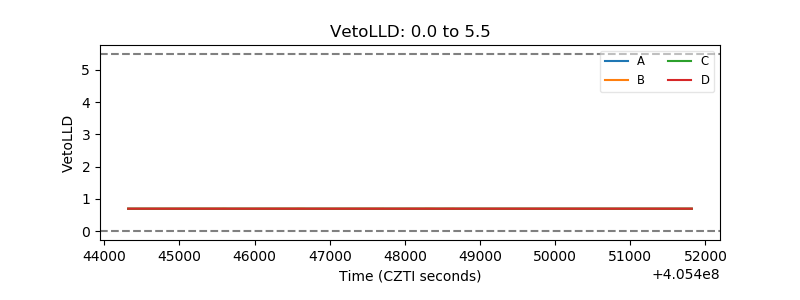 |
| Alpha Counter | 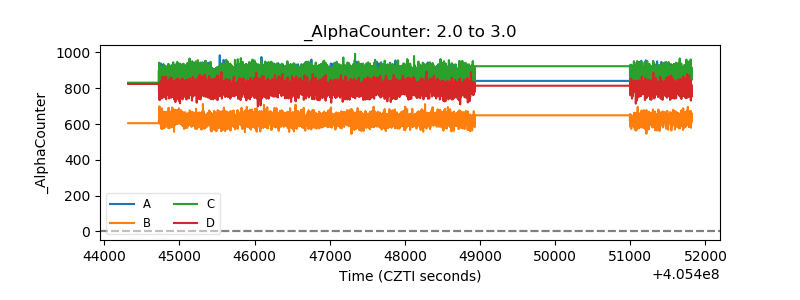 |
| _CPM_Rate | 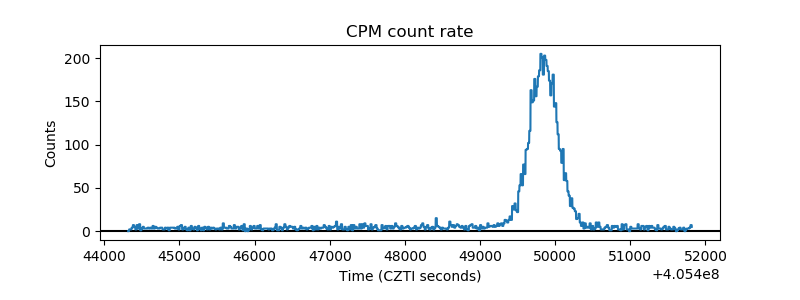 |
| CZT Counter | 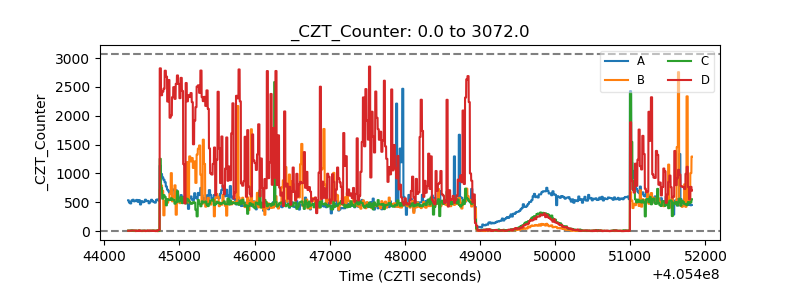 |
| +2.5 Volts monitor | 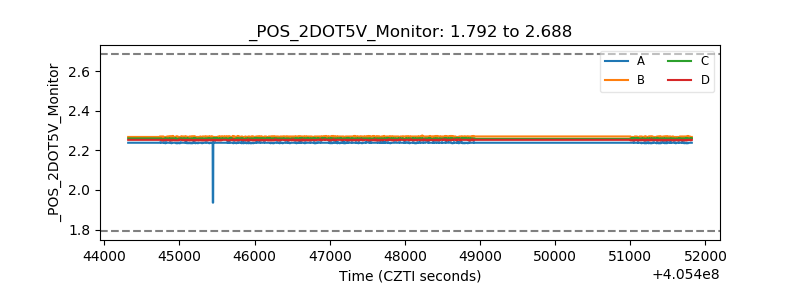 |
| +5 Volts monitor | 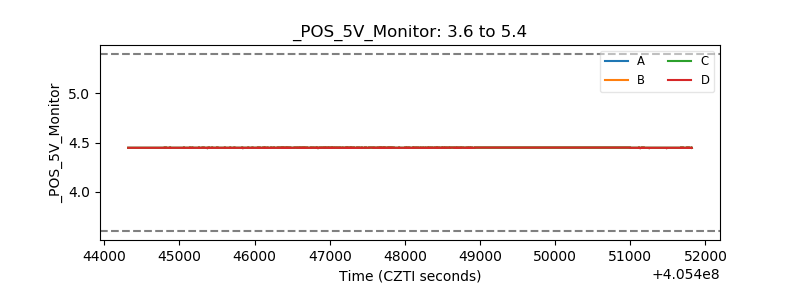 |
| _ROLL_ROT | 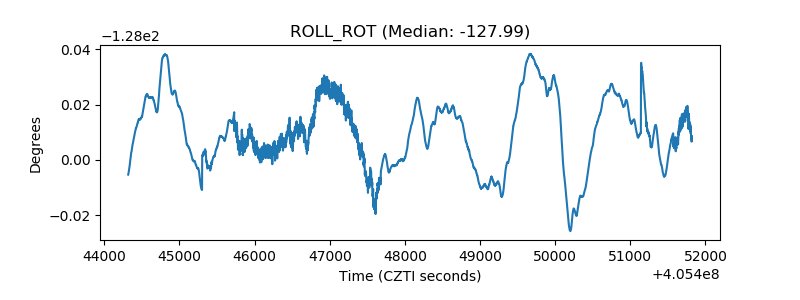 |
| _Roll_DEC | 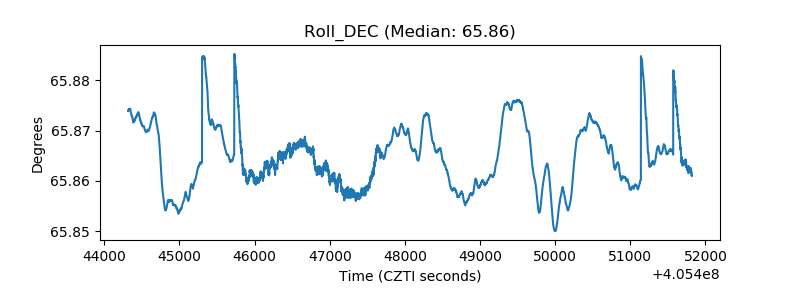 |
| _Roll_RA | 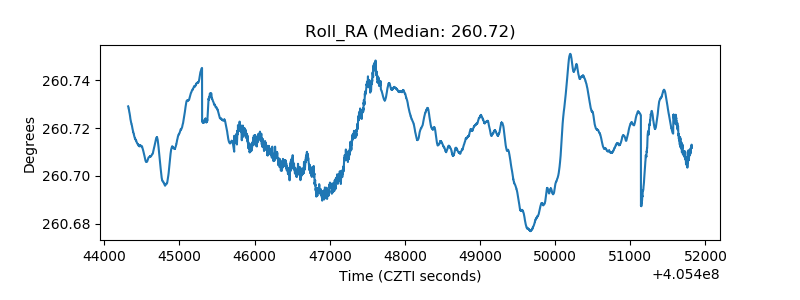 |
| Veto Counter | 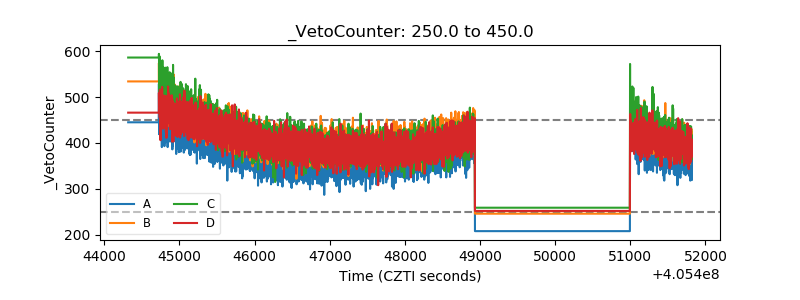 |