| Param | Original file | Final file |
|---|---|---|
| Filename | modeM0/AS1A12_018T01_9000005386_38436cztM0_level2.fits | modeM0/AS1A12_018T01_9000005386_38436cztM0_level2_quad_clean.evt |
| Size (bytes) | 332,161,920 | 89,277,120 |
| Size | 316.8 MB | 85.1 MB |
| Events in quadrant A | 2,841,828 | 601,562 |
| Events in quadrant B | 2,952,394 | 608,846 |
| Events in quadrant C | 2,576,884 | 586,576 |
| Events in quadrant D | 3,514,519 | 537,623 |
| Mode SS | |||
|---|---|---|---|
| Quadrant | BADHDUFLAG | Total packets | Discarded packets |
| A | 0 | 108 | 0 |
| B | 0 | 108 | 0 |
| C | 0 | 108 | 0 |
| D | 0 | 108 | 0 |
| Mode M9 | |||
|---|---|---|---|
| Quadrant | BADHDUFLAG | Total packets | Discarded packets |
| A | 0 | 26 | 0 |
| B | 0 | 26 | 0 |
| C | 0 | 26 | 0 |
| D | 0 | 27 | 0 |
| Mode M0 | |||
|---|---|---|---|
| Quadrant | BADHDUFLAG | Total packets | Discarded packets |
| A | 0 | 11719 | 3 |
| B | 0 | 12194 | 2 |
| C | 0 | 10917 | 2 |
| D | 0 | 14033 | 2 |
| Quadrant | Total seconds | Saturated seconds | Saturation percentage |
|---|---|---|---|
| A | 5263 | 27 | 0.513015% |
| B | 5263 | 49 | 0.931028% |
| C | 5263 | 21 | 0.399012% |
| D | 5263 | 143 | 2.717082% |
Noise dominated data is calculated using 1-second bins in cleaned event files. If a bin has >2000 counts, and if more than 50% of those come from <1% of pixels, then it is considered to be noise-dominated and hence unusable.
| Quadrant | # 1 sec bins | Bins with >0 counts | Bins with >2000 counts | High rate bins dominated by noise | Noise dominated (total time) | Noise dominated (detector-on time) | Marked lightcurve |
|---|---|---|---|---|---|---|---|
| A | 7055 | 5264 | 16 | 16 | 0.23% | 0.30% | 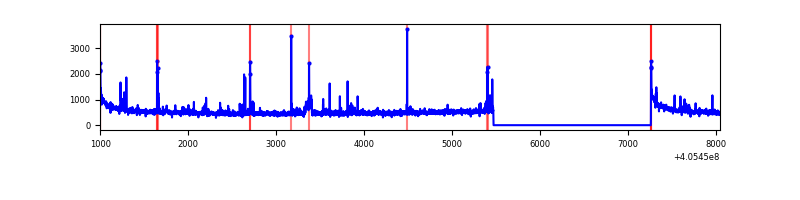 |
| B | 7055 | 5264 | 33 | 33 | 0.47% | 0.63% | 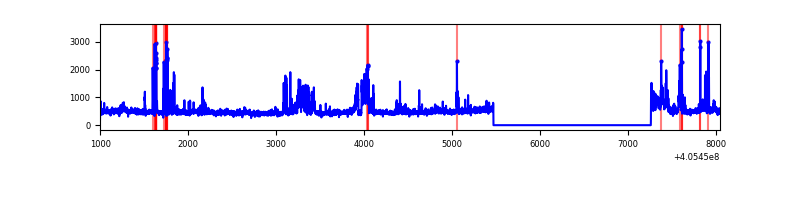 |
| C | 7055 | 5264 | 17 | 17 | 0.24% | 0.32% | 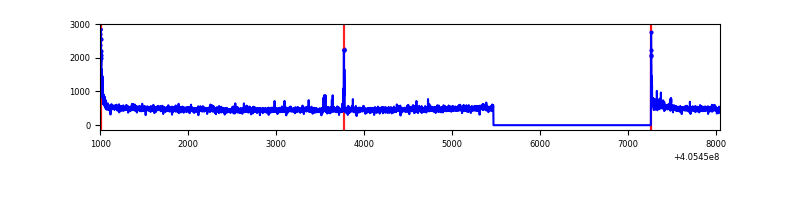 |
| D | 7055 | 5264 | 123 | 123 | 1.74% | 2.34% | 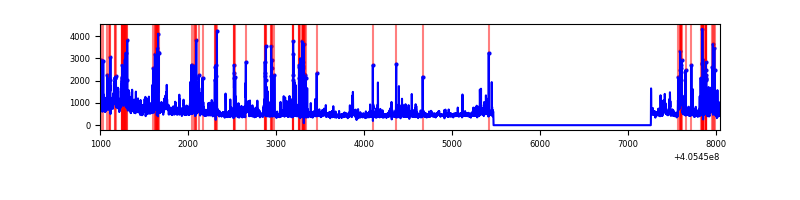 |
Top three noisy pixels from each quadrant. If the there are fewer than three noisy pixels in the level2.evt file, extra rows are filled as -1
| Pixel properties | Quadrant properties | ||||||
|---|---|---|---|---|---|---|---|
| Quadrant | DetID | PixID | Counts | Sigma | Mean | Median | Sigma |
| A | 10 | 83 | 408382 | 3449.09 | 580 | 568 | 118.2 |
| A | 9 | 143 | 107702 | 906.09 | 580 | 568 | 118.2 |
| A | 13 | 248 | 20983 | 172.66 | 580 | 568 | 118.2 |
| B | 5 | 184 | 259617 | 2340.56 | 578 | 562 | 110.7 |
| B | 0 | 183 | 164033 | 1476.96 | 578 | 562 | 110.7 |
| B | 4 | 232 | 99844 | 897.01 | 578 | 562 | 110.7 |
| C | 15 | 214 | 222504 | 1663.16 | 571 | 575 | 133.4 |
| C | 0 | 10 | 70576 | 524.59 | 571 | 575 | 133.4 |
| C | 3 | 233 | 18479 | 134.17 | 571 | 575 | 133.4 |
| D | 13 | 249 | 309551 | 2263.49 | 565 | 548 | 136.5 |
| D | 2 | 153 | 210453 | 1537.58 | 565 | 548 | 136.5 |
| D | 2 | 16 | 178365 | 1302.53 | 565 | 548 | 136.5 |
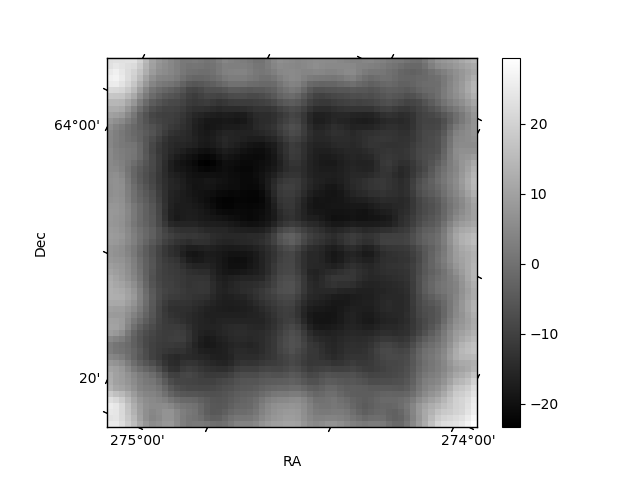
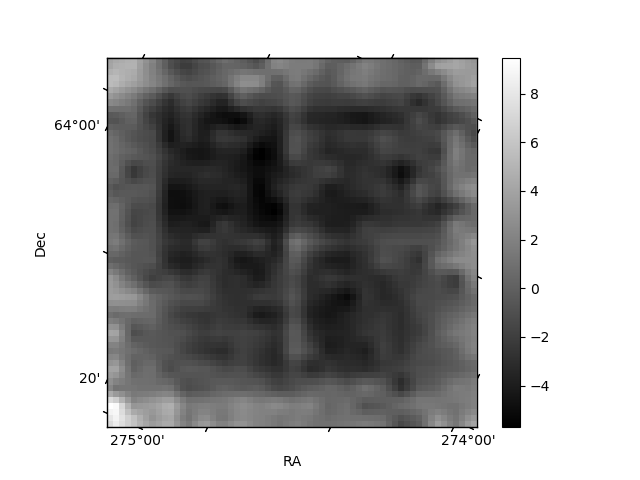
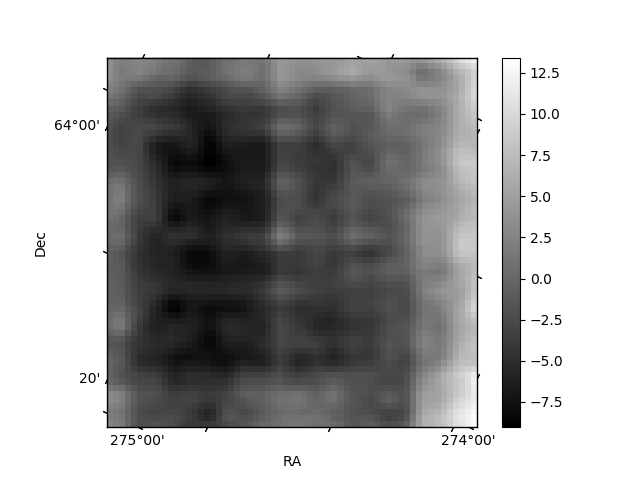
Histogram calculated using DETX and DETY for each event in the final _common_clean file
| Quadrant A | 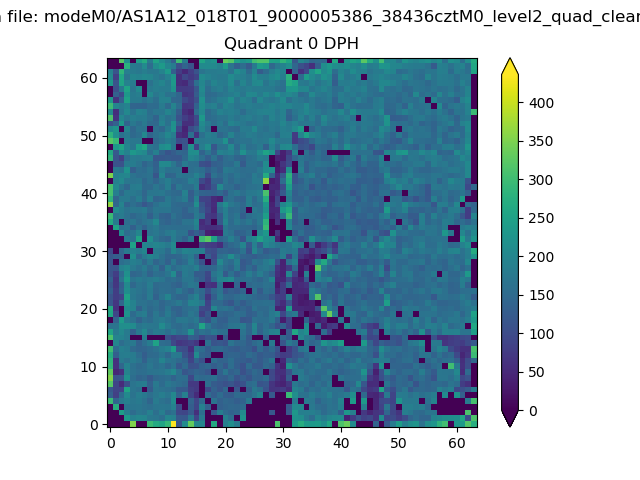 |
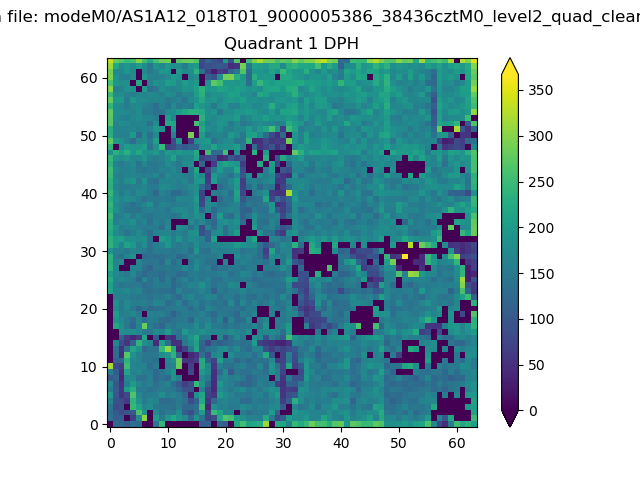 |
Quadrant B |
|---|---|---|---|
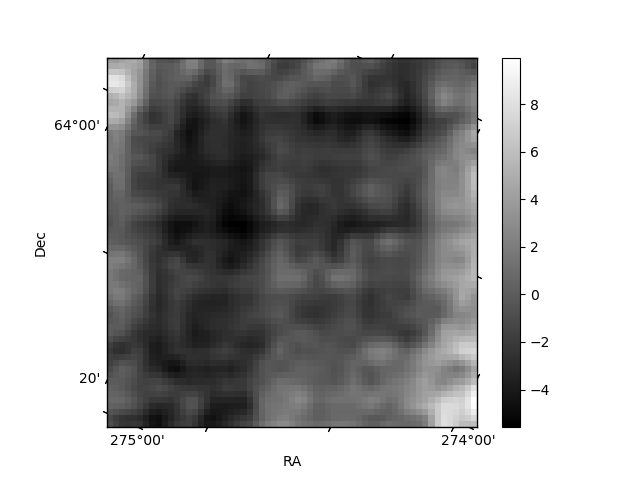
| Quadrant D | 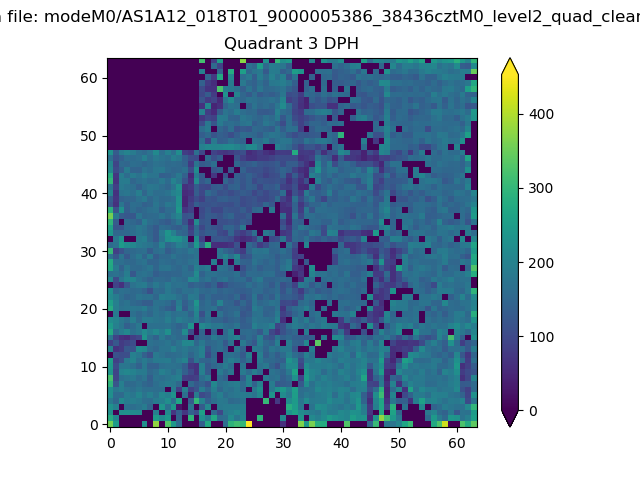 |
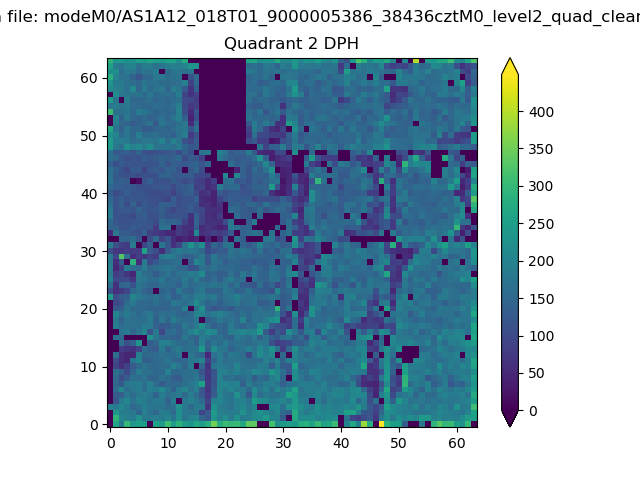 |
Quadrant C |
| Plot type | Count rate plots | Images |
|---|---|---|
| Comparison with Poisson distribution Blue bars denote a histogram of data divided into 1 sec bins. Red curve is a Poisson curve with rate = median count rate of data. |
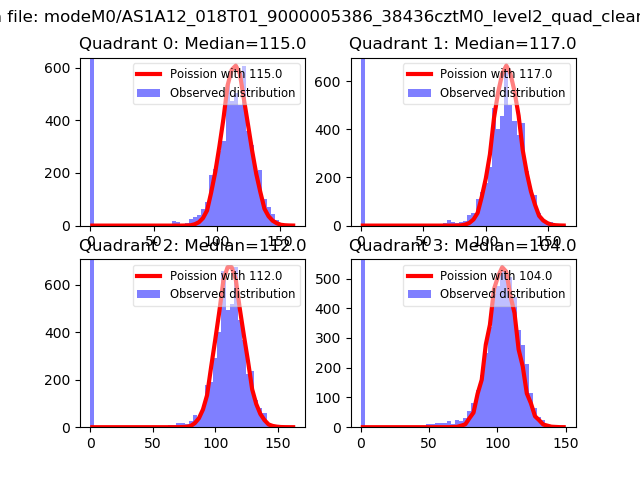 |
 |
| Quadrant-wise count rates Data is divided into 100 sec bins |
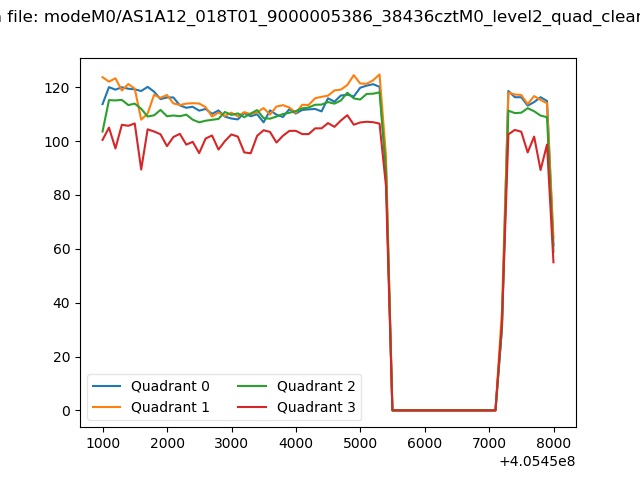 |
|
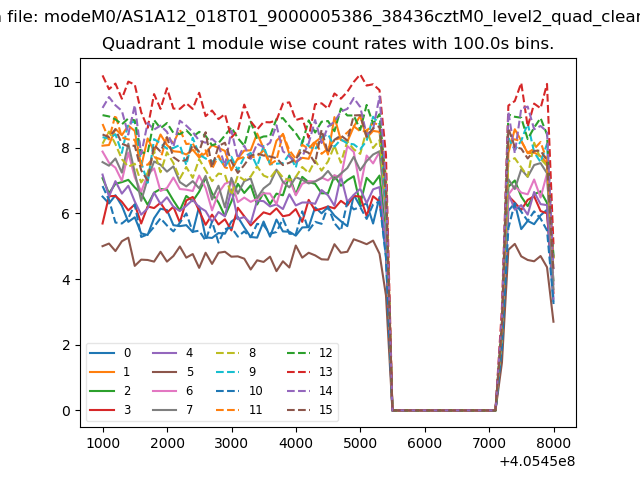
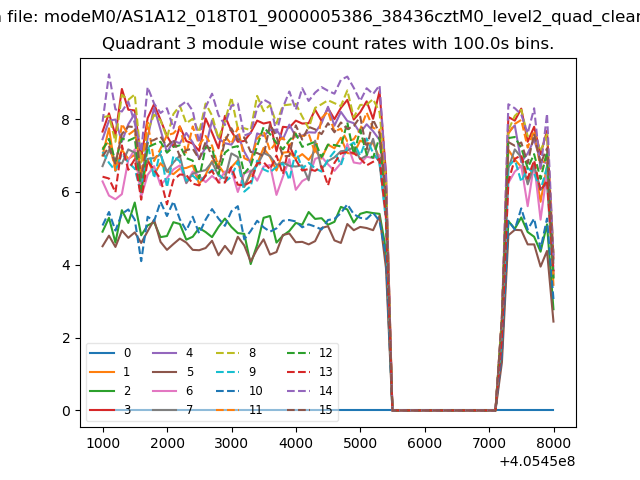
| Module-wise count rates for Quadrant A Data is divided into 100 sec bins |
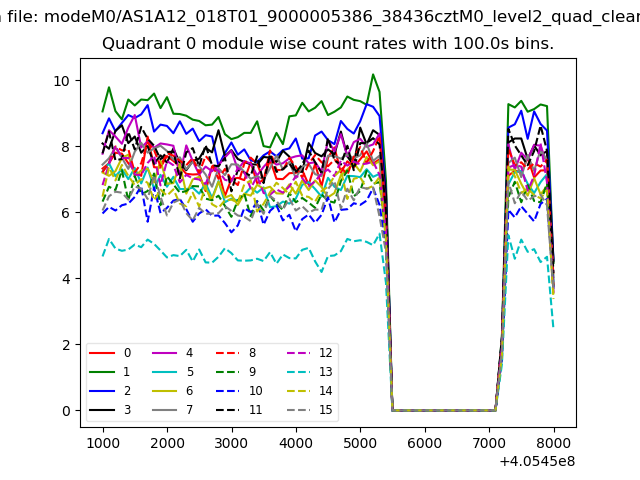 |
 |
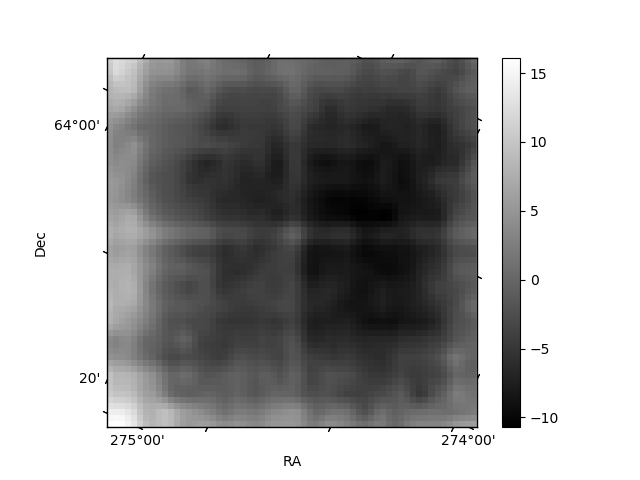
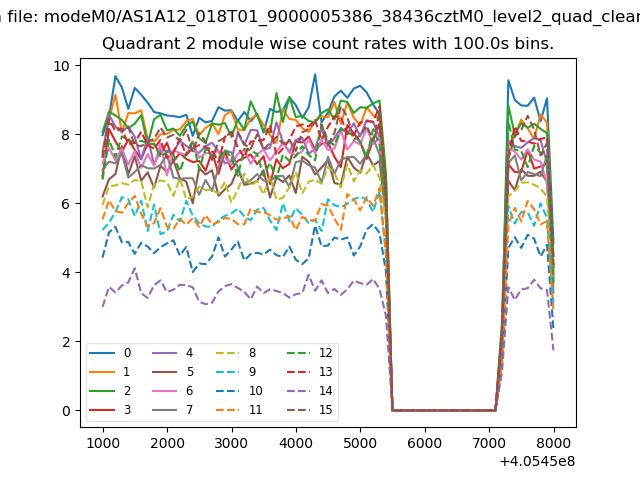
| Module-wise count rates for Quadrant B Data is divided into 100 sec bins |
 |
 |
| Module-wise count rates for Quadrant C Data is divided into 100 sec bins |
 |
 |
| Module-wise count rates for Quadrant D Data is divided into 100 sec bins |
 |
 |
| Parameter | Plot |
|---|---|
| CZT HV Monitor | 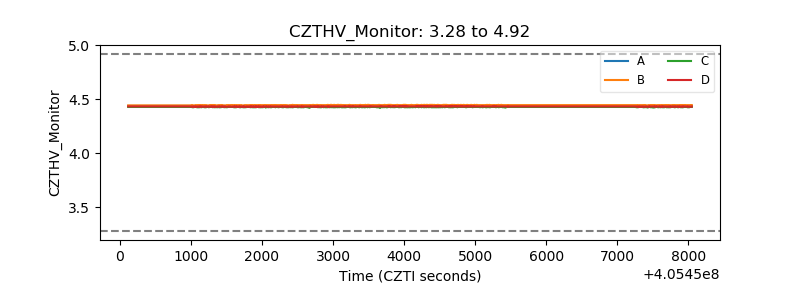 |
| D_VDD | 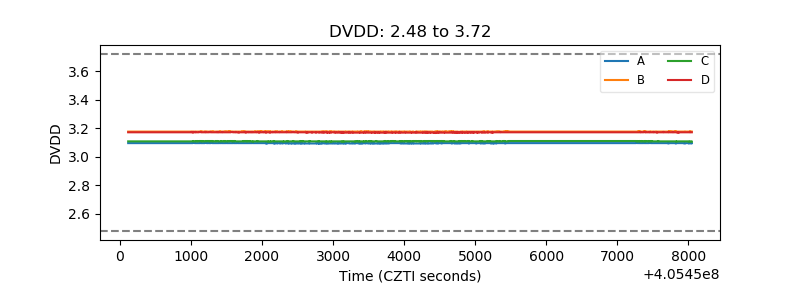 |
| Temperature 1 | 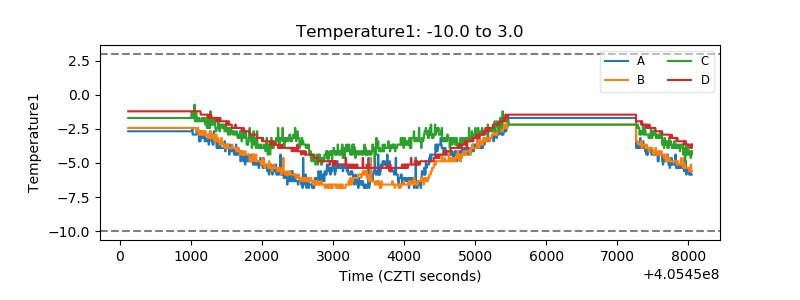 |
| Veto HV Monitor | 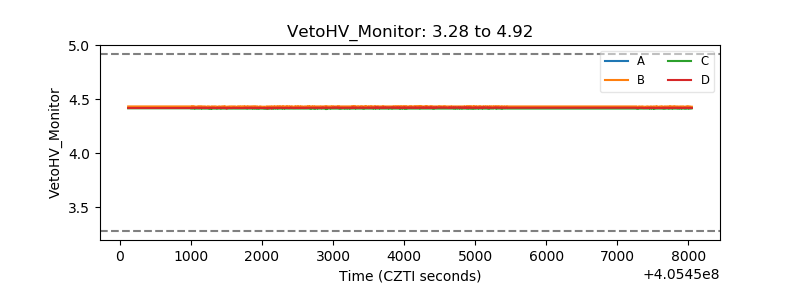 |
| Veto LLD | 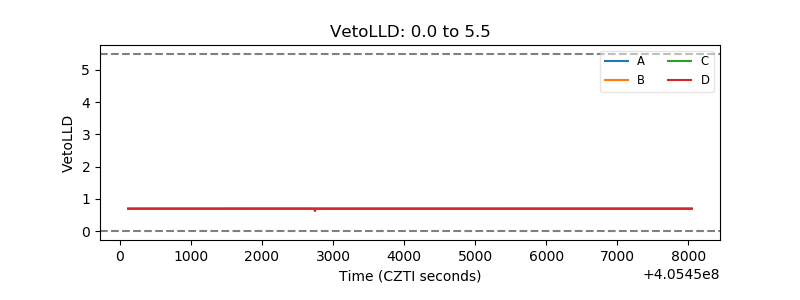 |
| Alpha Counter | 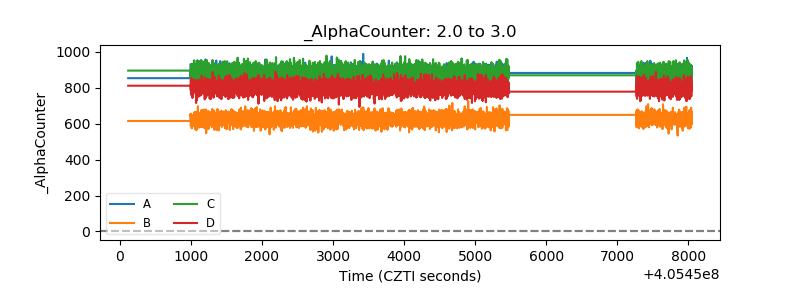 |
| _CPM_Rate | 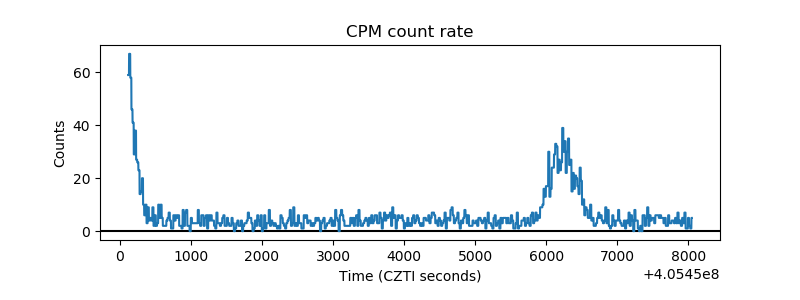 |
| CZT Counter | 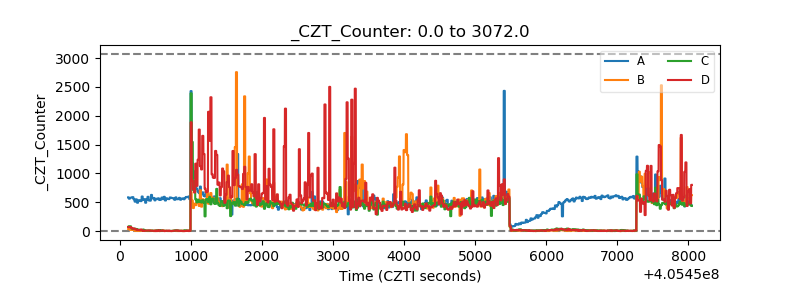 |
| +2.5 Volts monitor | 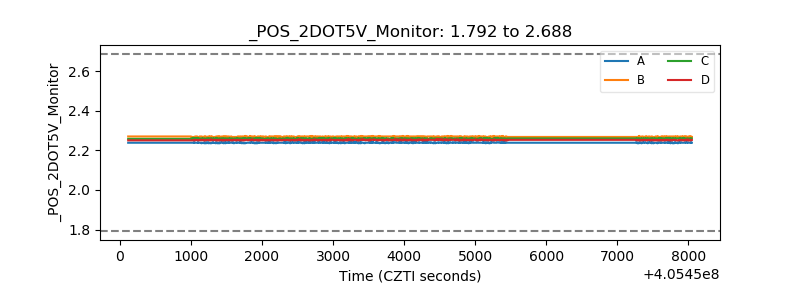 |
| +5 Volts monitor | 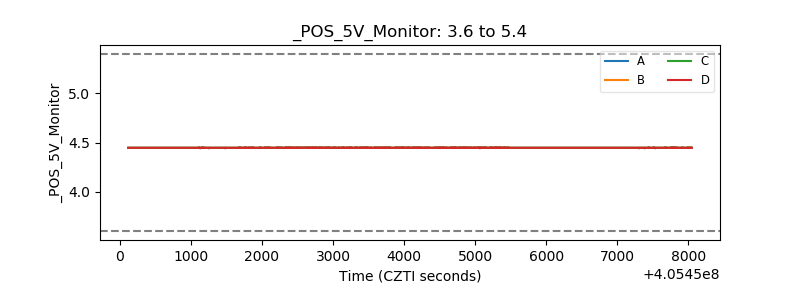 |
| _ROLL_ROT | 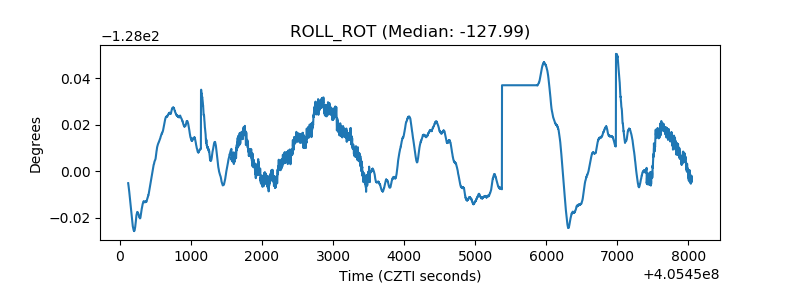 |
| _Roll_DEC | 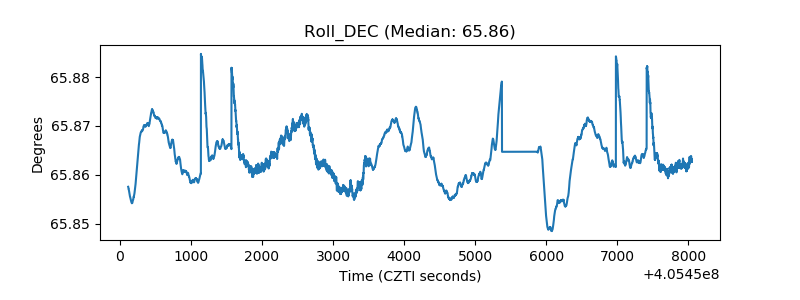 |
| _Roll_RA | 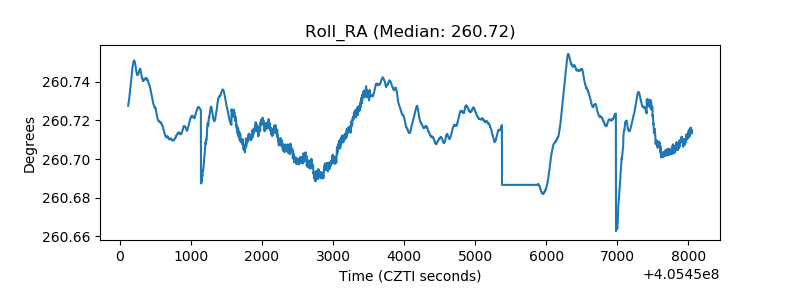 |
| Veto Counter | 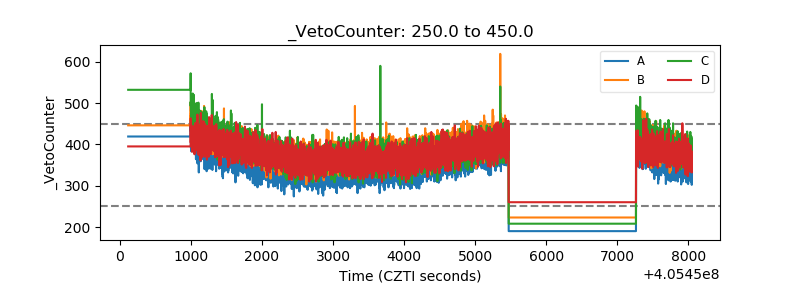 |