| Param | Original file | Final file |
|---|---|---|
| Filename | modeM0/AS1A12_018T01_9000005386_38437cztM0_level2.fits | modeM0/AS1A12_018T01_9000005386_38437cztM0_level2_quad_clean.evt |
| Size (bytes) | 363,113,280 | 93,991,680 |
| Size | 346.3 MB | 89.6 MB |
| Events in quadrant A | 3,062,073 | 635,178 |
| Events in quadrant B | 3,235,973 | 637,737 |
| Events in quadrant C | 2,713,100 | 623,983 |
| Events in quadrant D | 3,988,048 | 551,863 |
| Mode SS | |||
|---|---|---|---|
| Quadrant | BADHDUFLAG | Total packets | Discarded packets |
| A | 0 | 116 | 0 |
| B | 0 | 116 | 0 |
| C | 0 | 116 | 0 |
| D | 0 | 116 | 0 |
| Mode M9 | |||
|---|---|---|---|
| Quadrant | BADHDUFLAG | Total packets | Discarded packets |
| A | 0 | 28 | 0 |
| B | 0 | 28 | 0 |
| C | 0 | 28 | 0 |
| D | 0 | 29 | 0 |
| Mode M0 | |||
|---|---|---|---|
| Quadrant | BADHDUFLAG | Total packets | Discarded packets |
| A | 0 | 12691 | 3 |
| B | 0 | 13475 | 2 |
| C | 0 | 11630 | 2 |
| D | 0 | 15731 | 2 |
| Quadrant | Total seconds | Saturated seconds | Saturation percentage |
|---|---|---|---|
| A | 5677 | 42 | 0.739827% |
| B | 5677 | 120 | 2.113792% |
| C | 5677 | 12 | 0.211379% |
| D | 5677 | 359 | 6.323763% |
Noise dominated data is calculated using 1-second bins in cleaned event files. If a bin has >2000 counts, and if more than 50% of those come from <1% of pixels, then it is considered to be noise-dominated and hence unusable.
| Quadrant | # 1 sec bins | Bins with >0 counts | Bins with >2000 counts | High rate bins dominated by noise | Noise dominated (total time) | Noise dominated (detector-on time) | Marked lightcurve |
|---|---|---|---|---|---|---|---|
| A | 7170 | 5678 | 28 | 28 | 0.39% | 0.49% | 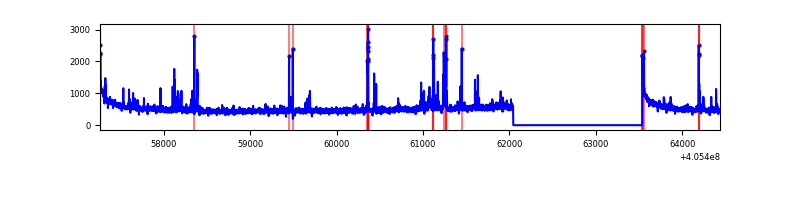 |
| B | 7170 | 5678 | 61 | 61 | 0.85% | 1.07% | 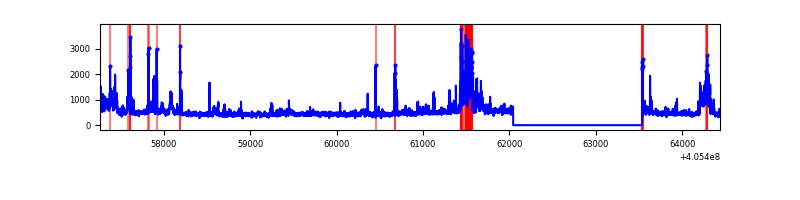 |
| C | 7170 | 5678 | 9 | 9 | 0.13% | 0.16% | 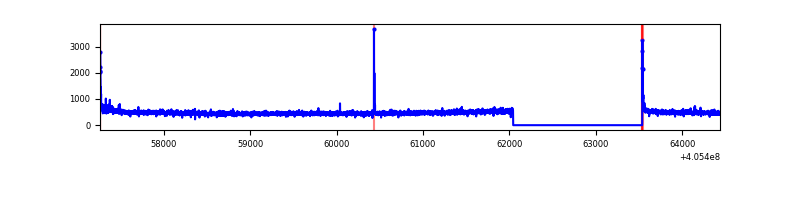 |
| D | 7170 | 5678 | 275 | 275 | 3.84% | 4.84% | 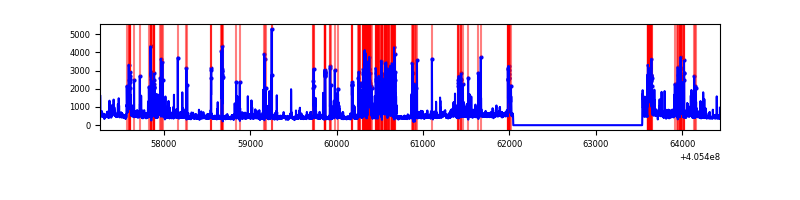 |
Top three noisy pixels from each quadrant. If the there are fewer than three noisy pixels in the level2.evt file, extra rows are filled as -1
| Pixel properties | Quadrant properties | ||||||
|---|---|---|---|---|---|---|---|
| Quadrant | DetID | PixID | Counts | Sigma | Mean | Median | Sigma |
| A | 10 | 83 | 419540 | 3330.03 | 625 | 613 | 125.8 |
| A | 9 | 143 | 147575 | 1168.19 | 625 | 613 | 125.8 |
| A | 13 | 248 | 40310 | 315.55 | 625 | 613 | 125.8 |
| B | 0 | 183 | 377957 | 3135.25 | 620 | 604 | 120.4 |
| B | 5 | 184 | 236593 | 1960.72 | 620 | 604 | 120.4 |
| B | 4 | 232 | 51536 | 423.17 | 620 | 604 | 120.4 |
| C | 15 | 214 | 240947 | 1677.36 | 614 | 617 | 143.3 |
| C | 0 | 10 | 42583 | 292.9 | 614 | 617 | 143.3 |
| C | 1 | 23 | 14645 | 97.91 | 614 | 617 | 143.3 |
| D | 2 | 250 | 604660 | 4172.31 | 597 | 580 | 144.8 |
| D | 13 | 249 | 226754 | 1562.16 | 597 | 580 | 144.8 |
| D | 2 | 153 | 142372 | 979.34 | 597 | 580 | 144.8 |
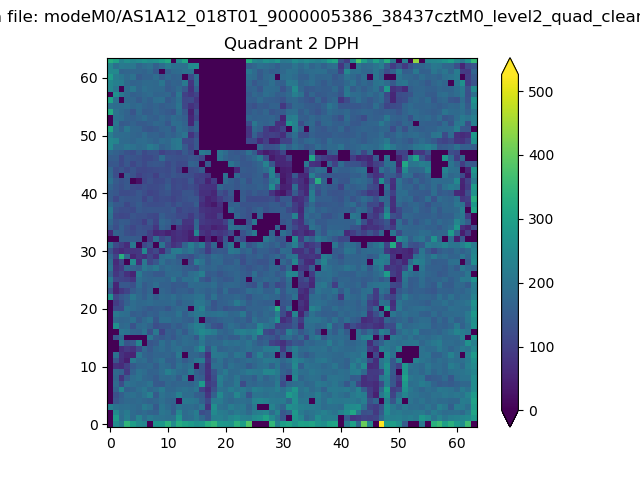
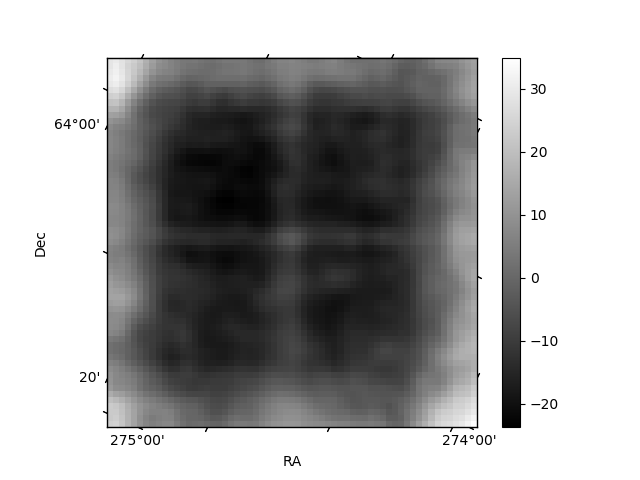
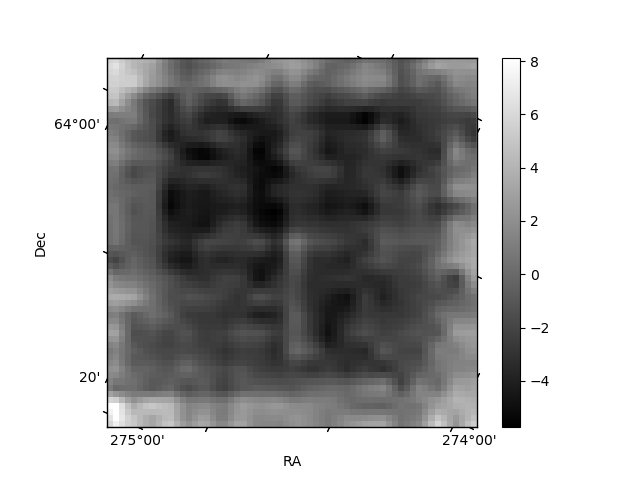
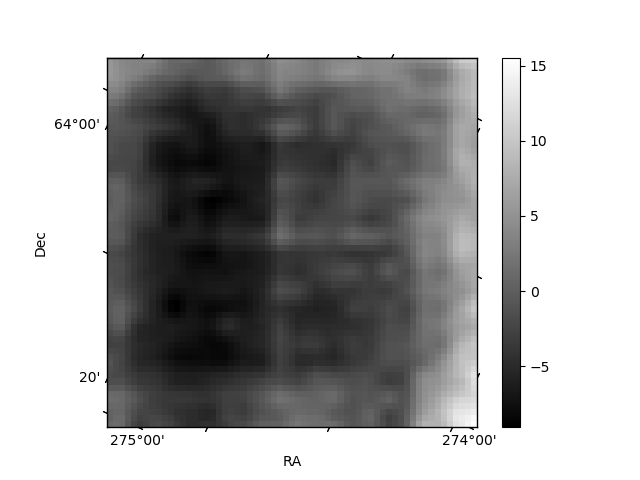
Histogram calculated using DETX and DETY for each event in the final _common_clean file
| Quadrant A | 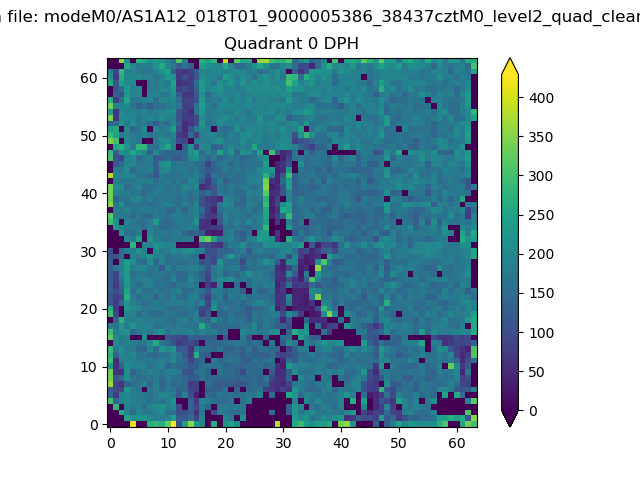 |
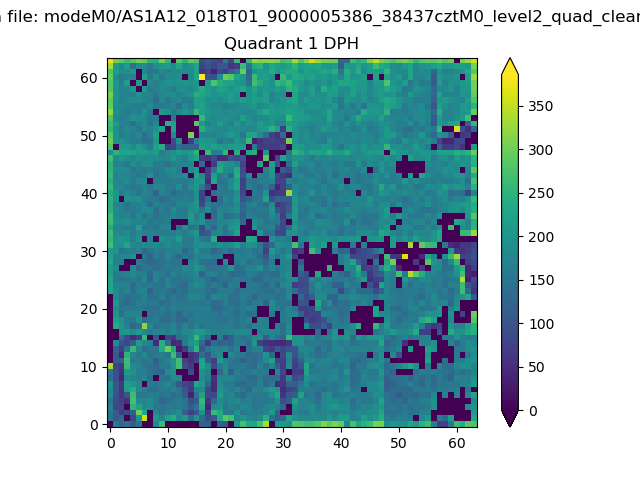 |
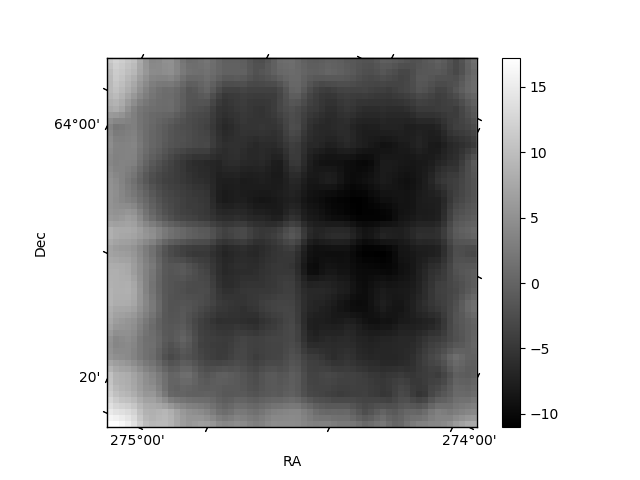
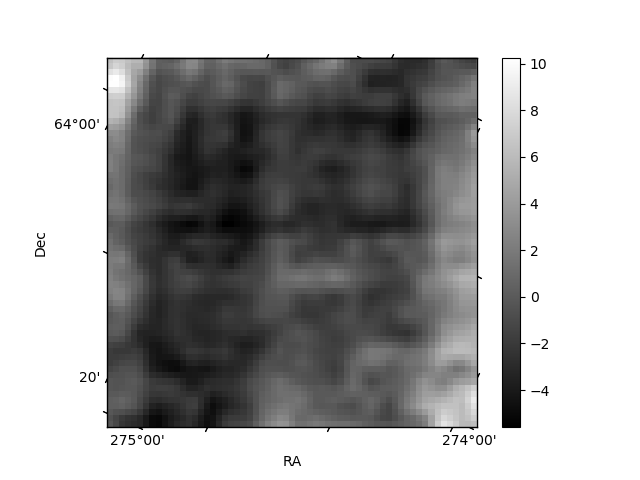
Quadrant B |
|---|---|---|---|
| Quadrant D | 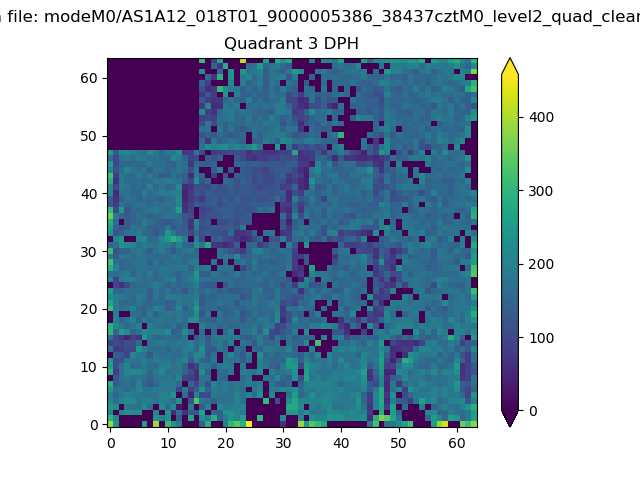 |
 |
Quadrant C |
| Plot type | Count rate plots | Images |
|---|---|---|
| Comparison with Poisson distribution Blue bars denote a histogram of data divided into 1 sec bins. Red curve is a Poisson curve with rate = median count rate of data. |
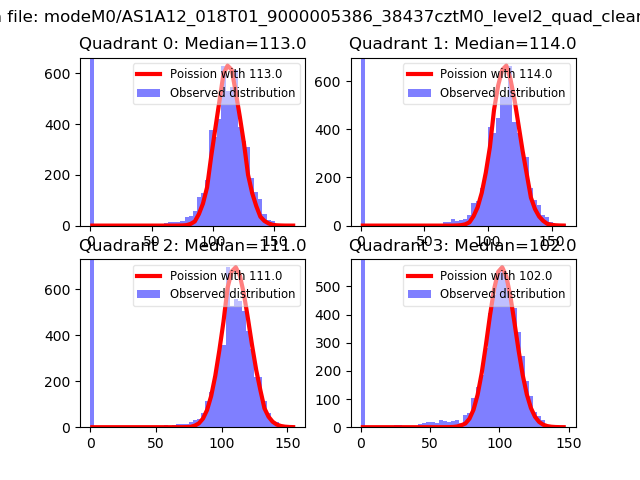 |
 |
| Quadrant-wise count rates Data is divided into 100 sec bins |
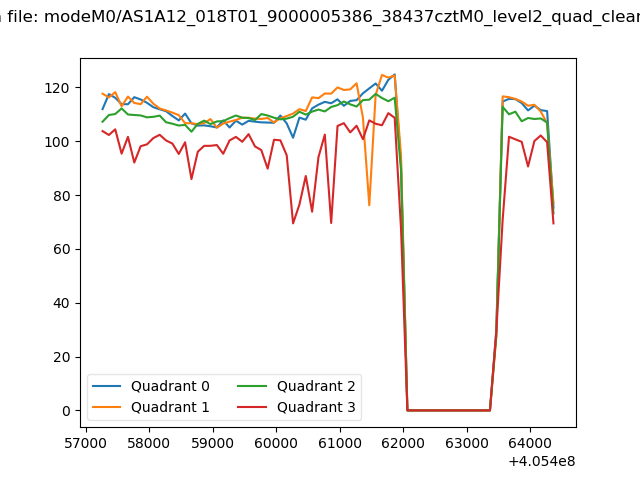 |
|
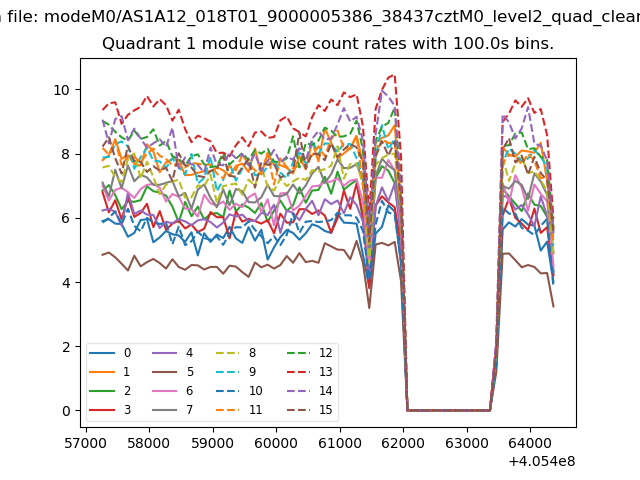
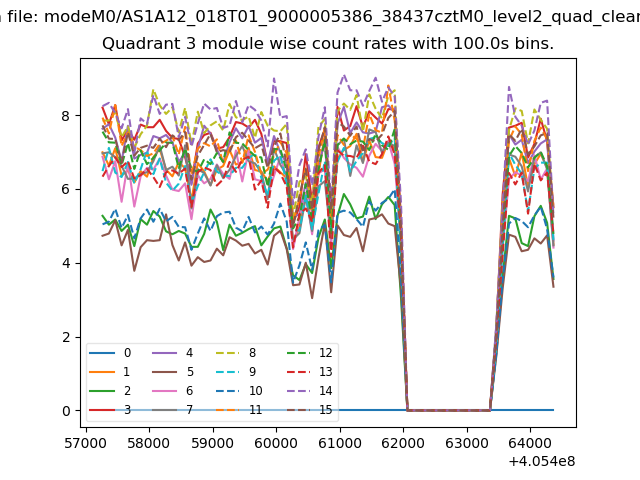
| Module-wise count rates for Quadrant A Data is divided into 100 sec bins |
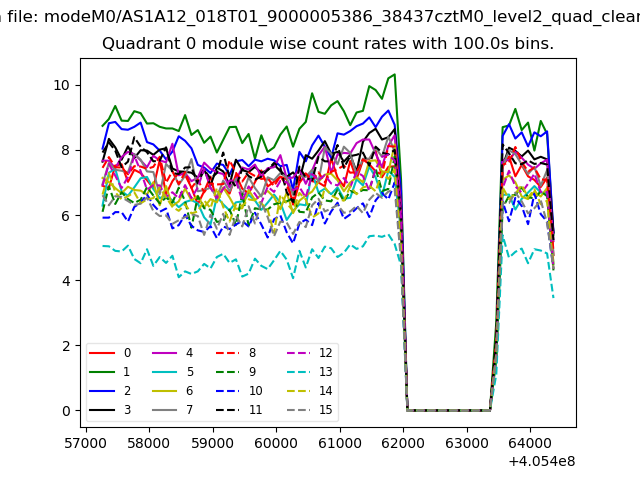 |
 |
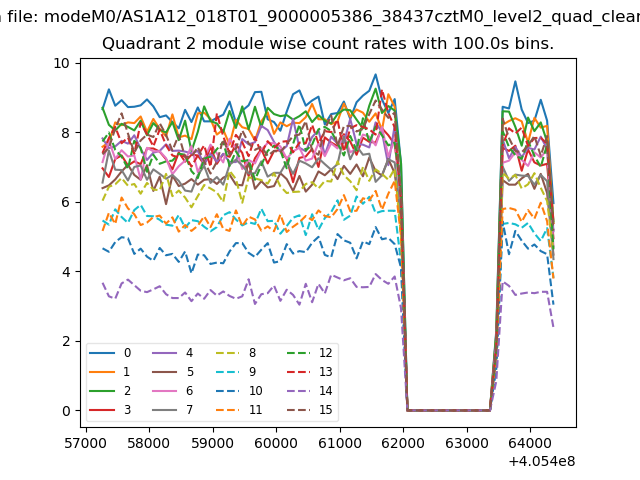
| Module-wise count rates for Quadrant B Data is divided into 100 sec bins |
 |
 |
| Module-wise count rates for Quadrant C Data is divided into 100 sec bins |
 |
 |
| Module-wise count rates for Quadrant D Data is divided into 100 sec bins |
 |
 |
| Parameter | Plot |
|---|---|
| CZT HV Monitor | 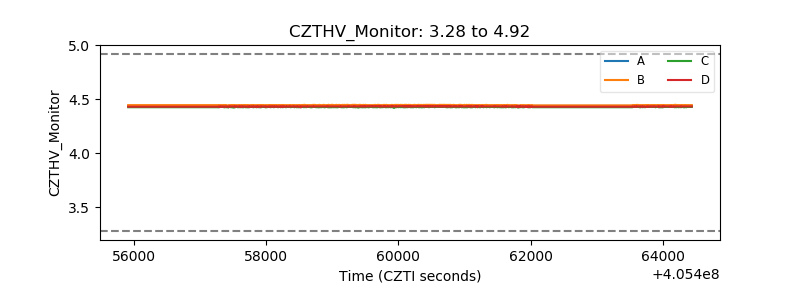 |
| D_VDD | 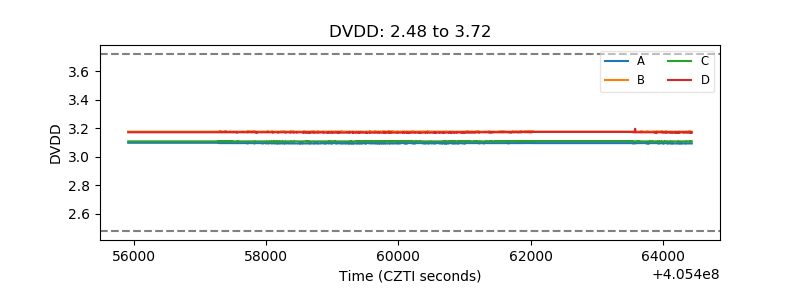 |
| Temperature 1 | 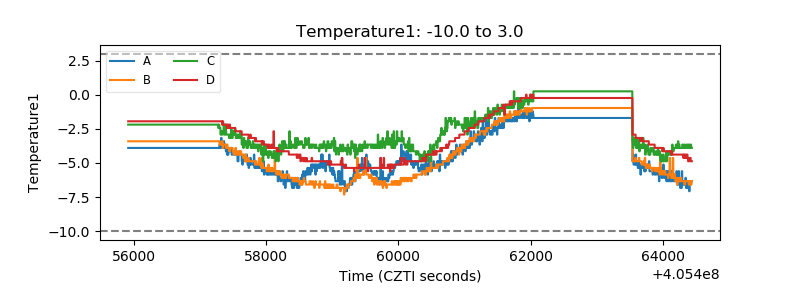 |
| Veto HV Monitor | 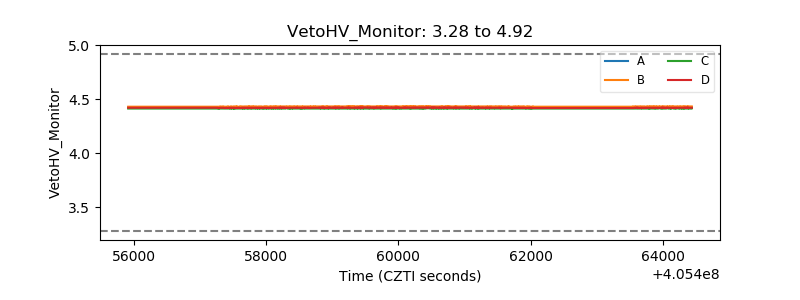 |
| Veto LLD | 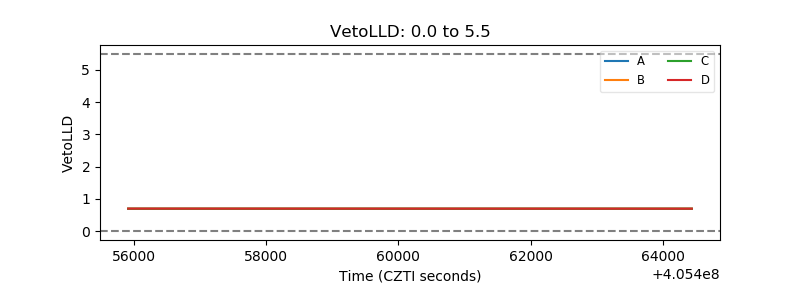 |
| Alpha Counter | 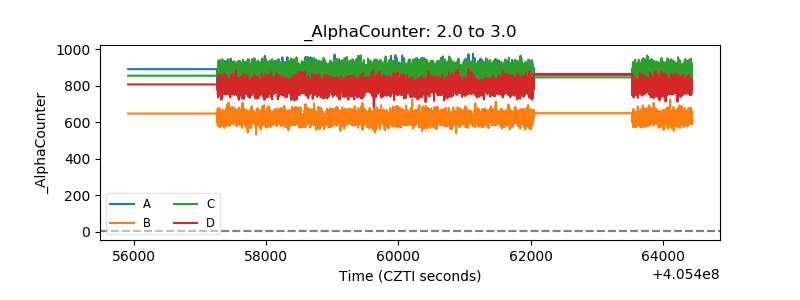 |
| _CPM_Rate | 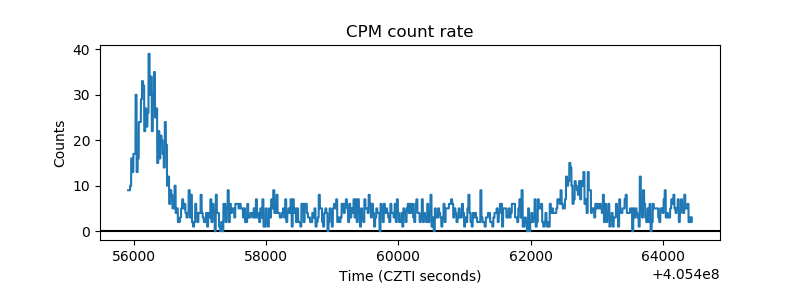 |
| CZT Counter | 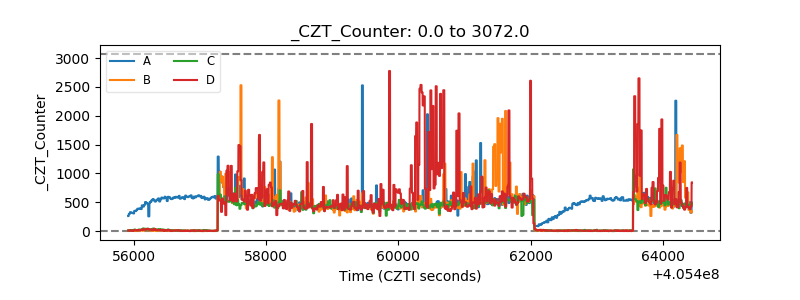 |
| +2.5 Volts monitor | 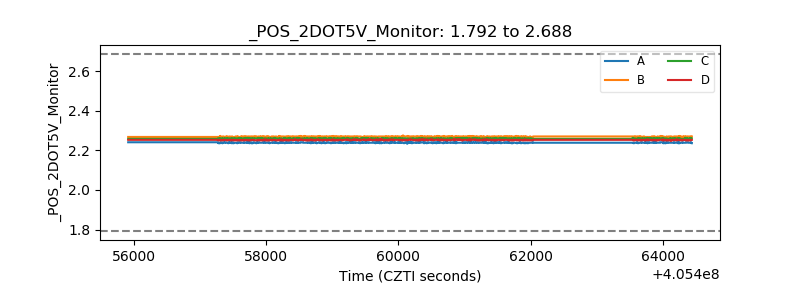 |
| +5 Volts monitor | 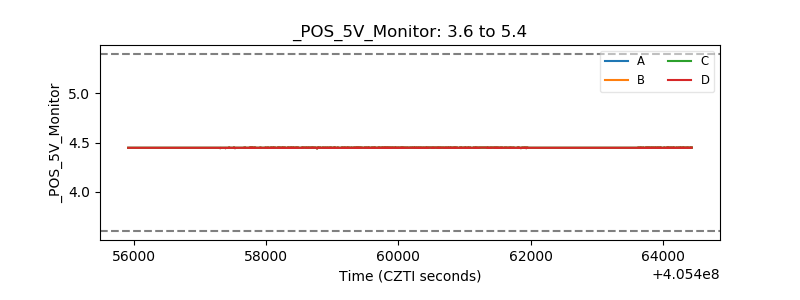 |
| _ROLL_ROT | 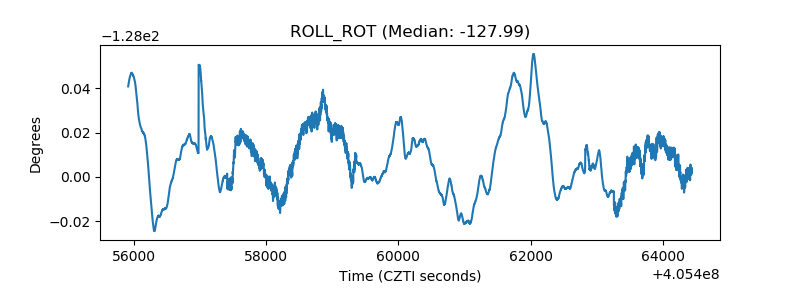 |
| _Roll_DEC | 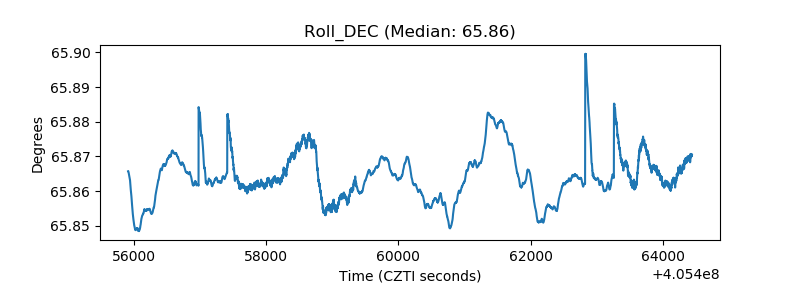 |
| _Roll_RA | 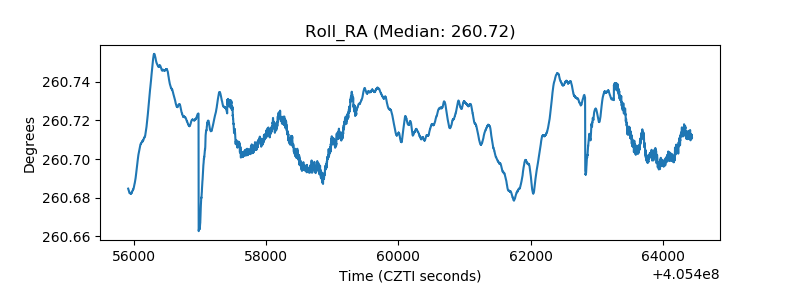 |
| Veto Counter | 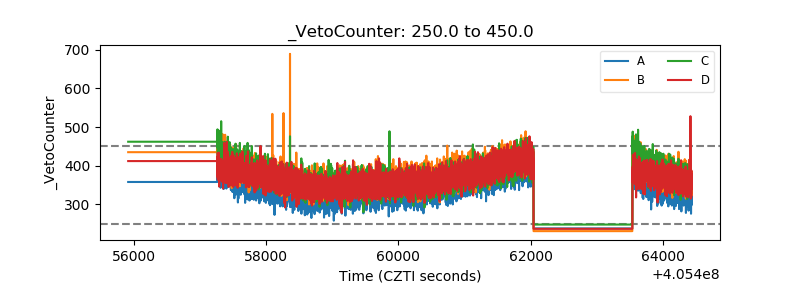 |