| Param | Original file | Final file |
|---|---|---|
| Filename | modeM0/AS1A12_018T01_9000005386_38438cztM0_level2.fits | modeM0/AS1A12_018T01_9000005386_38438cztM0_level2_quad_clean.evt |
| Size (bytes) | 382,800,960 | 97,335,360 |
| Size | 365.1 MB | 92.8 MB |
| Events in quadrant A | 3,049,124 | 655,796 |
| Events in quadrant B | 3,750,348 | 645,432 |
| Events in quadrant C | 2,870,816 | 645,942 |
| Events in quadrant D | 4,037,030 | 584,212 |
| Mode SS | |||
|---|---|---|---|
| Quadrant | BADHDUFLAG | Total packets | Discarded packets |
| A | 0 | 122 | 0 |
| B | 0 | 122 | 0 |
| C | 0 | 122 | 0 |
| D | 0 | 122 | 0 |
| Mode M9 | |||
|---|---|---|---|
| Quadrant | BADHDUFLAG | Total packets | Discarded packets |
| A | 0 | 22 | 0 |
| B | 0 | 22 | 0 |
| C | 0 | 22 | 0 |
| D | 0 | 23 | 0 |
| Mode M0 | |||
|---|---|---|---|
| Quadrant | BADHDUFLAG | Total packets | Discarded packets |
| A | 0 | 12780 | 3 |
| B | 0 | 15220 | 2 |
| C | 0 | 12246 | 2 |
| D | 0 | 16114 | 2 |
| Quadrant | Total seconds | Saturated seconds | Saturation percentage |
|---|---|---|---|
| A | 5947 | 18 | 0.302674% |
| B | 5947 | 232 | 3.901127% |
| C | 5947 | 16 | 0.269043% |
| D | 5947 | 244 | 4.102909% |
Noise dominated data is calculated using 1-second bins in cleaned event files. If a bin has >2000 counts, and if more than 50% of those come from <1% of pixels, then it is considered to be noise-dominated and hence unusable.
| Quadrant | # 1 sec bins | Bins with >0 counts | Bins with >2000 counts | High rate bins dominated by noise | Noise dominated (total time) | Noise dominated (detector-on time) | Marked lightcurve |
|---|---|---|---|---|---|---|---|
| A | 7290 | 5948 | 13 | 13 | 0.18% | 0.22% | 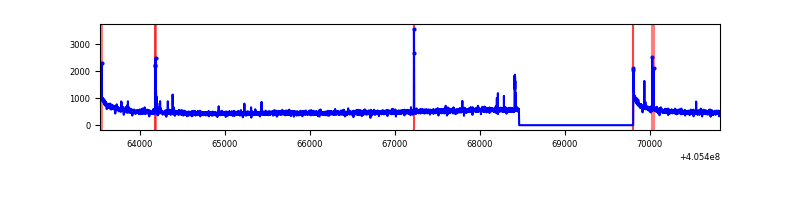 |
| B | 7290 | 5948 | 131 | 131 | 1.80% | 2.20% | 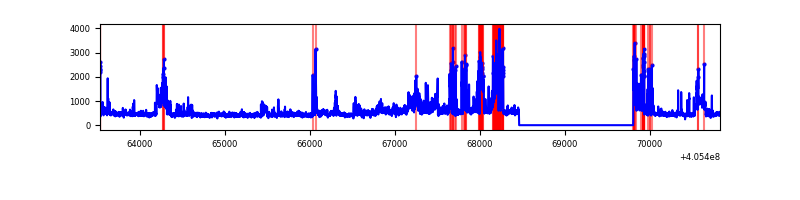 |
| C | 7290 | 5948 | 8 | 8 | 0.11% | 0.13% | 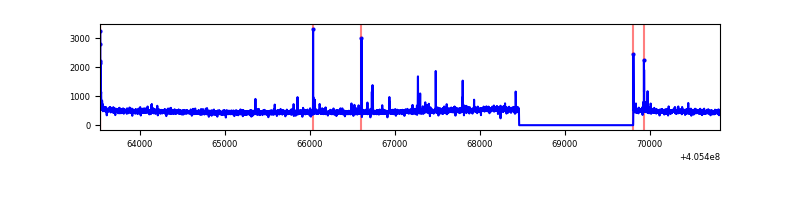 |
| D | 7290 | 5948 | 213 | 213 | 2.92% | 3.58% | 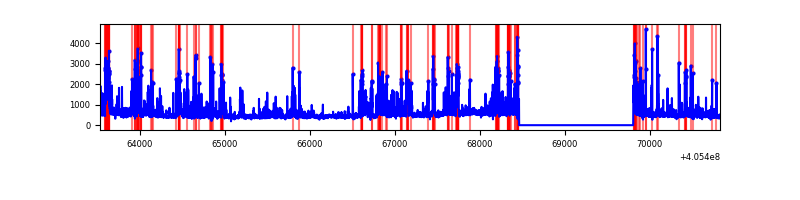 |
Top three noisy pixels from each quadrant. If the there are fewer than three noisy pixels in the level2.evt file, extra rows are filled as -1
| Pixel properties | Quadrant properties | ||||||
|---|---|---|---|---|---|---|---|
| Quadrant | DetID | PixID | Counts | Sigma | Mean | Median | Sigma |
| A | 10 | 83 | 427397 | 3190.12 | 657 | 642 | 133.8 |
| A | 9 | 143 | 44223 | 325.78 | 657 | 642 | 133.8 |
| A | 13 | 6 | 18408 | 132.81 | 657 | 642 | 133.8 |
| B | 5 | 184 | 622862 | 5030.9 | 647 | 629 | 123.7 |
| B | 8 | 3 | 260245 | 2099.05 | 647 | 629 | 123.7 |
| B | 0 | 183 | 156396 | 1259.41 | 647 | 629 | 123.7 |
| C | 15 | 214 | 253604 | 1669.51 | 646 | 650 | 151.5 |
| C | 14 | 254 | 49798 | 324.38 | 646 | 650 | 151.5 |
| C | 0 | 10 | 26889 | 173.18 | 646 | 650 | 151.5 |
| D | 13 | 249 | 421131 | 2753.28 | 632 | 615 | 152.7 |
| D | 2 | 16 | 302437 | 1976.14 | 632 | 615 | 152.7 |
| D | 2 | 153 | 263713 | 1722.6 | 632 | 615 | 152.7 |
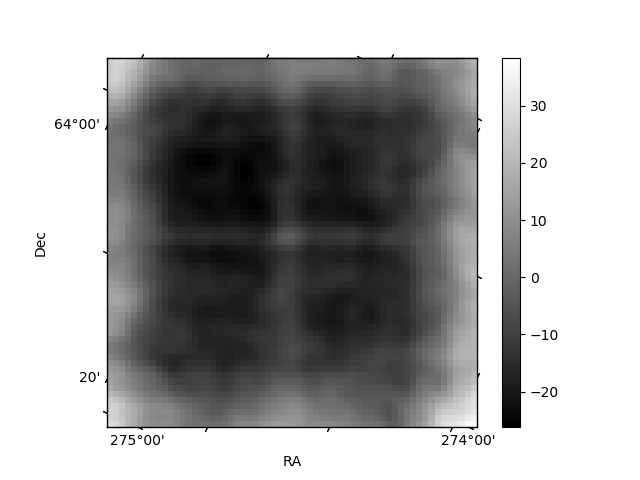
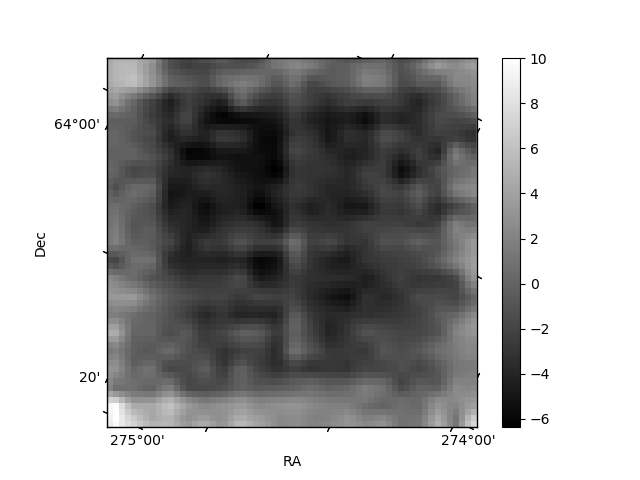
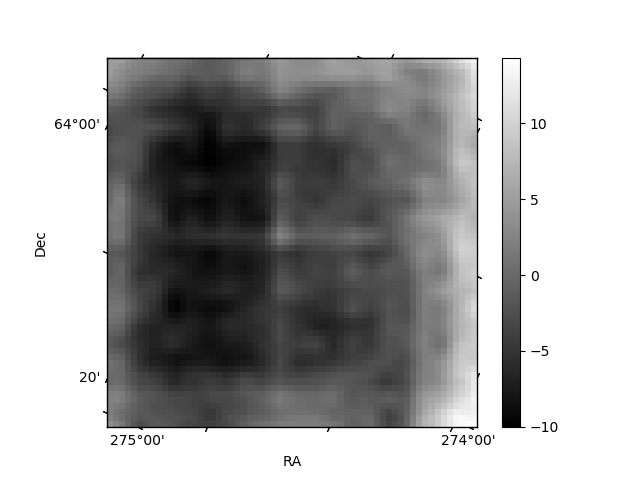
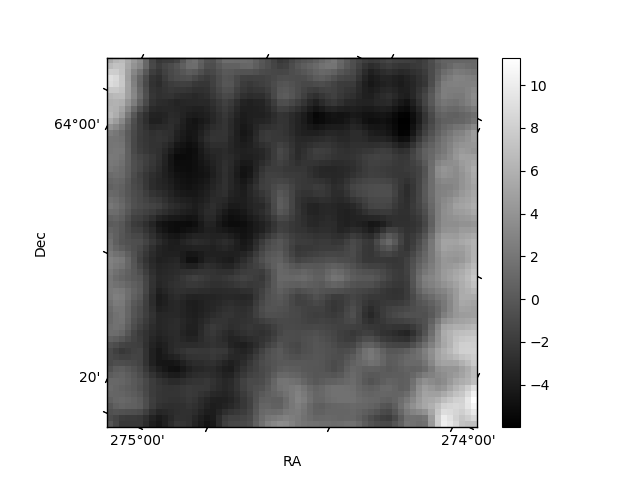
Histogram calculated using DETX and DETY for each event in the final _common_clean file
| Quadrant A | 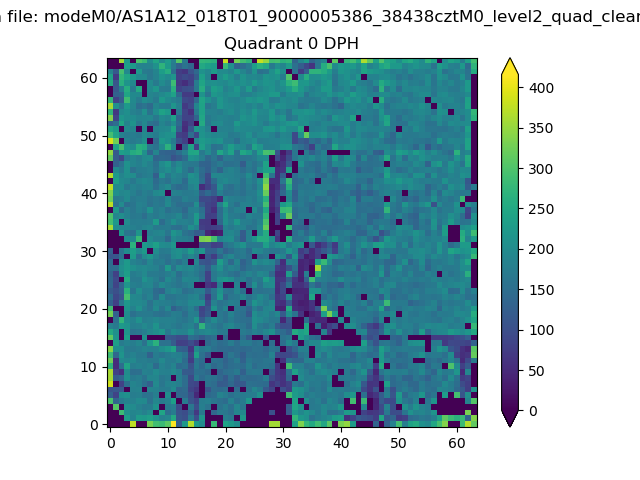 |
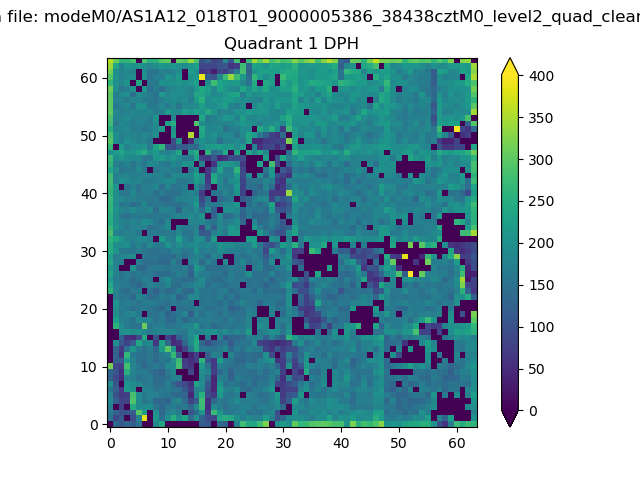 |
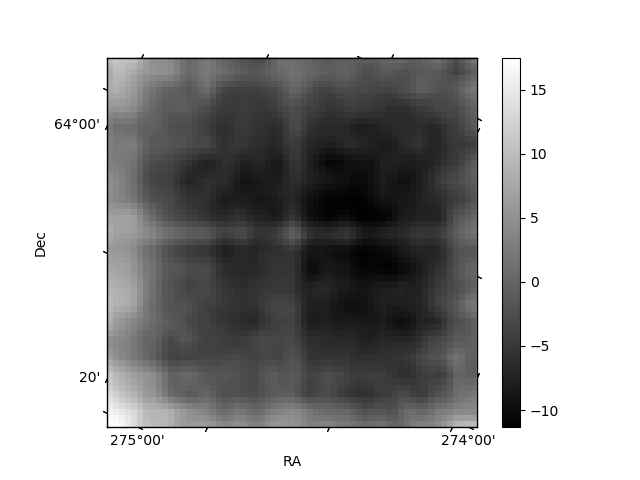
Quadrant B |
|---|---|---|---|
| Quadrant D | 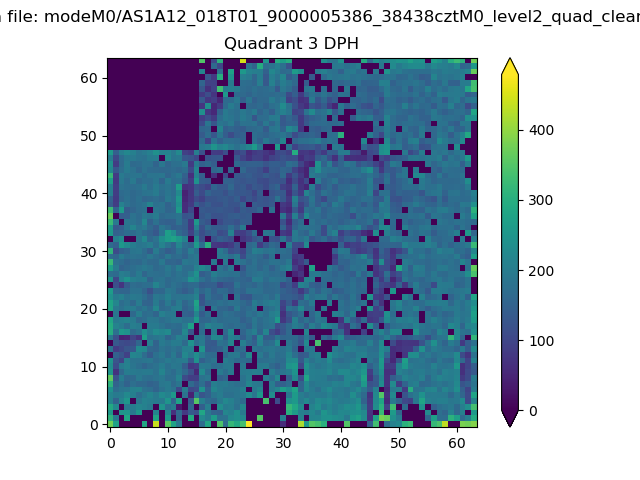 |
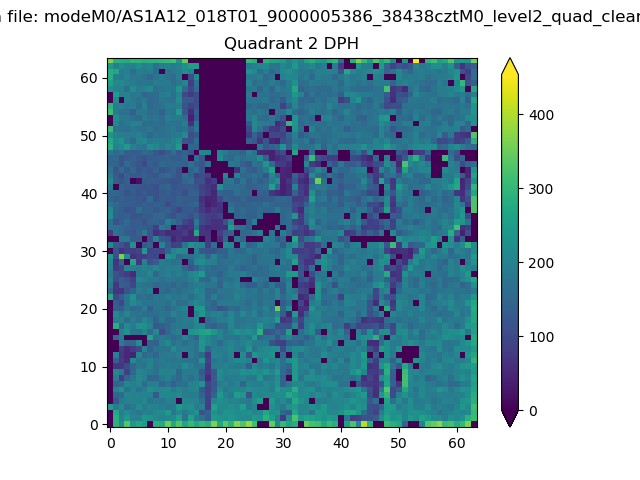 |
Quadrant C |
| Plot type | Count rate plots | Images |
|---|---|---|
| Comparison with Poisson distribution Blue bars denote a histogram of data divided into 1 sec bins. Red curve is a Poisson curve with rate = median count rate of data. |
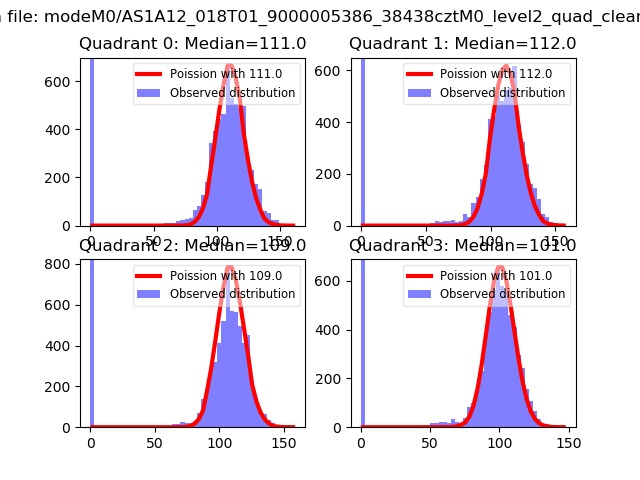 |
 |
| Quadrant-wise count rates Data is divided into 100 sec bins |
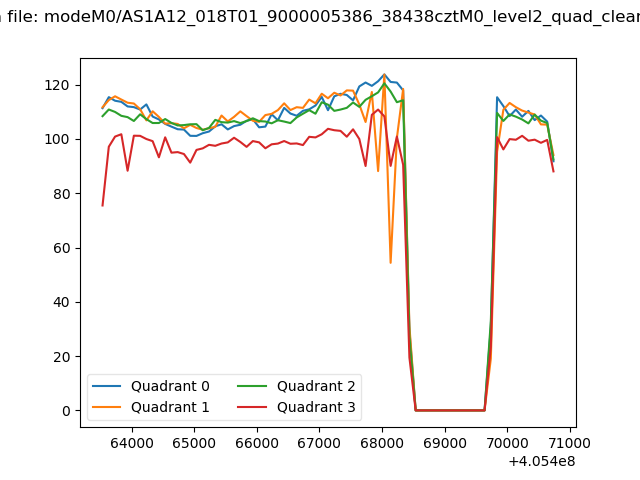 |
|
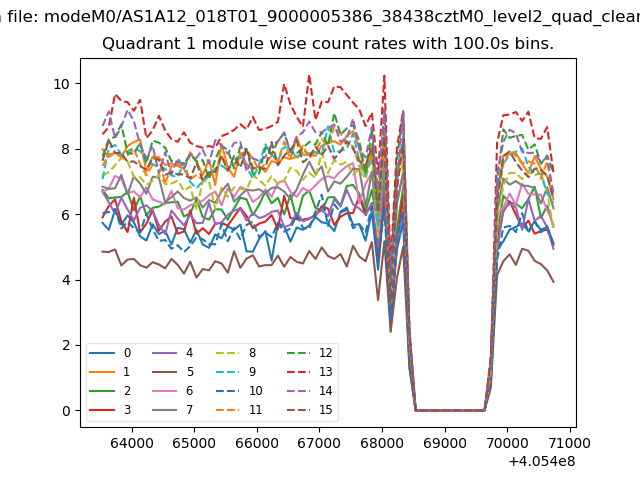
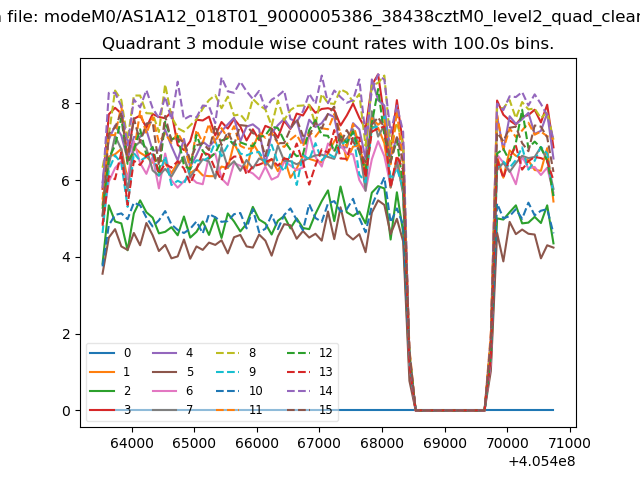
| Module-wise count rates for Quadrant A Data is divided into 100 sec bins |
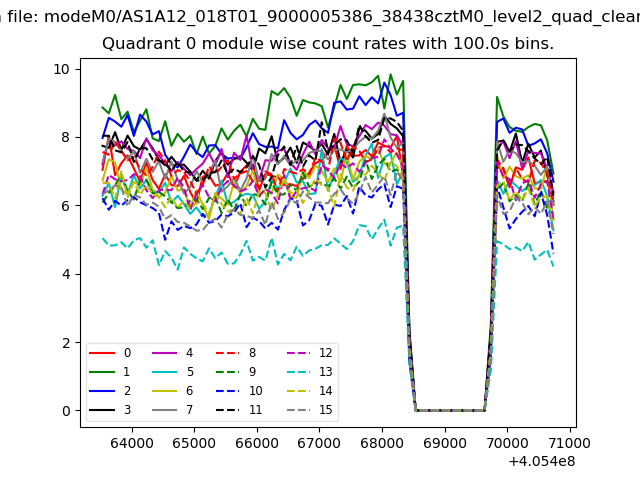 |
 |
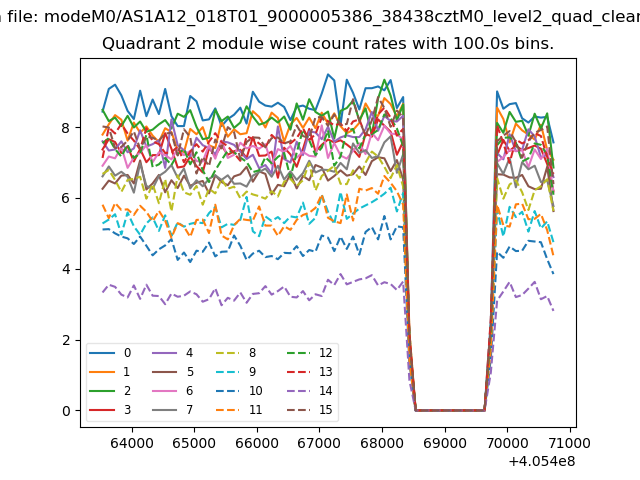
| Module-wise count rates for Quadrant B Data is divided into 100 sec bins |
 |
 |
| Module-wise count rates for Quadrant C Data is divided into 100 sec bins |
 |
 |
| Module-wise count rates for Quadrant D Data is divided into 100 sec bins |
 |
 |
| Parameter | Plot |
|---|---|
| CZT HV Monitor | 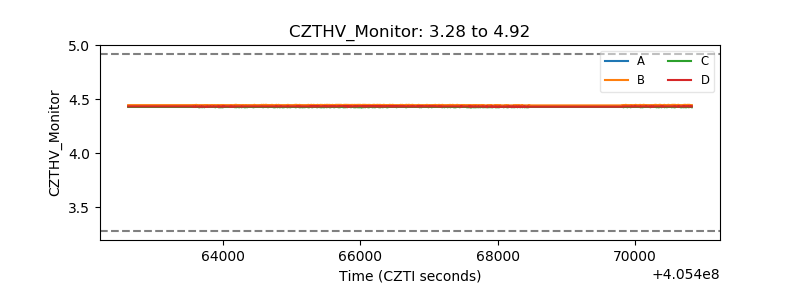 |
| D_VDD | 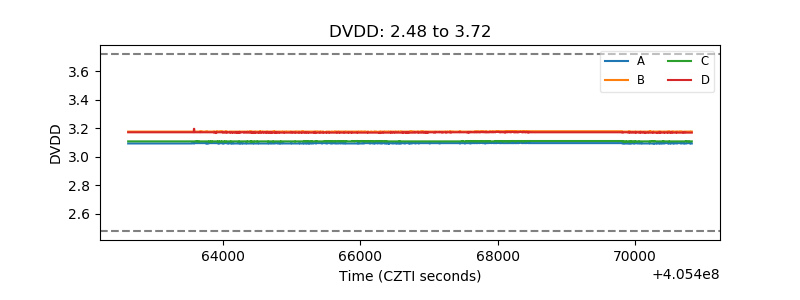 |
| Temperature 1 | 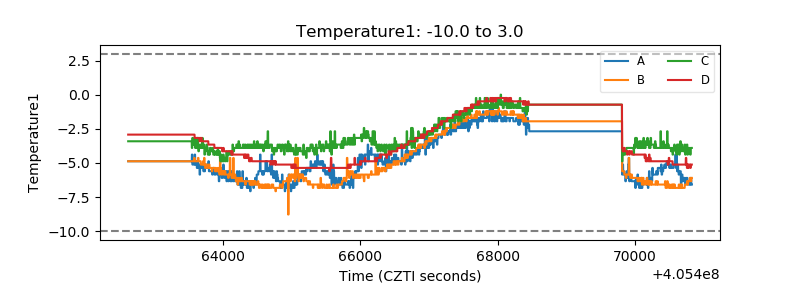 |
| Veto HV Monitor | 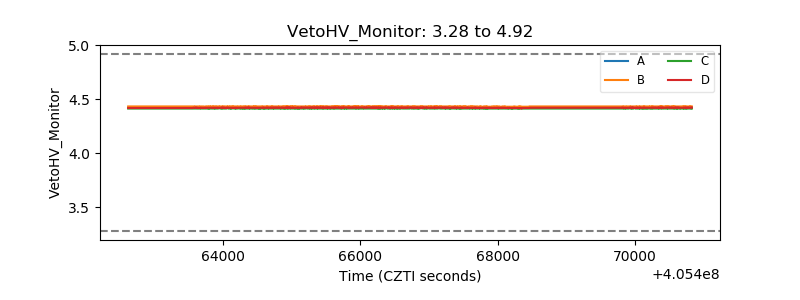 |
| Veto LLD | 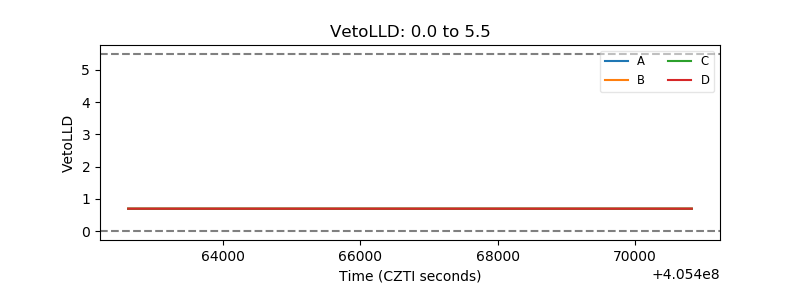 |
| Alpha Counter | 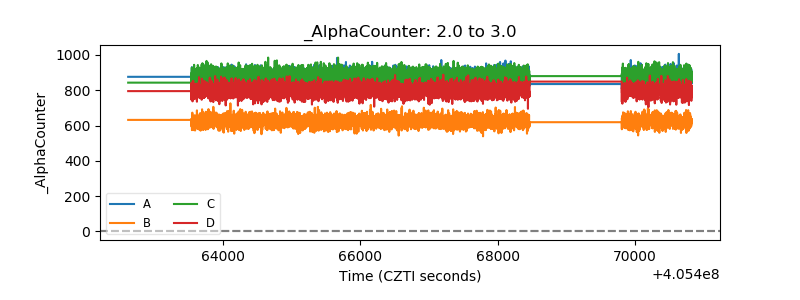 |
| _CPM_Rate |  |
| CZT Counter | 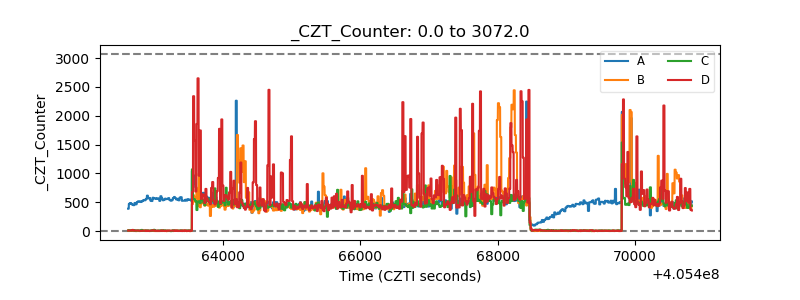 |
| +2.5 Volts monitor | 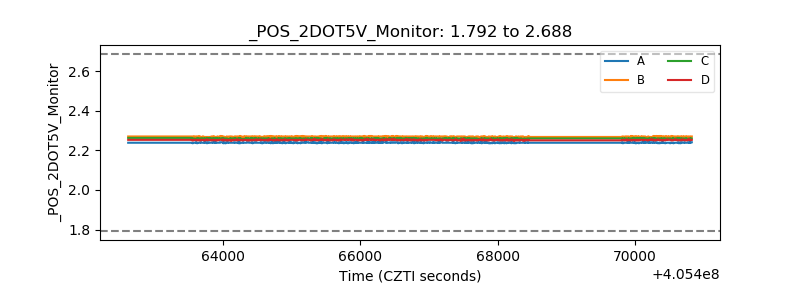 |
| +5 Volts monitor | 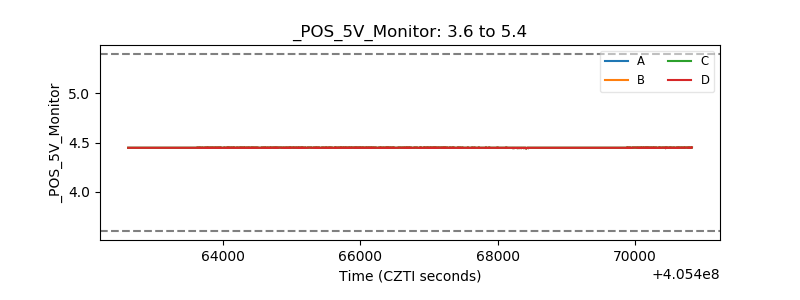 |
| _ROLL_ROT | 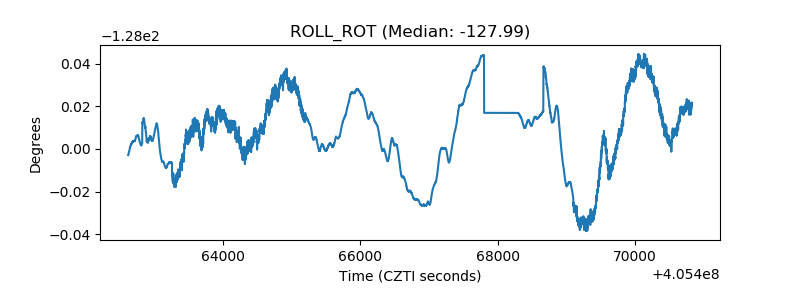 |
| _Roll_DEC | 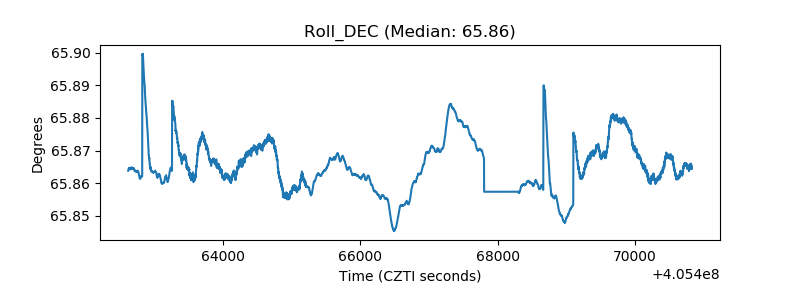 |
| _Roll_RA | 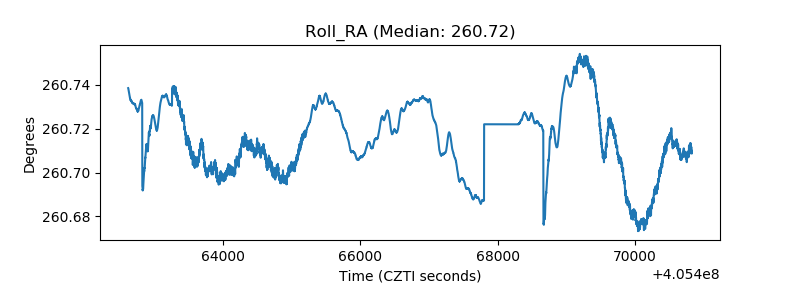 |
| Veto Counter | 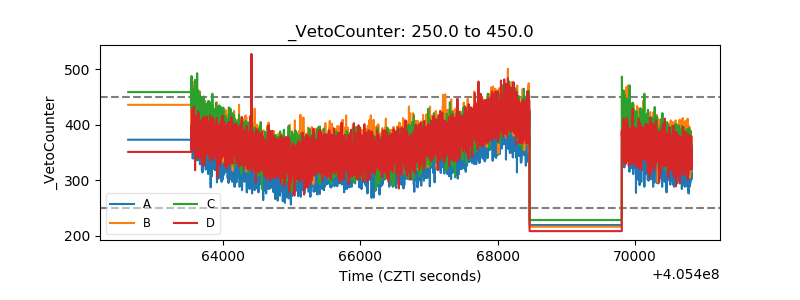 |