| Param | Original file | Final file |
|---|---|---|
| Filename | modeM0/AS1A12_018T01_9000005386_38439cztM0_level2.fits | modeM0/AS1A12_018T01_9000005386_38439cztM0_level2_quad_clean.evt |
| Size (bytes) | 374,238,720 | 95,143,680 |
| Size | 356.9 MB | 90.7 MB |
| Events in quadrant A | 3,107,265 | 638,745 |
| Events in quadrant B | 3,707,510 | 634,939 |
| Events in quadrant C | 2,889,327 | 629,078 |
| Events in quadrant D | 3,698,509 | 572,918 |
| Mode SS | |||
|---|---|---|---|
| Quadrant | BADHDUFLAG | Total packets | Discarded packets |
| A | 0 | 122 | 0 |
| B | 0 | 122 | 0 |
| C | 0 | 122 | 0 |
| D | 0 | 122 | 0 |
| Mode M9 | |||
|---|---|---|---|
| Quadrant | BADHDUFLAG | Total packets | Discarded packets |
| A | 0 | 26 | 0 |
| B | 0 | 26 | 0 |
| C | 0 | 26 | 0 |
| D | 0 | 26 | 0 |
| Mode M0 | |||
|---|---|---|---|
| Quadrant | BADHDUFLAG | Total packets | Discarded packets |
| A | 0 | 12913 | 3 |
| B | 0 | 15016 | 2 |
| C | 0 | 12130 | 2 |
| D | 0 | 15117 | 2 |
| Quadrant | Total seconds | Saturated seconds | Saturation percentage |
|---|---|---|---|
| A | 5789 | 30 | 0.518224% |
| B | 5789 | 221 | 3.817585% |
| C | 5789 | 13 | 0.224564% |
| D | 5789 | 204 | 3.523925% |
Noise dominated data is calculated using 1-second bins in cleaned event files. If a bin has >2000 counts, and if more than 50% of those come from <1% of pixels, then it is considered to be noise-dominated and hence unusable.
| Quadrant | # 1 sec bins | Bins with >0 counts | Bins with >2000 counts | High rate bins dominated by noise | Noise dominated (total time) | Noise dominated (detector-on time) | Marked lightcurve |
|---|---|---|---|---|---|---|---|
| A | 8445 | 5791 | 15 | 15 | 0.18% | 0.26% | 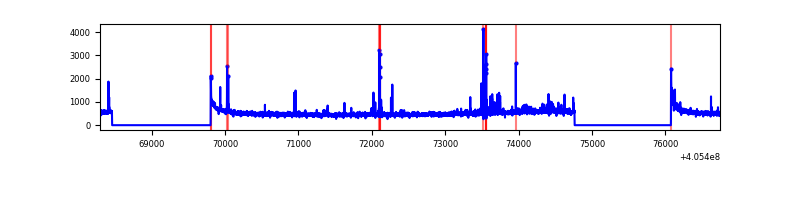 |
| B | 8445 | 5791 | 154 | 154 | 1.82% | 2.66% | 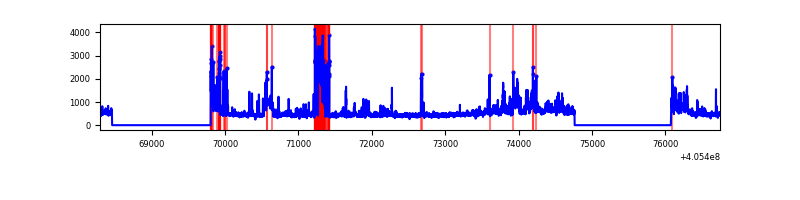 |
| C | 8445 | 5791 | 11 | 11 | 0.13% | 0.19% | 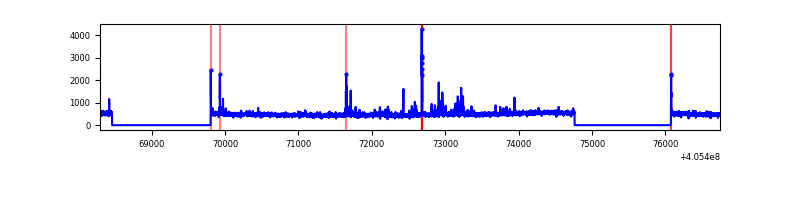 |
| D | 8445 | 5791 | 163 | 163 | 1.93% | 2.81% | 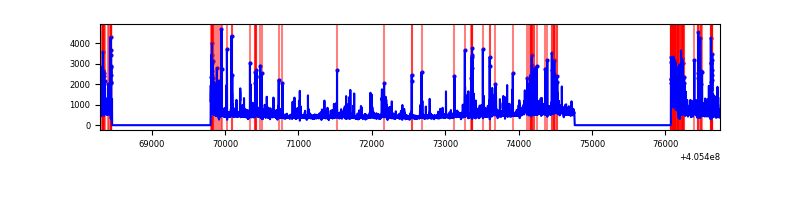 |
Top three noisy pixels from each quadrant. If the there are fewer than three noisy pixels in the level2.evt file, extra rows are filled as -1
| Pixel properties | Quadrant properties | ||||||
|---|---|---|---|---|---|---|---|
| Quadrant | DetID | PixID | Counts | Sigma | Mean | Median | Sigma |
| A | 10 | 83 | 418134 | 3187.65 | 646 | 632 | 131.0 |
| A | 9 | 143 | 131481 | 999.04 | 646 | 632 | 131.0 |
| A | 13 | 248 | 25563 | 190.35 | 646 | 632 | 131.0 |
| B | 8 | 3 | 615589 | 5024.15 | 634 | 616 | 122.4 |
| B | 0 | 183 | 342787 | 2795.44 | 634 | 616 | 122.4 |
| B | 5 | 184 | 135056 | 1098.34 | 634 | 616 | 122.4 |
| C | 15 | 214 | 245238 | 1644.01 | 633 | 636 | 148.8 |
| C | 14 | 254 | 142200 | 951.48 | 633 | 636 | 148.8 |
| C | 0 | 10 | 15346 | 98.87 | 633 | 636 | 148.8 |
| D | 13 | 249 | 375547 | 2466.8 | 624 | 606 | 152.0 |
| D | 2 | 153 | 215219 | 1411.97 | 624 | 606 | 152.0 |
| D | 2 | 16 | 190788 | 1251.24 | 624 | 606 | 152.0 |
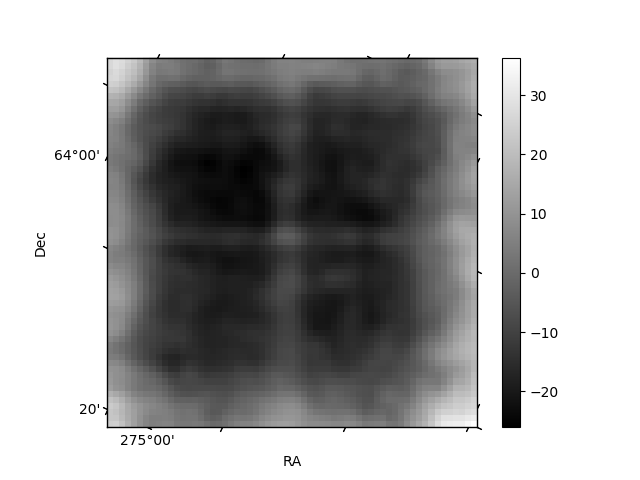
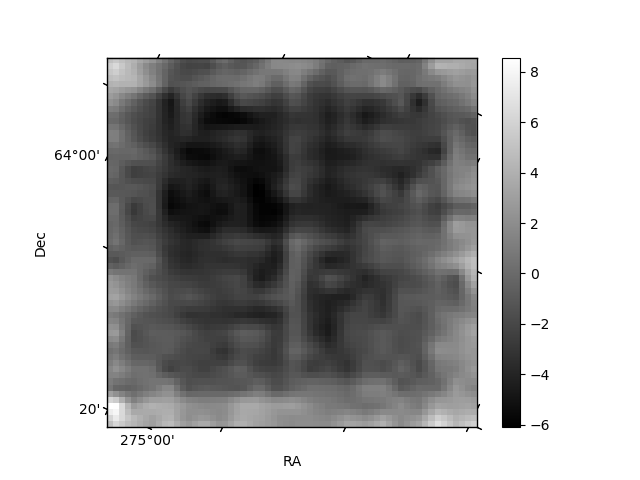
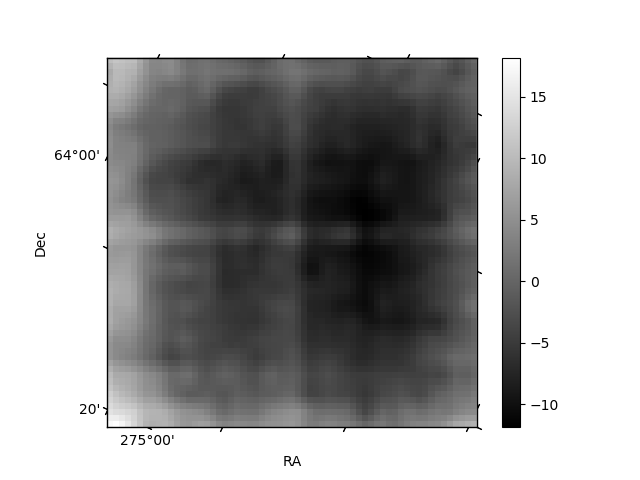
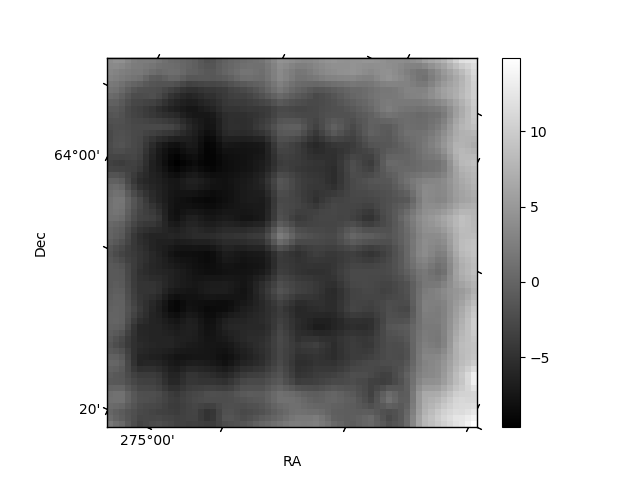
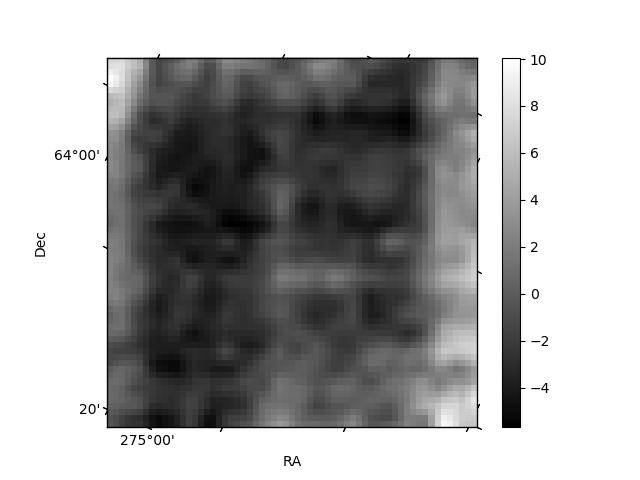
Histogram calculated using DETX and DETY for each event in the final _common_clean file
| Quadrant A | 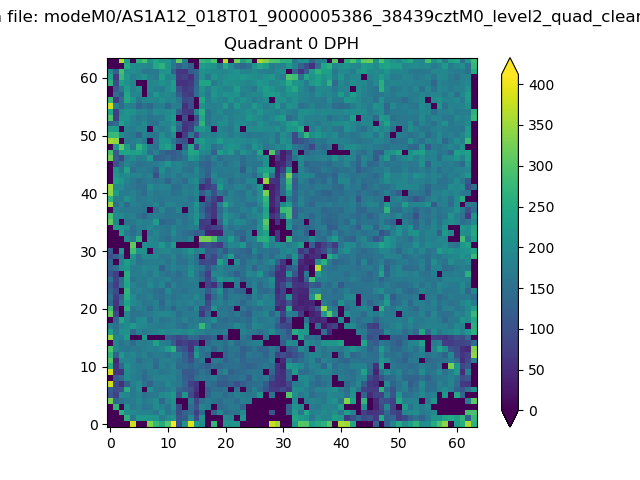 |
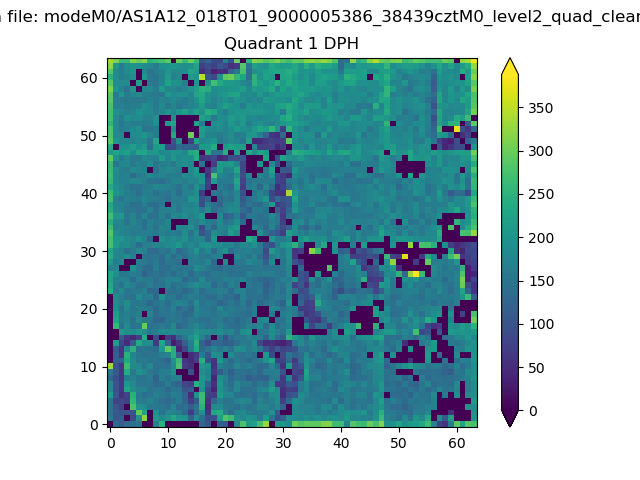 |
Quadrant B |
|---|---|---|---|
| Quadrant D | 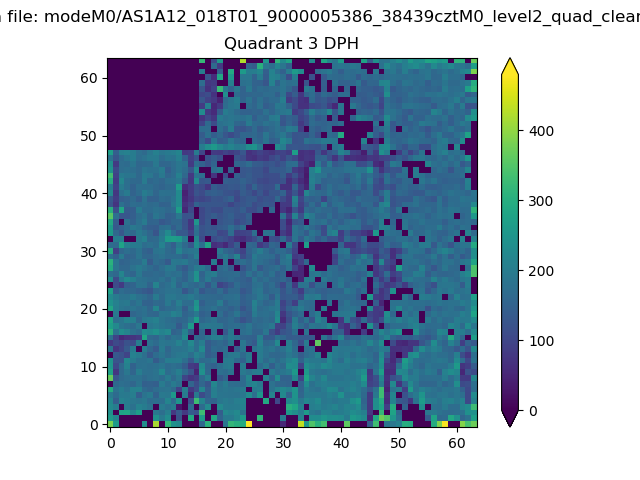 |
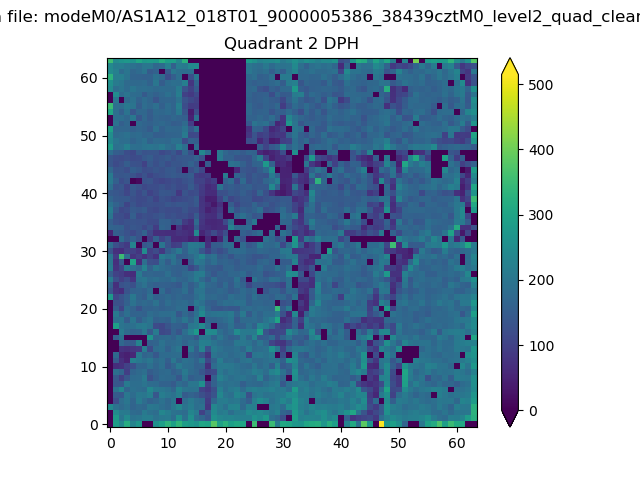 |
Quadrant C |
| Plot type | Count rate plots | Images |
|---|---|---|
| Comparison with Poisson distribution Blue bars denote a histogram of data divided into 1 sec bins. Red curve is a Poisson curve with rate = median count rate of data. |
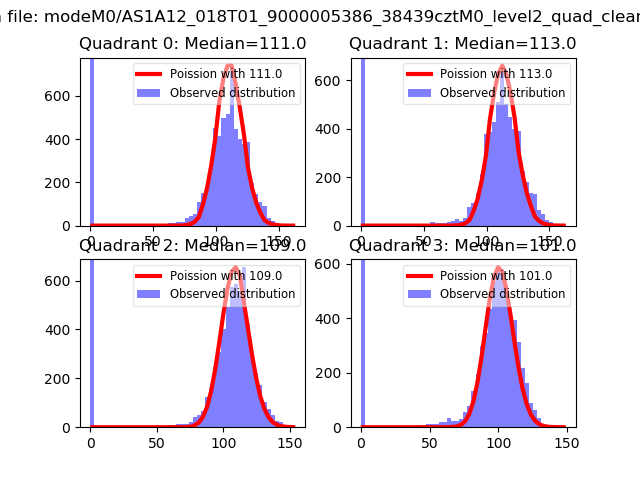 |
 |
| Quadrant-wise count rates Data is divided into 100 sec bins |
 |
|
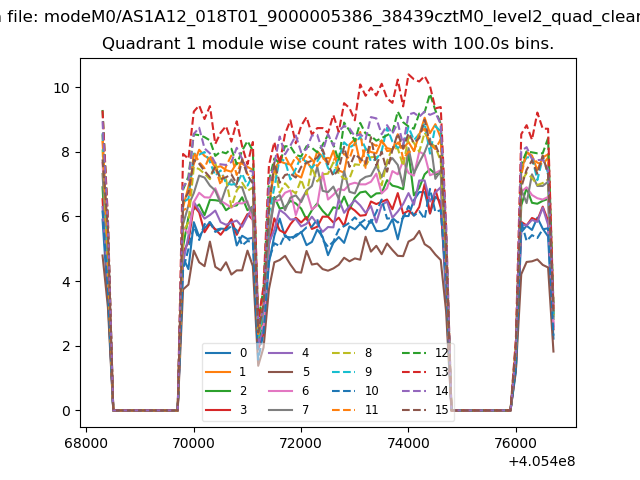
| Module-wise count rates for Quadrant A Data is divided into 100 sec bins |
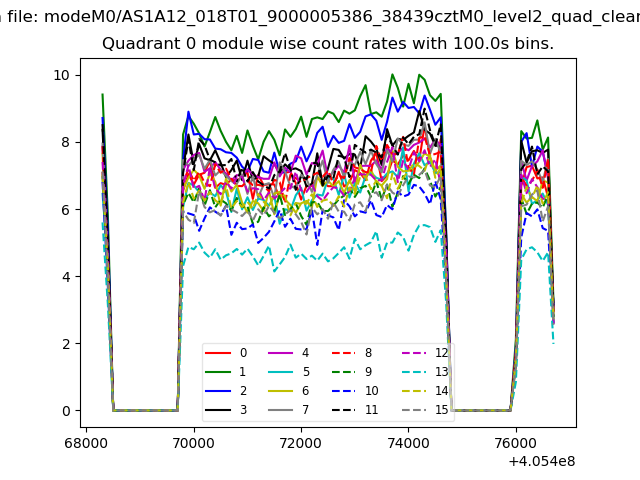 |
 |
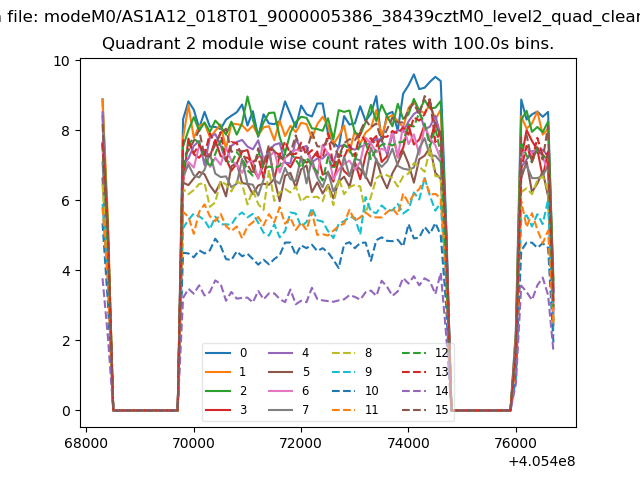
| Module-wise count rates for Quadrant B Data is divided into 100 sec bins |
 |
 |
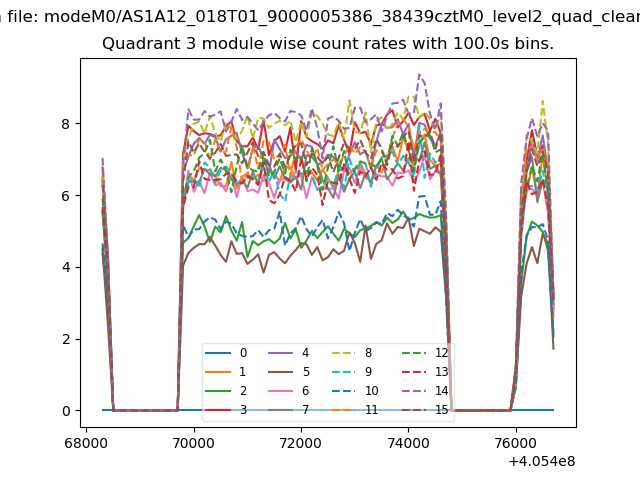
| Module-wise count rates for Quadrant C Data is divided into 100 sec bins |
 |
 |
| Module-wise count rates for Quadrant D Data is divided into 100 sec bins |
 |
 |
| Parameter | Plot |
|---|---|
| CZT HV Monitor |  |
| D_VDD | 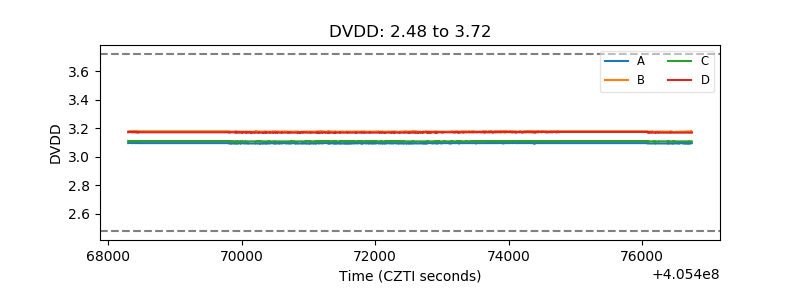 |
| Temperature 1 | 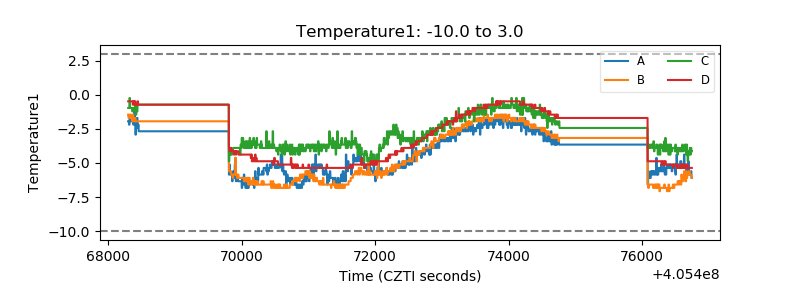 |
| Veto HV Monitor | 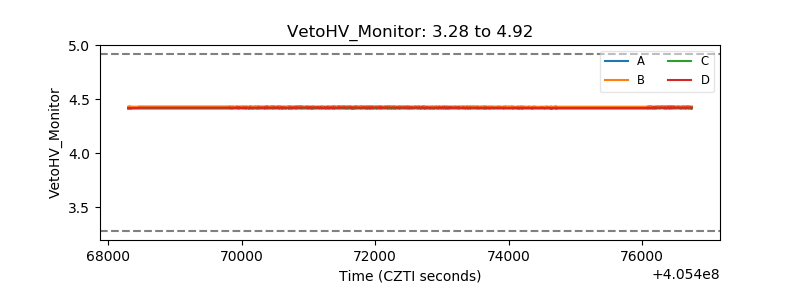 |
| Veto LLD | 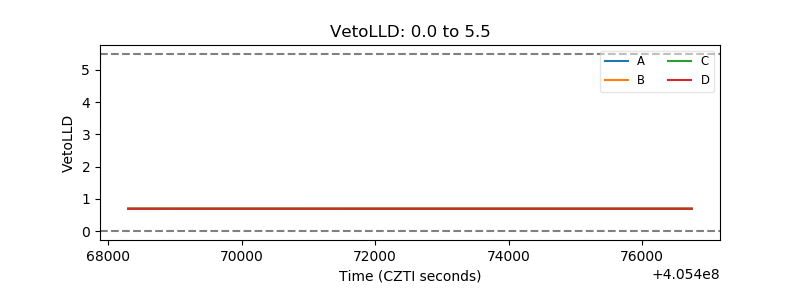 |
| Alpha Counter | 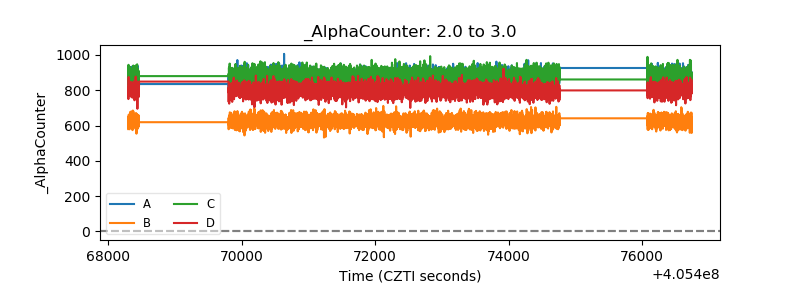 |
| _CPM_Rate | 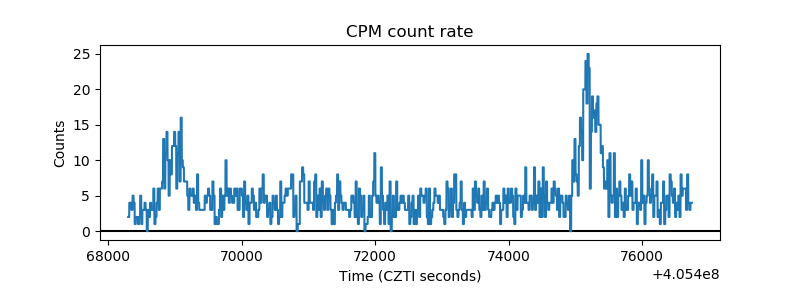 |
| CZT Counter | 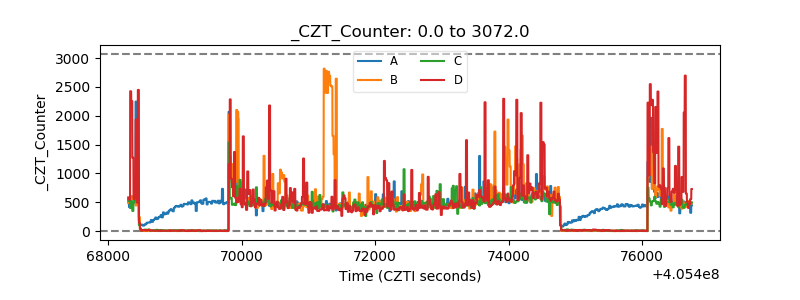 |
| +2.5 Volts monitor | 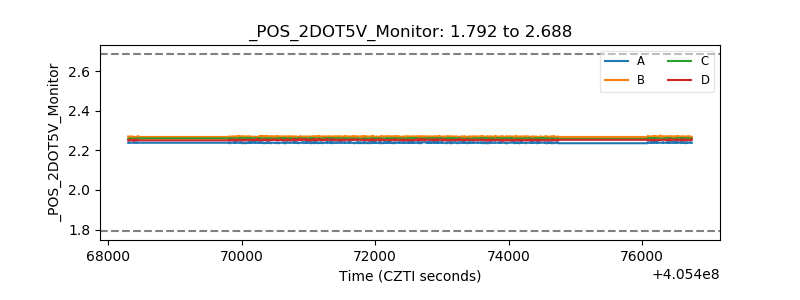 |
| +5 Volts monitor | 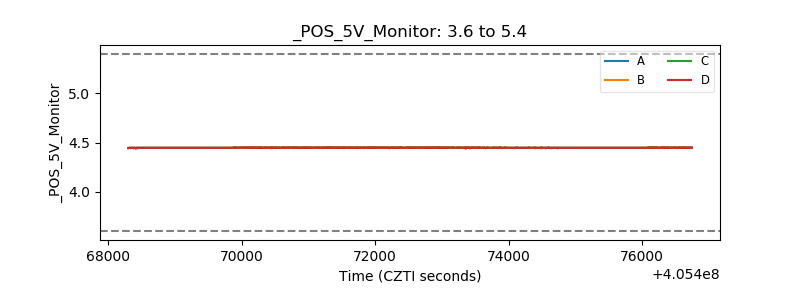 |
| _ROLL_ROT | 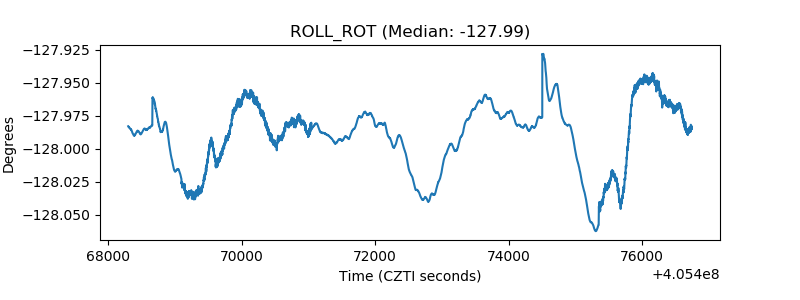 |
| _Roll_DEC | 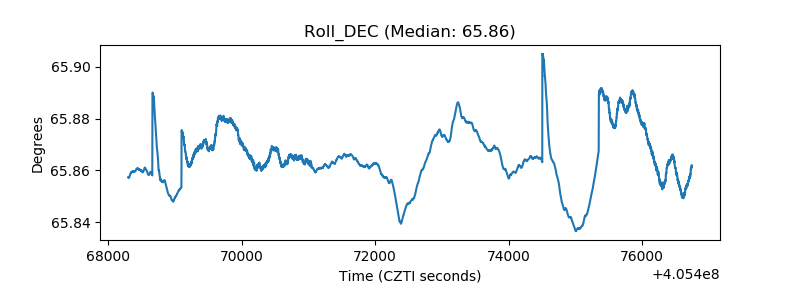 |
| _Roll_RA | 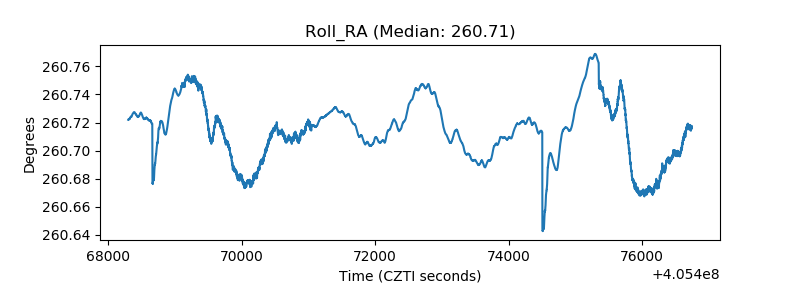 |
| Veto Counter | 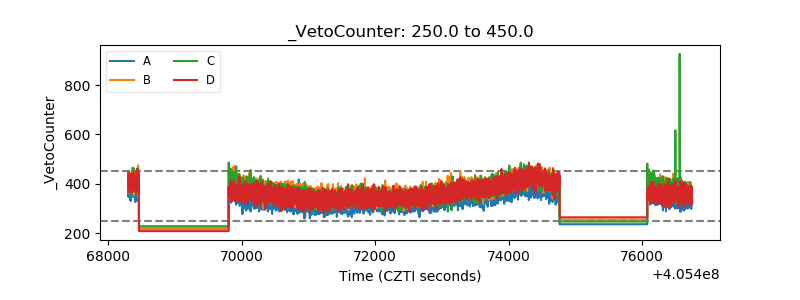 |