| Param | Original file | Final file |
|---|---|---|
| Filename | modeM0/AS1A12_018T01_9000005386_38441cztM0_level2.fits | modeM0/AS1A12_018T01_9000005386_38441cztM0_level2_quad_clean.evt |
| Size (bytes) | 649,008,000 | 175,567,680 |
| Size | 618.9 MB | 167.4 MB |
| Events in quadrant A | 5,591,974 | 1,173,048 |
| Events in quadrant B | 5,954,198 | 1,188,880 |
| Events in quadrant C | 5,377,854 | 1,156,582 |
| Events in quadrant D | 6,270,041 | 1,055,583 |
| Mode SS | |||
|---|---|---|---|
| Quadrant | BADHDUFLAG | Total packets | Discarded packets |
| A | 0 | 220 | 0 |
| B | 0 | 220 | 0 |
| C | 0 | 220 | 0 |
| D | 0 | 220 | 0 |
| Mode M9 | |||
|---|---|---|---|
| Quadrant | BADHDUFLAG | Total packets | Discarded packets |
| A | 0 | 32 | 0 |
| B | 0 | 32 | 0 |
| C | 0 | 32 | 0 |
| D | 0 | 33 | 0 |
| Mode M0 | |||
|---|---|---|---|
| Quadrant | BADHDUFLAG | Total packets | Discarded packets |
| A | 0 | 23119 | 4 |
| B | 0 | 24972 | 3 |
| C | 0 | 22667 | 3 |
| D | 0 | 26186 | 3 |
| Quadrant | Total seconds | Saturated seconds | Saturation percentage |
|---|---|---|---|
| A | 10703 | 44 | 0.411100% |
| B | 10703 | 215 | 2.008783% |
| C | 10703 | 22 | 0.205550% |
| D | 10703 | 215 | 2.008783% |
Noise dominated data is calculated using 1-second bins in cleaned event files. If a bin has >2000 counts, and if more than 50% of those come from <1% of pixels, then it is considered to be noise-dominated and hence unusable.
| Quadrant | # 1 sec bins | Bins with >0 counts | Bins with >2000 counts | High rate bins dominated by noise | Noise dominated (total time) | Noise dominated (detector-on time) | Marked lightcurve |
|---|---|---|---|---|---|---|---|
| A | 13569 | 10705 | 28 | 28 | 0.21% | 0.26% | 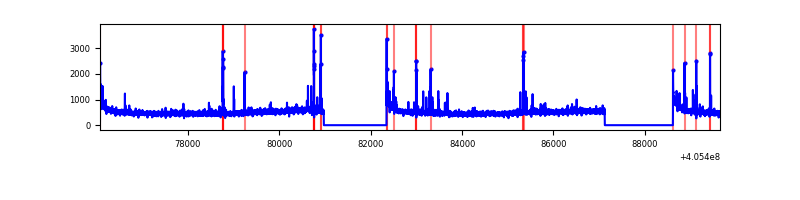 |
| B | 13569 | 10705 | 123 | 123 | 0.91% | 1.15% | 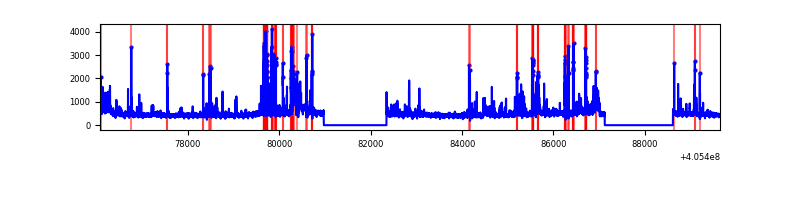 |
| C | 13569 | 10705 | 18 | 18 | 0.13% | 0.17% | 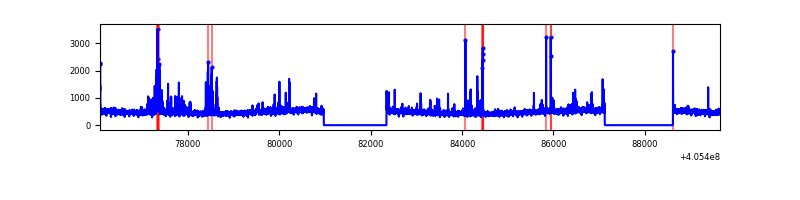 |
| D | 13569 | 10705 | 161 | 161 | 1.19% | 1.50% | 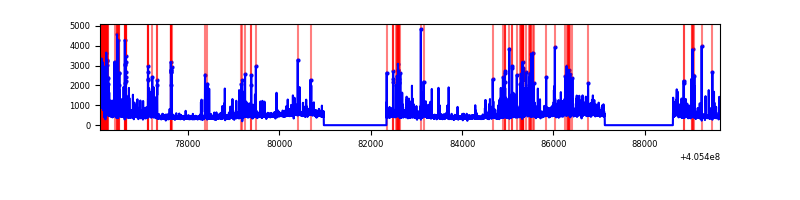 |
Top three noisy pixels from each quadrant. If the there are fewer than three noisy pixels in the level2.evt file, extra rows are filled as -1
| Pixel properties | Quadrant properties | ||||||
|---|---|---|---|---|---|---|---|
| Quadrant | DetID | PixID | Counts | Sigma | Mean | Median | Sigma |
| A | 10 | 83 | 732017 | 3038.98 | 1194 | 1171 | 240.5 |
| A | 9 | 143 | 156549 | 646.09 | 1194 | 1171 | 240.5 |
| A | 13 | 248 | 54765 | 222.85 | 1194 | 1171 | 240.5 |
| B | 0 | 183 | 423441 | 1870.6 | 1180 | 1149 | 225.8 |
| B | 4 | 232 | 375747 | 1659.33 | 1180 | 1149 | 225.8 |
| B | 5 | 184 | 219611 | 967.71 | 1180 | 1149 | 225.8 |
| C | 15 | 214 | 448824 | 1659.01 | 1162 | 1167 | 269.8 |
| C | 14 | 254 | 326038 | 1203.96 | 1162 | 1167 | 269.8 |
| C | 3 | 233 | 21362 | 74.84 | 1162 | 1167 | 269.8 |
| D | 2 | 250 | 342064 | 1229.15 | 1156 | 1125 | 277.4 |
| D | 13 | 249 | 228630 | 820.2 | 1156 | 1125 | 277.4 |
| D | 12 | 235 | 201616 | 722.81 | 1156 | 1125 | 277.4 |
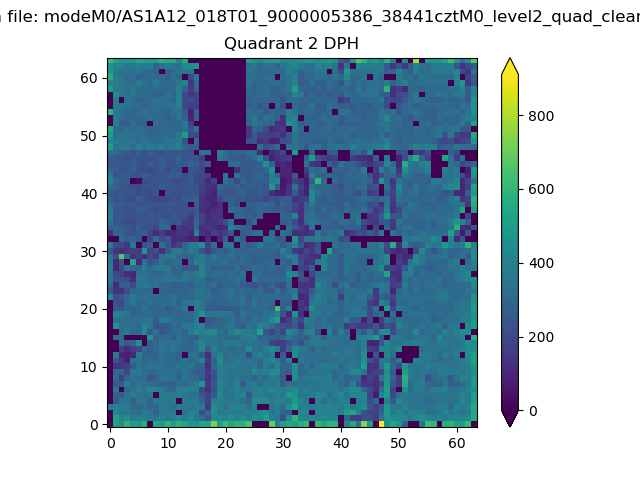
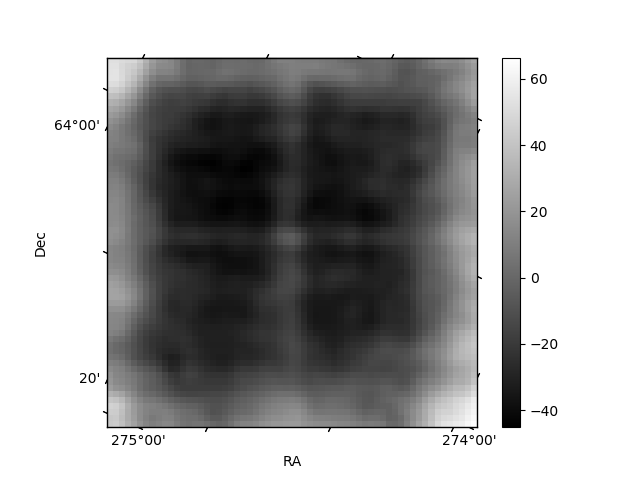
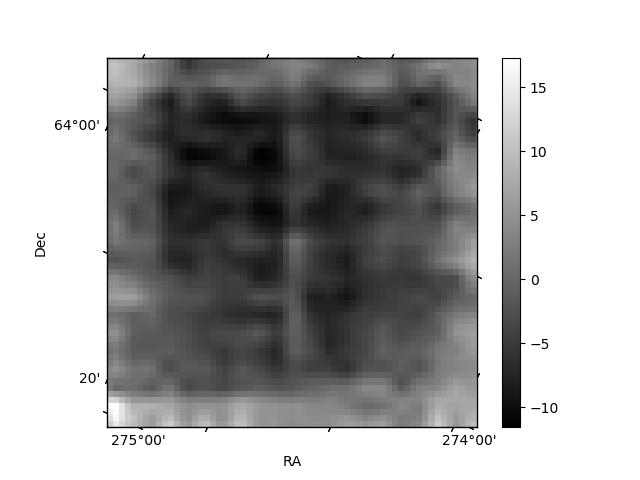
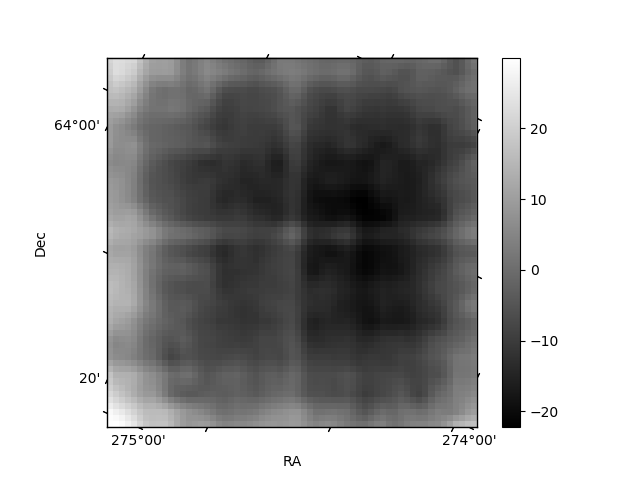
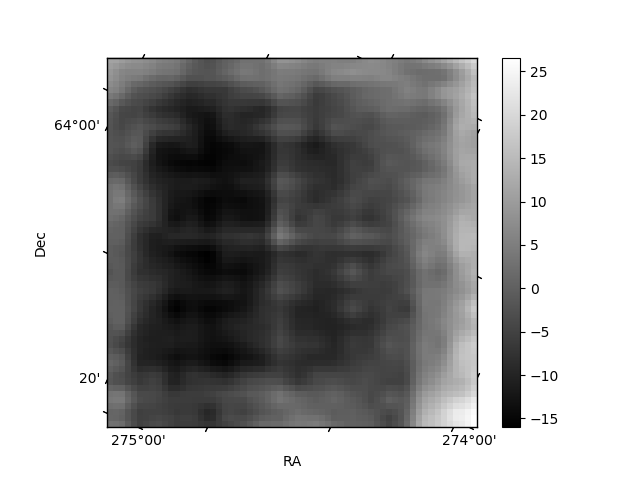
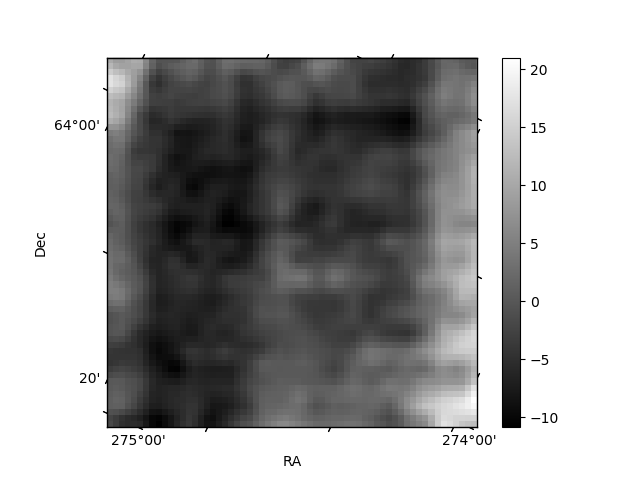
Histogram calculated using DETX and DETY for each event in the final _common_clean file
| Quadrant A | 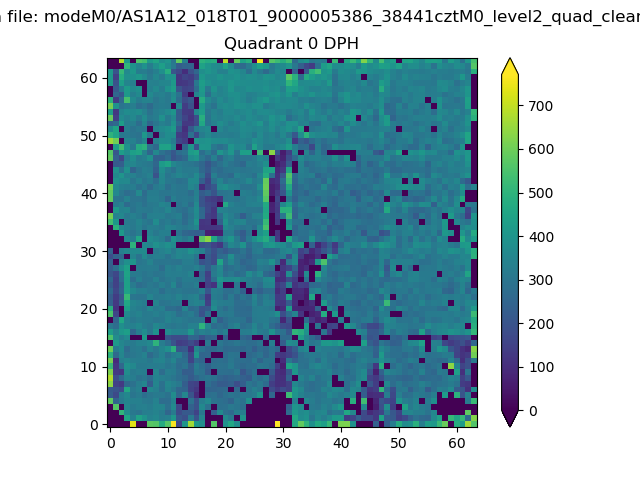 |
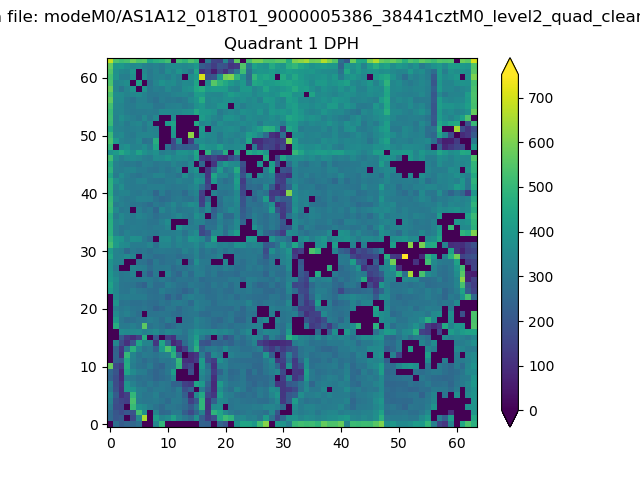 |
Quadrant B |
|---|---|---|---|
| Quadrant D | 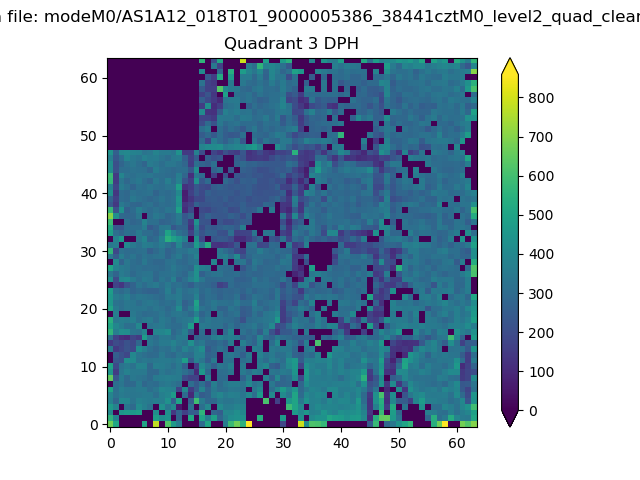 |
 |
Quadrant C |
| Plot type | Count rate plots | Images |
|---|---|---|
| Comparison with Poisson distribution Blue bars denote a histogram of data divided into 1 sec bins. Red curve is a Poisson curve with rate = median count rate of data. |
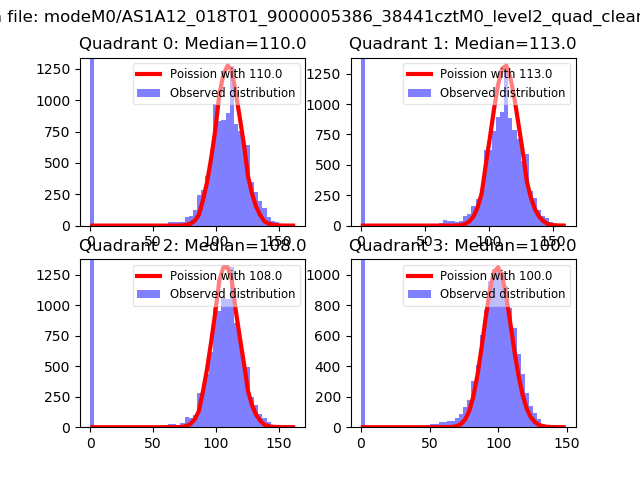 |
 |
| Quadrant-wise count rates Data is divided into 100 sec bins |
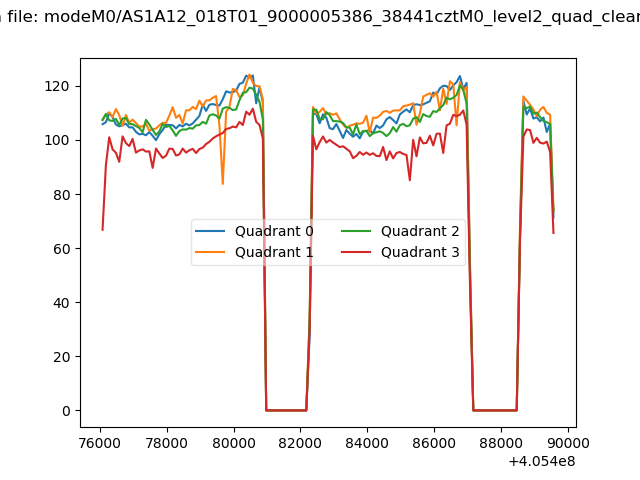 |
|
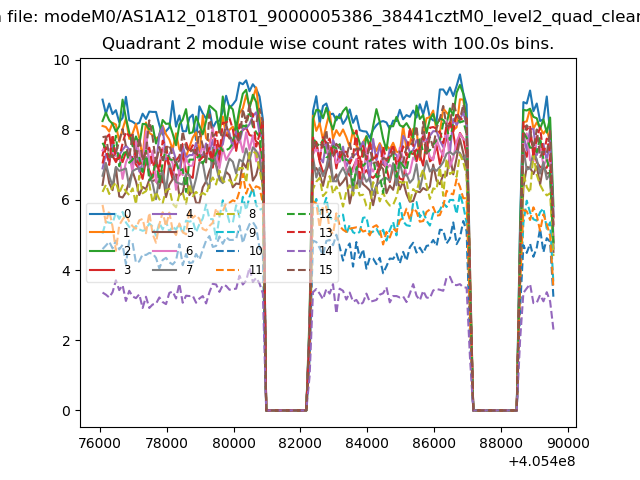
| Module-wise count rates for Quadrant A Data is divided into 100 sec bins |
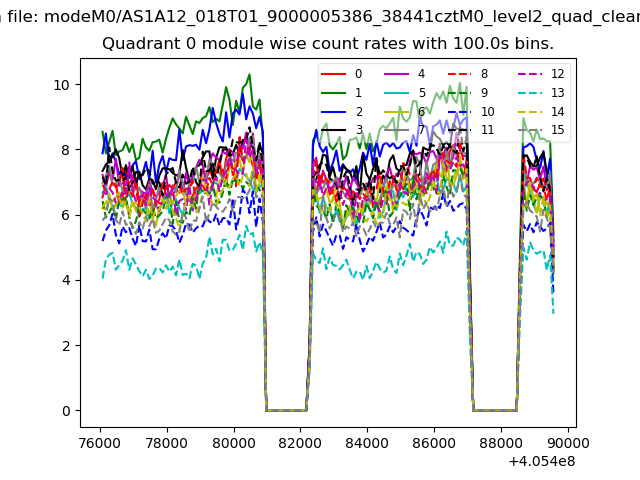 |
 |
| Module-wise count rates for Quadrant B Data is divided into 100 sec bins |
 |
 |
| Module-wise count rates for Quadrant C Data is divided into 100 sec bins |
 |
 |
| Module-wise count rates for Quadrant D Data is divided into 100 sec bins |
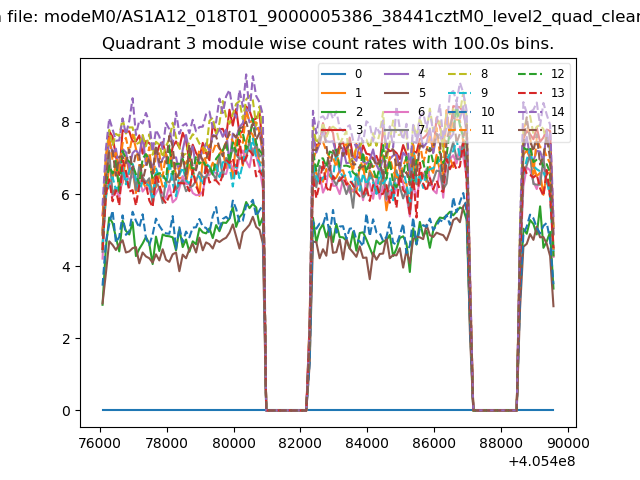 |
 |
| Parameter | Plot |
|---|---|
| CZT HV Monitor | 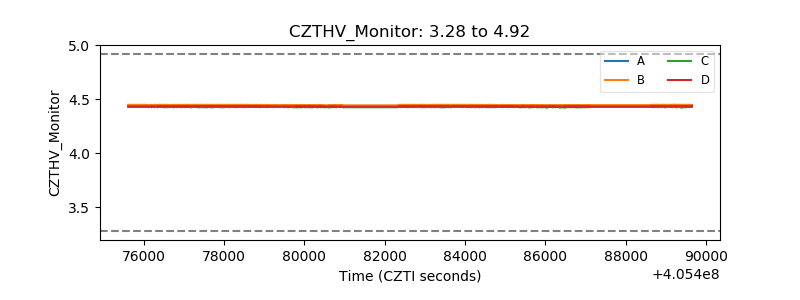 |
| D_VDD | 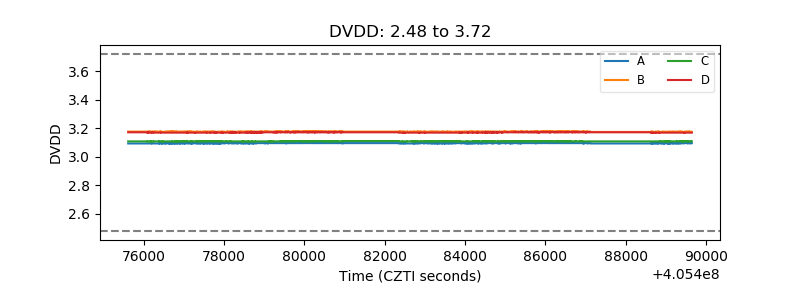 |
| Temperature 1 | 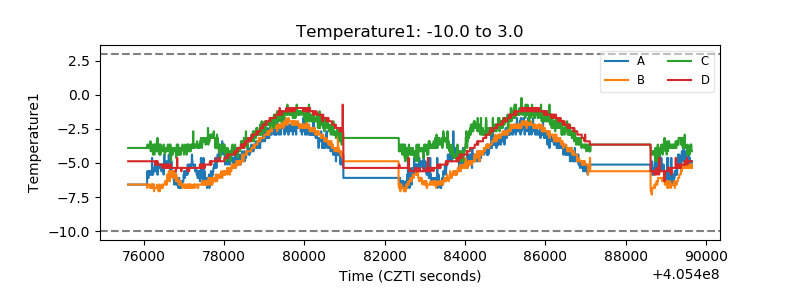 |
| Veto HV Monitor | 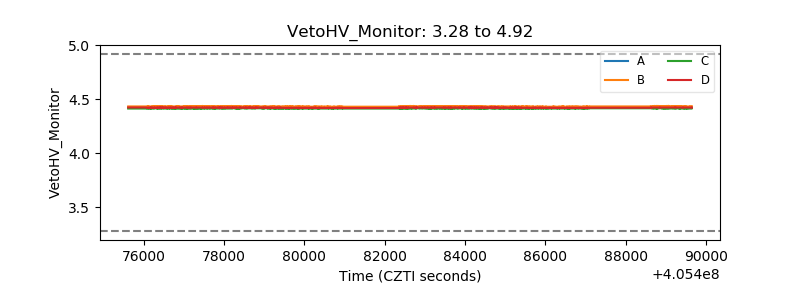 |
| Veto LLD | 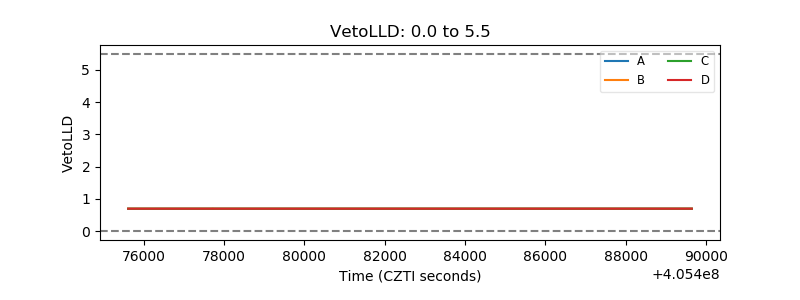 |
| Alpha Counter | 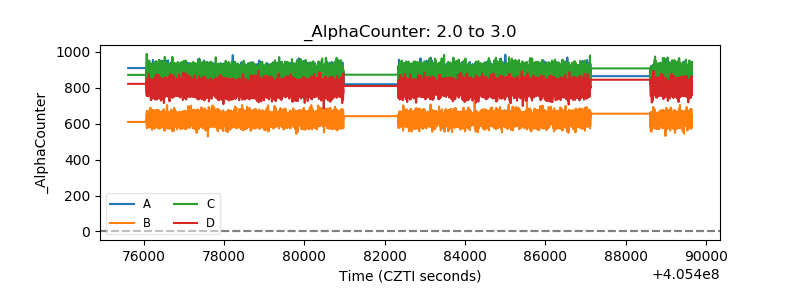 |
| _CPM_Rate | 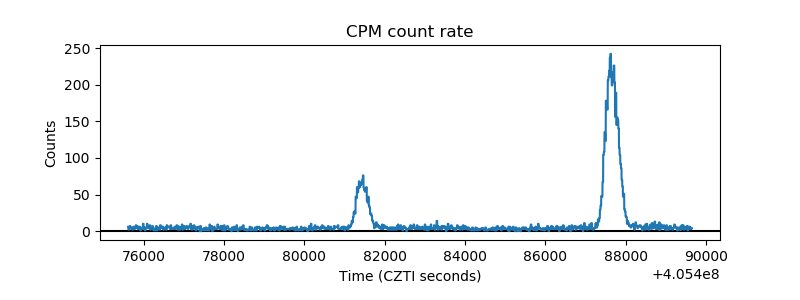 |
| CZT Counter | 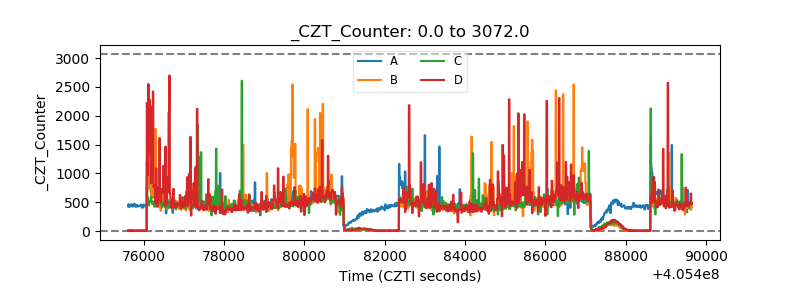 |
| +2.5 Volts monitor | 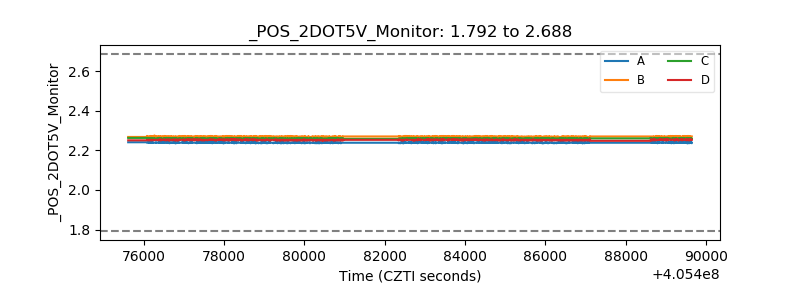 |
| +5 Volts monitor | 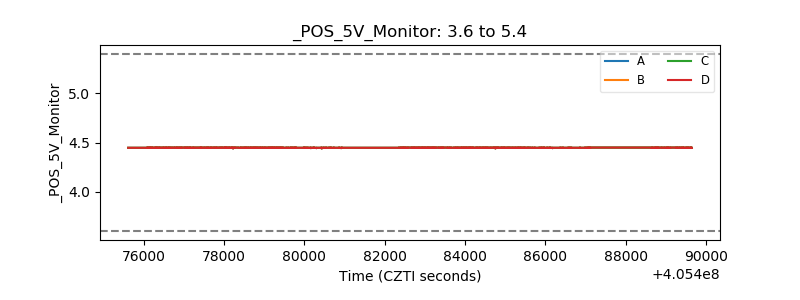 |
| _ROLL_ROT | 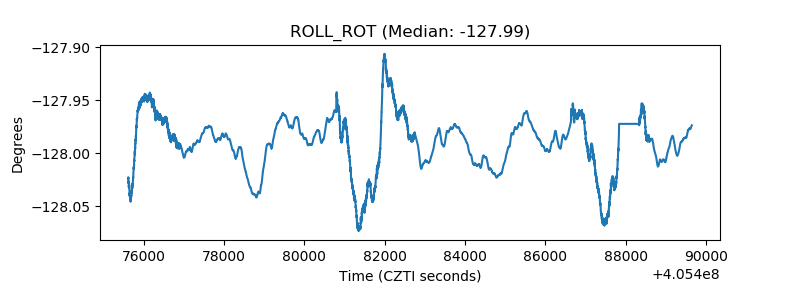 |
| _Roll_DEC | 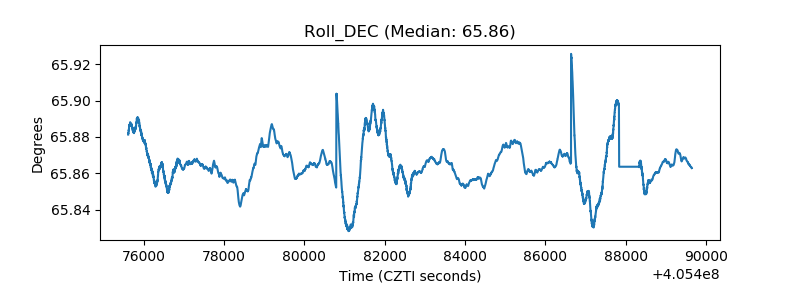 |
| _Roll_RA | 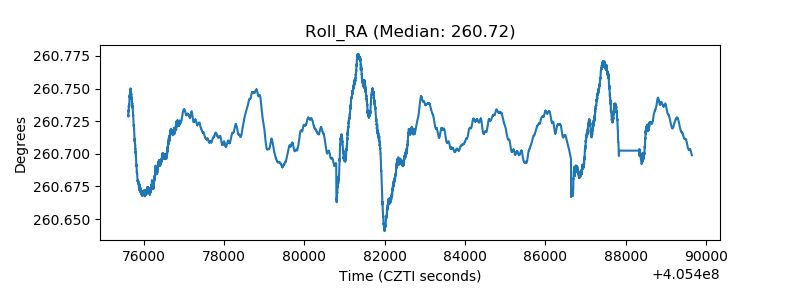 |
| Veto Counter | 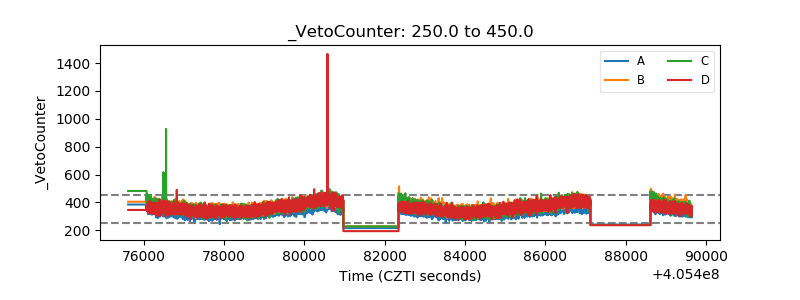 |