| Param | Original file | Final file |
|---|---|---|
| Filename | modeM0/AS1A12_018T01_9000005386_38442cztM0_level2.fits | modeM0/AS1A12_018T01_9000005386_38442cztM0_level2_quad_clean.evt |
| Size (bytes) | 352,140,480 | 93,602,880 |
| Size | 335.8 MB | 89.3 MB |
| Events in quadrant A | 2,940,701 | 632,513 |
| Events in quadrant B | 3,800,611 | 630,586 |
| Events in quadrant C | 2,645,610 | 613,631 |
| Events in quadrant D | 3,210,718 | 564,437 |
| Mode SS | |||
|---|---|---|---|
| Quadrant | BADHDUFLAG | Total packets | Discarded packets |
| A | 0 | 114 | 0 |
| B | 0 | 114 | 0 |
| C | 0 | 114 | 0 |
| D | 0 | 114 | 0 |
| Mode M9 | |||
|---|---|---|---|
| Quadrant | BADHDUFLAG | Total packets | Discarded packets |
| A | 0 | 19 | 0 |
| B | 0 | 19 | 0 |
| C | 0 | 19 | 0 |
| D | 0 | 20 | 0 |
| Mode M0 | |||
|---|---|---|---|
| Quadrant | BADHDUFLAG | Total packets | Discarded packets |
| A | 0 | 12182 | 3 |
| B | 0 | 15162 | 2 |
| C | 0 | 11383 | 2 |
| D | 0 | 13333 | 2 |
| Quadrant | Total seconds | Saturated seconds | Saturation percentage |
|---|---|---|---|
| A | 5619 | 18 | 0.320342% |
| B | 5619 | 217 | 3.861897% |
| C | 5619 | 5 | 0.088984% |
| D | 5619 | 62 | 1.103399% |
Noise dominated data is calculated using 1-second bins in cleaned event files. If a bin has >2000 counts, and if more than 50% of those come from <1% of pixels, then it is considered to be noise-dominated and hence unusable.
| Quadrant | # 1 sec bins | Bins with >0 counts | Bins with >2000 counts | High rate bins dominated by noise | Noise dominated (total time) | Noise dominated (detector-on time) | Marked lightcurve |
|---|---|---|---|---|---|---|---|
| A | 7201 | 5620 | 8 | 8 | 0.11% | 0.14% | 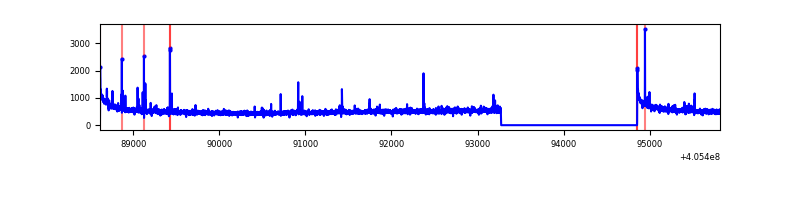 |
| B | 7201 | 5620 | 112 | 112 | 1.56% | 1.99% | 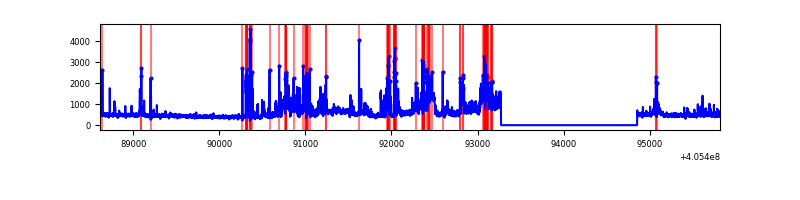 |
| C | 7201 | 5620 | 1 | 1 | 0.01% | 0.02% | 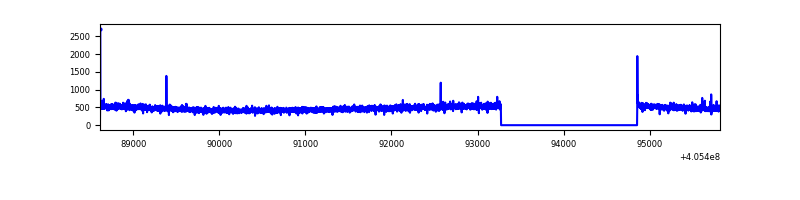 |
| D | 7201 | 5620 | 42 | 42 | 0.58% | 0.75% | 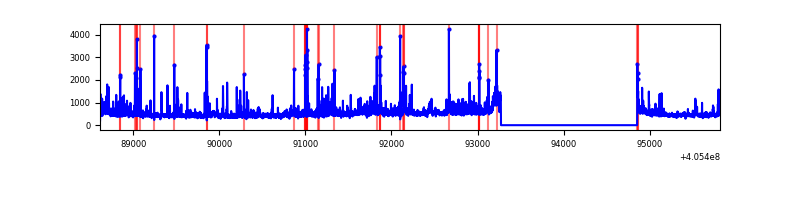 |
Top three noisy pixels from each quadrant. If the there are fewer than three noisy pixels in the level2.evt file, extra rows are filled as -1
| Pixel properties | Quadrant properties | ||||||
|---|---|---|---|---|---|---|---|
| Quadrant | DetID | PixID | Counts | Sigma | Mean | Median | Sigma |
| A | 10 | 83 | 412571 | 3232.77 | 630 | 617 | 127.4 |
| A | 9 | 143 | 72038 | 560.47 | 630 | 617 | 127.4 |
| A | 13 | 248 | 11286 | 83.72 | 630 | 617 | 127.4 |
| B | 8 | 3 | 597394 | 5031.58 | 618 | 599 | 118.6 |
| B | 0 | 183 | 528509 | 4450.81 | 618 | 599 | 118.6 |
| B | 4 | 232 | 139846 | 1173.99 | 618 | 599 | 118.6 |
| C | 15 | 214 | 239839 | 1679.17 | 609 | 612 | 142.5 |
| C | 0 | 10 | 11282 | 74.89 | 609 | 612 | 142.5 |
| C | 14 | 254 | 9827 | 64.68 | 609 | 612 | 142.5 |
| D | 12 | 235 | 157114 | 1063.21 | 606 | 589 | 147.2 |
| D | 2 | 16 | 136204 | 921.18 | 606 | 589 | 147.2 |
| D | 2 | 250 | 128327 | 867.67 | 606 | 589 | 147.2 |
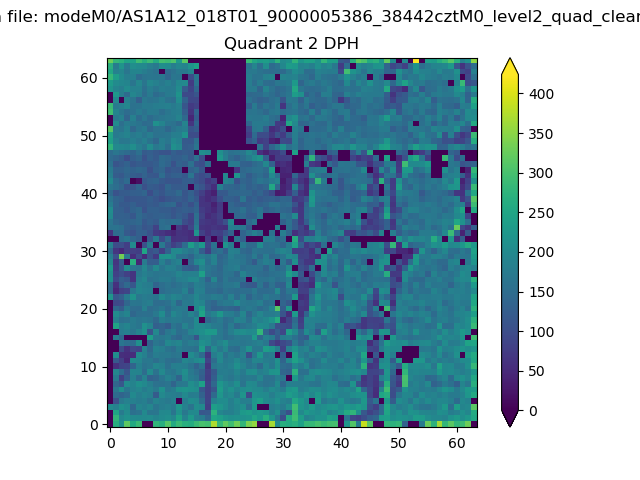
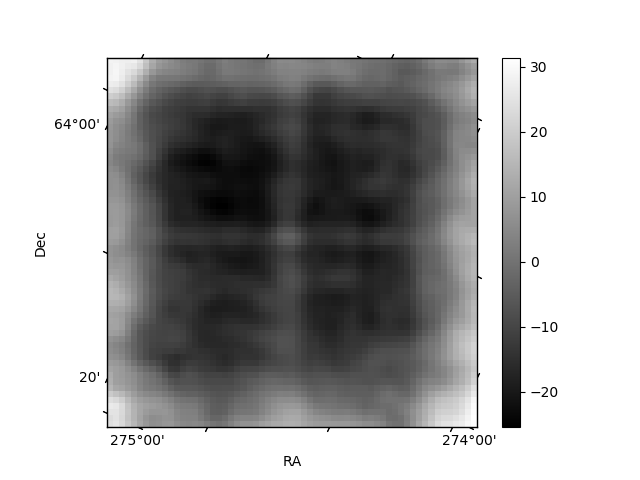
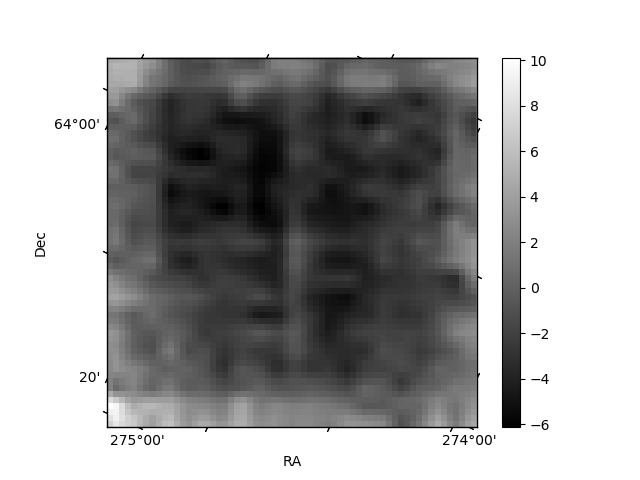
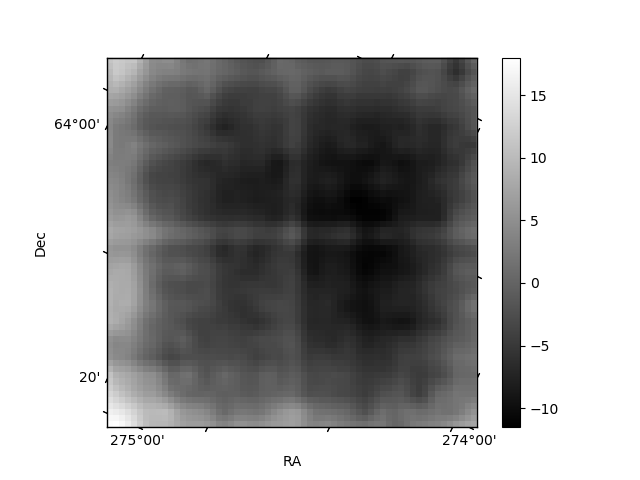
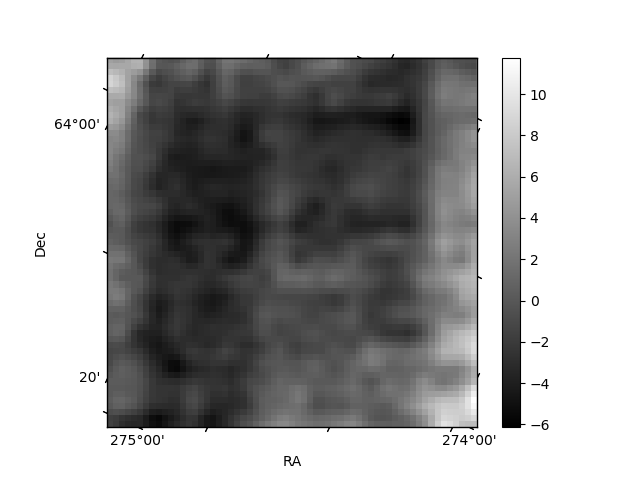
Histogram calculated using DETX and DETY for each event in the final _common_clean file
| Quadrant A | 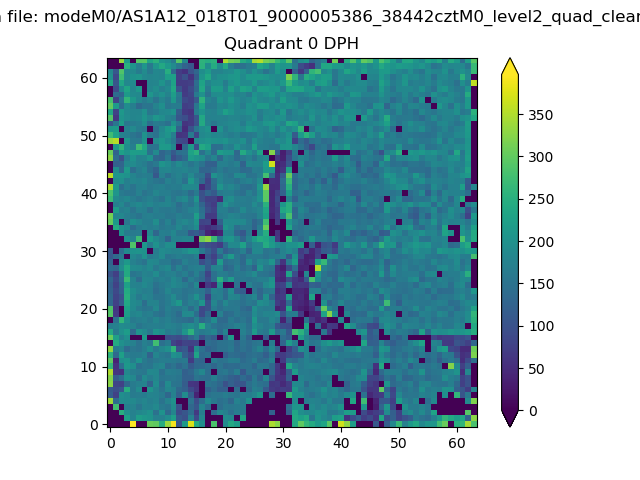 |
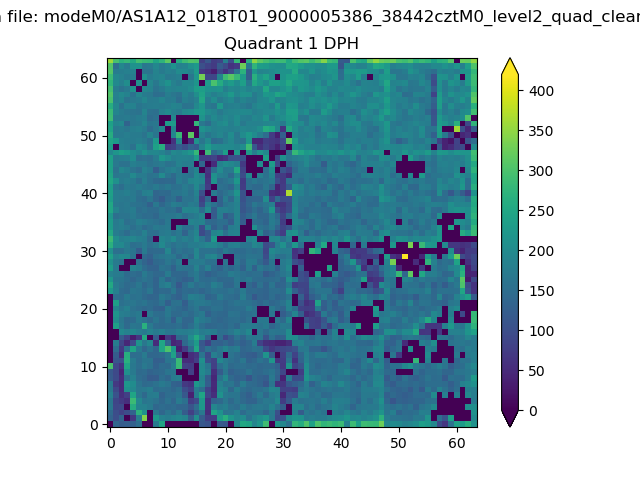 |
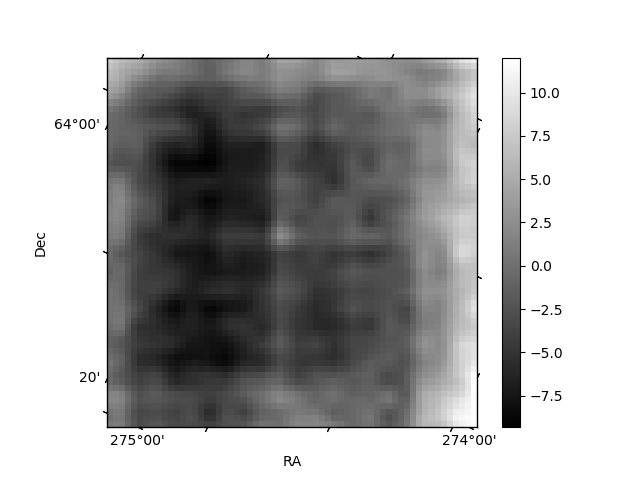
Quadrant B |
|---|---|---|---|
| Quadrant D | 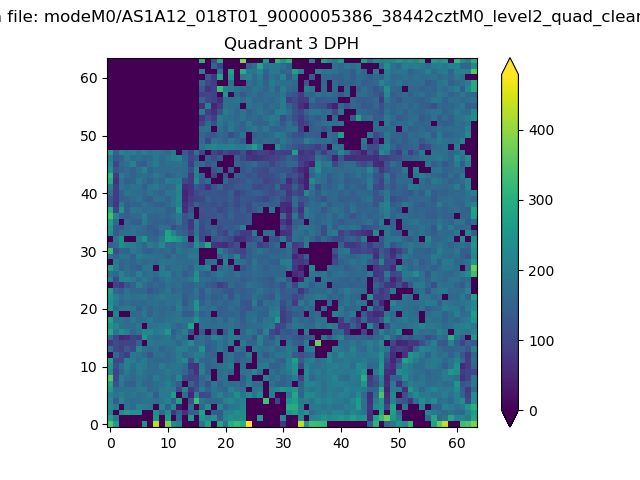 |
 |
Quadrant C |
| Plot type | Count rate plots | Images |
|---|---|---|
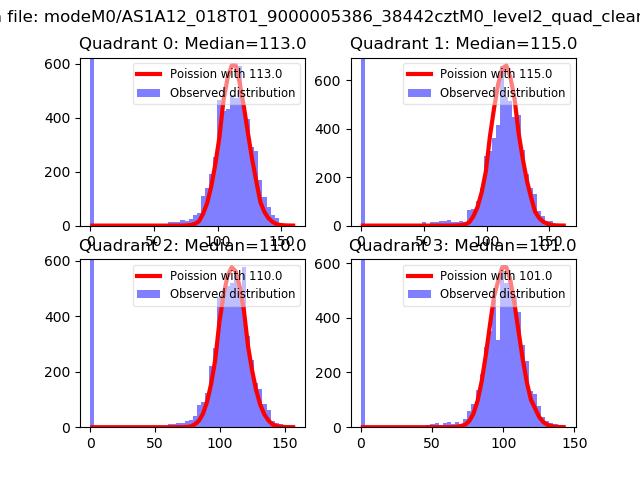
| Comparison with Poisson distribution Blue bars denote a histogram of data divided into 1 sec bins. Red curve is a Poisson curve with rate = median count rate of data. |
 |
 |
| Quadrant-wise count rates Data is divided into 100 sec bins |
 |
|
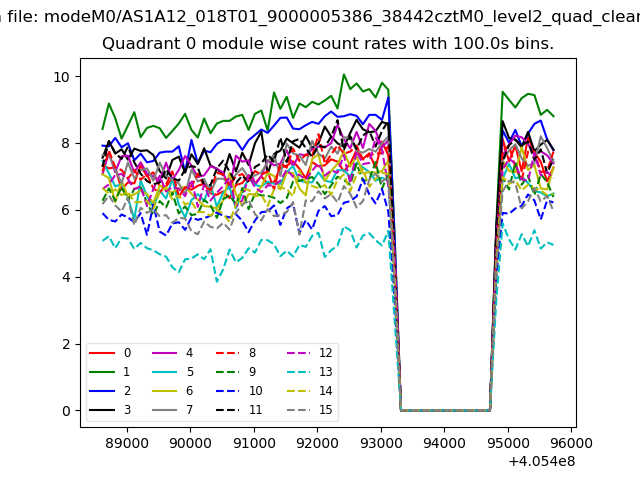
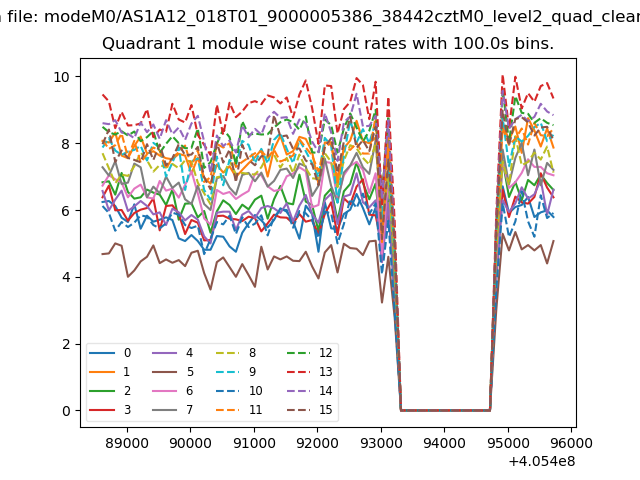
| Module-wise count rates for Quadrant A Data is divided into 100 sec bins |
 |
 |
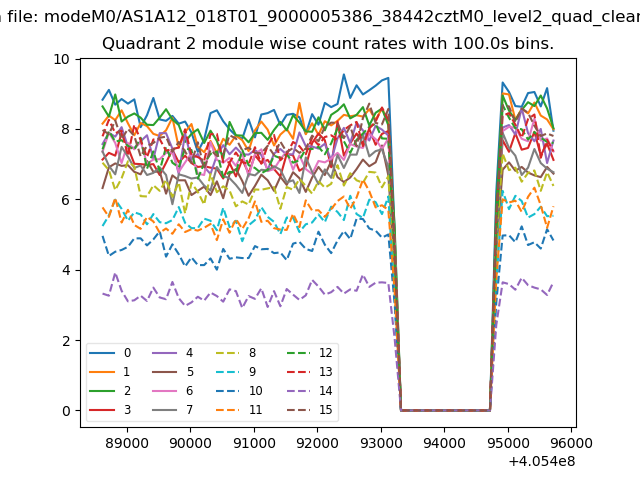
| Module-wise count rates for Quadrant B Data is divided into 100 sec bins |
 |
 |
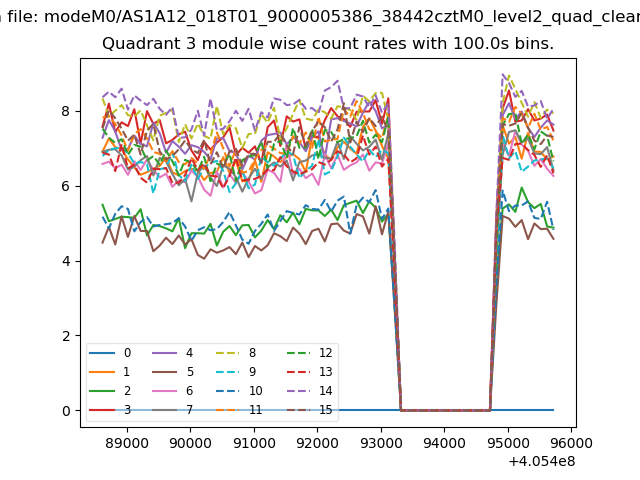
| Module-wise count rates for Quadrant C Data is divided into 100 sec bins |
 |
 |
| Module-wise count rates for Quadrant D Data is divided into 100 sec bins |
 |
 |
| Parameter | Plot |
|---|---|
| CZT HV Monitor | 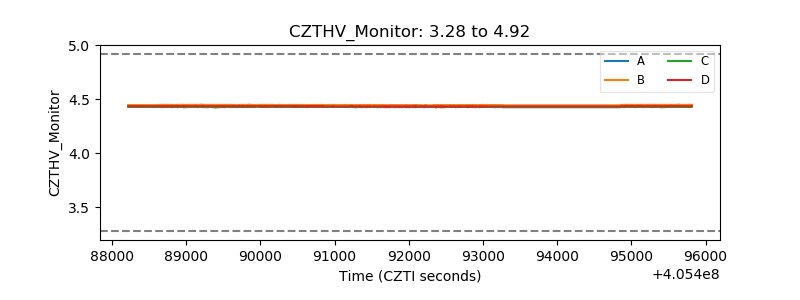 |
| D_VDD | 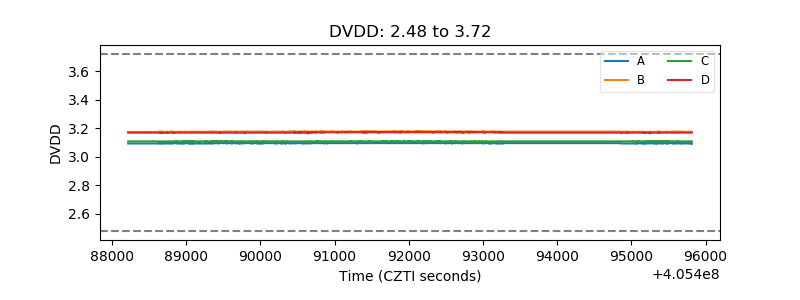 |
| Temperature 1 | 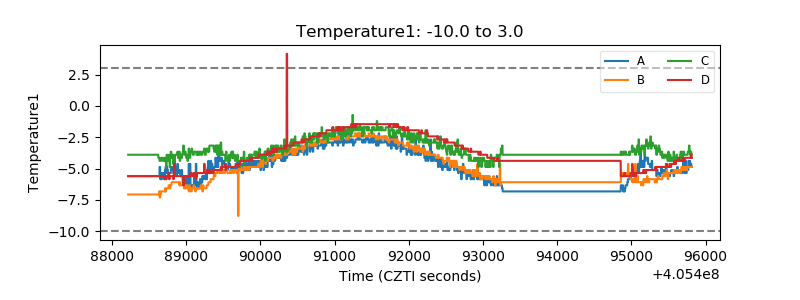 |
| Veto HV Monitor | 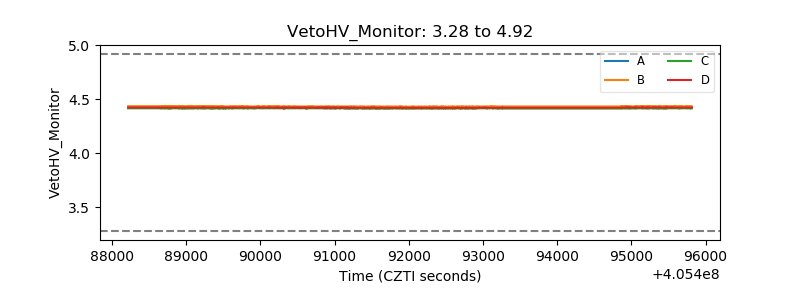 |
| Veto LLD | 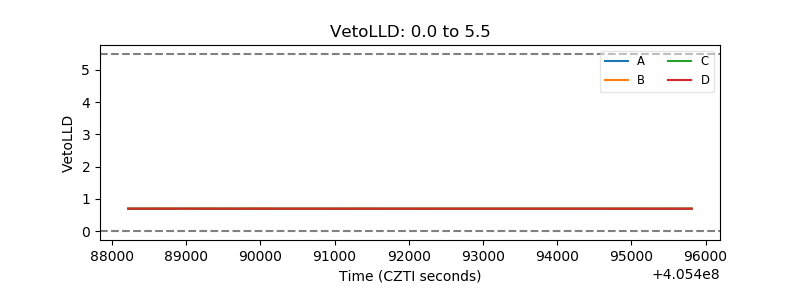 |
| Alpha Counter | 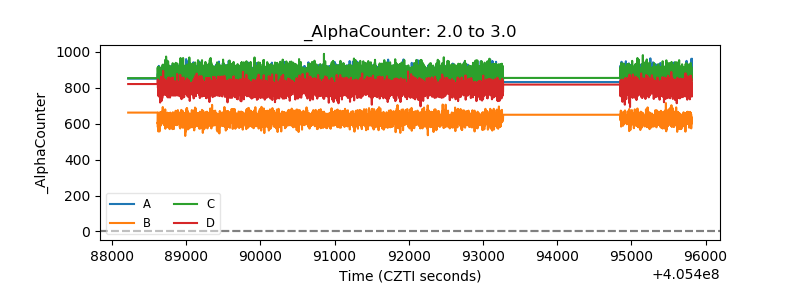 |
| _CPM_Rate | 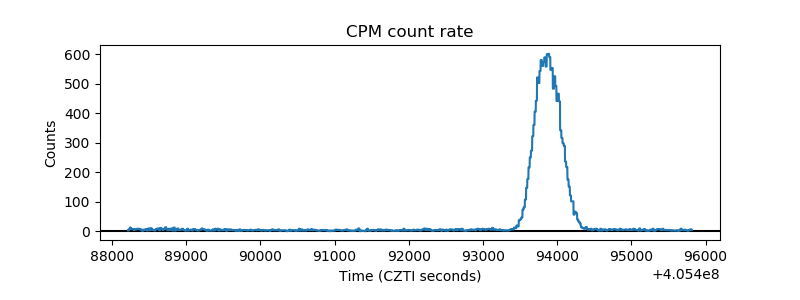 |
| CZT Counter | 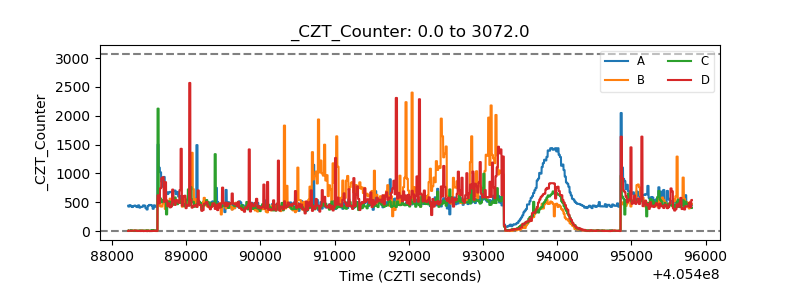 |
| +2.5 Volts monitor |  |
| +5 Volts monitor | 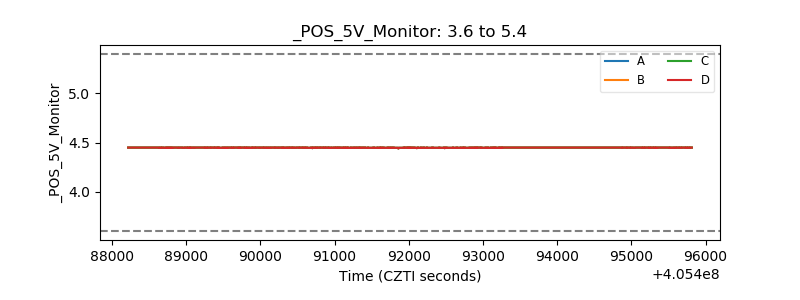 |
| _ROLL_ROT | 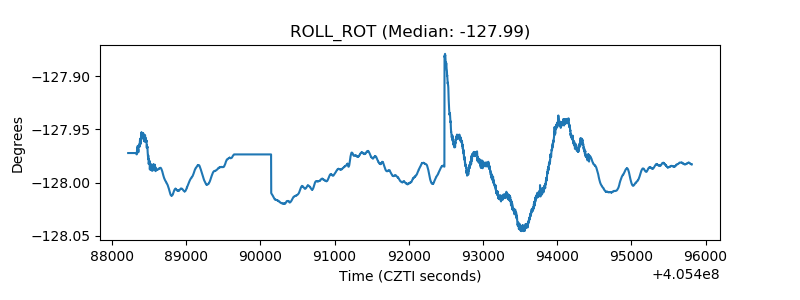 |
| _Roll_DEC | 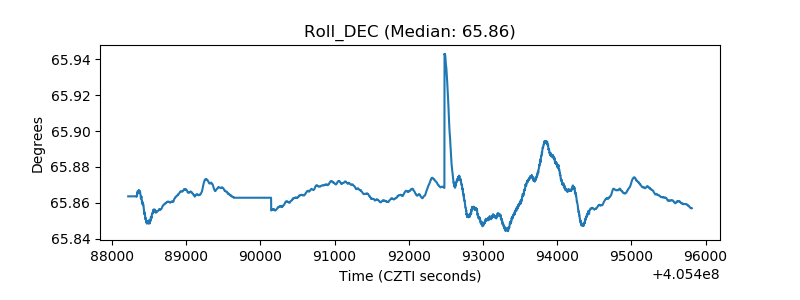 |
| _Roll_RA | 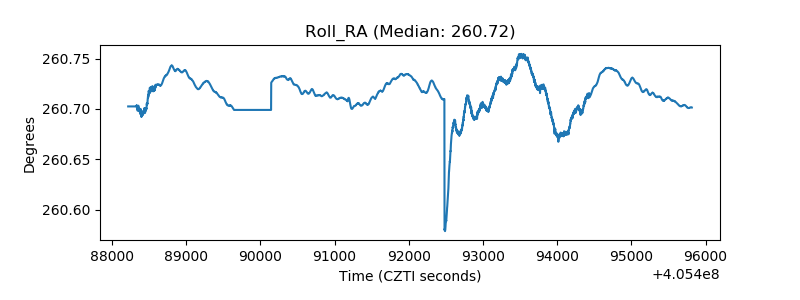 |
| Veto Counter | 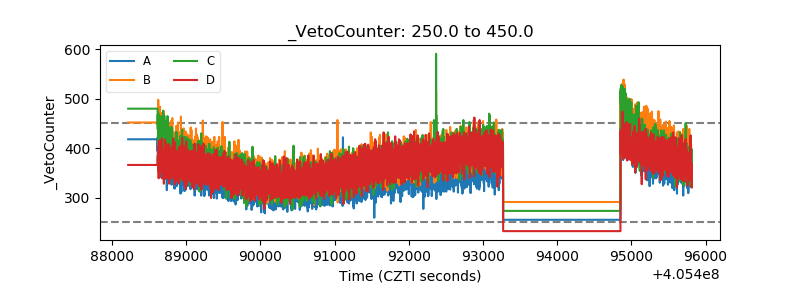 |