| Param | Original file | Final file |
|---|---|---|
| Filename | modeM0/AS1A12_018T01_9000005386_38445cztM0_level2.fits | modeM0/AS1A12_018T01_9000005386_38445cztM0_level2_quad_clean.evt |
| Size (bytes) | 318,680,640 | 91,097,280 |
| Size | 303.9 MB | 86.9 MB |
| Events in quadrant A | 2,752,699 | 630,788 |
| Events in quadrant B | 2,898,695 | 635,691 |
| Events in quadrant C | 2,513,194 | 596,324 |
| Events in quadrant D | 3,235,295 | 539,091 |
| Mode SS | |||
|---|---|---|---|
| Quadrant | BADHDUFLAG | Total packets | Discarded packets |
| A | 0 | 104 | 0 |
| B | 0 | 104 | 0 |
| C | 0 | 104 | 0 |
| D | 0 | 104 | 0 |
| Mode M9 | |||
|---|---|---|---|
| Quadrant | BADHDUFLAG | Total packets | Discarded packets |
| A | 0 | 18 | 0 |
| B | 0 | 18 | 0 |
| C | 0 | 18 | 0 |
| D | 0 | 18 | 0 |
| Mode M0 | |||
|---|---|---|---|
| Quadrant | BADHDUFLAG | Total packets | Discarded packets |
| A | 0 | 11216 | 2 |
| B | 0 | 11799 | 1 |
| C | 0 | 10531 | 1 |
| D | 0 | 12855 | 1 |
| Quadrant | Total seconds | Saturated seconds | Saturation percentage |
|---|---|---|---|
| A | 5090 | 19 | 0.373281% |
| B | 5090 | 75 | 1.473477% |
| C | 5090 | 7 | 0.137525% |
| D | 5090 | 210 | 4.125737% |
Noise dominated data is calculated using 1-second bins in cleaned event files. If a bin has >2000 counts, and if more than 50% of those come from <1% of pixels, then it is considered to be noise-dominated and hence unusable.
| Quadrant | # 1 sec bins | Bins with >0 counts | Bins with >2000 counts | High rate bins dominated by noise | Noise dominated (total time) | Noise dominated (detector-on time) | Marked lightcurve |
|---|---|---|---|---|---|---|---|
| A | 6943 | 5091 | 5 | 5 | 0.07% | 0.10% | 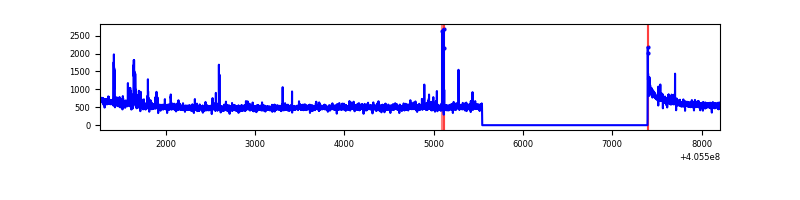 |
| B | 6943 | 5091 | 50 | 50 | 0.72% | 0.98% | 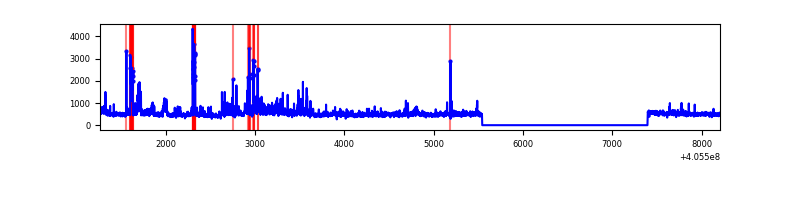 |
| C | 6943 | 5091 | 4 | 4 | 0.06% | 0.08% | 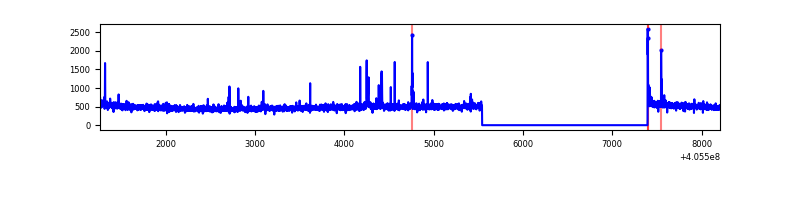 |
| D | 6943 | 5091 | 186 | 186 | 2.68% | 3.65% | 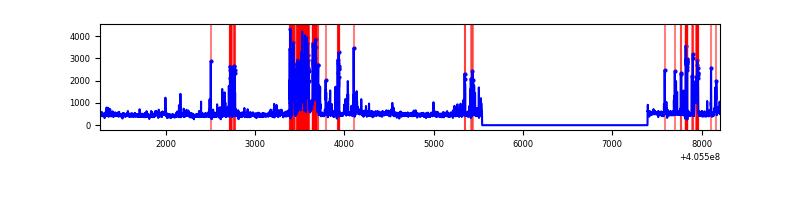 |
Top three noisy pixels from each quadrant. If the there are fewer than three noisy pixels in the level2.evt file, extra rows are filled as -1
| Pixel properties | Quadrant properties | ||||||
|---|---|---|---|---|---|---|---|
| Quadrant | DetID | PixID | Counts | Sigma | Mean | Median | Sigma |
| A | 10 | 83 | 341684 | 2860.18 | 592 | 580 | 119.3 |
| A | 9 | 143 | 44340 | 366.93 | 592 | 580 | 119.3 |
| A | 13 | 248 | 43643 | 361.09 | 592 | 580 | 119.3 |
| B | 0 | 183 | 245171 | 2242.33 | 580 | 567 | 109.1 |
| B | 8 | 3 | 135541 | 1237.33 | 580 | 567 | 109.1 |
| B | 4 | 232 | 95962 | 874.5 | 580 | 567 | 109.1 |
| C | 15 | 214 | 216158 | 1650.34 | 564 | 568 | 130.6 |
| C | 14 | 254 | 72354 | 549.52 | 564 | 568 | 130.6 |
| C | 0 | 10 | 16227 | 119.87 | 564 | 568 | 130.6 |
| D | 12 | 227 | 466780 | 3454.9 | 561 | 545 | 134.9 |
| D | 7 | 38 | 189745 | 1402.01 | 561 | 545 | 134.9 |
| D | 13 | 249 | 89731 | 660.89 | 561 | 545 | 134.9 |
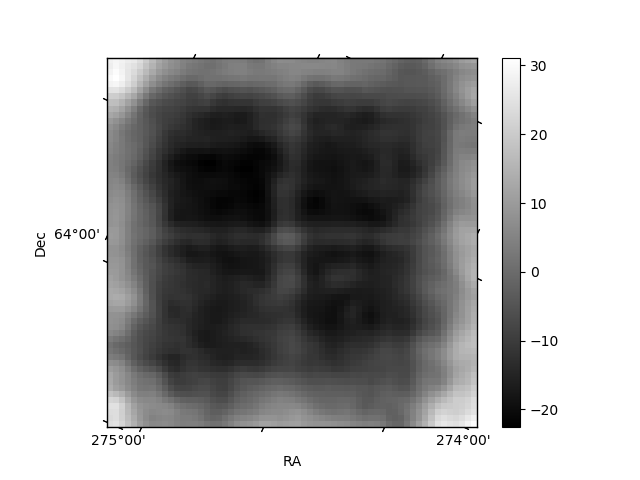
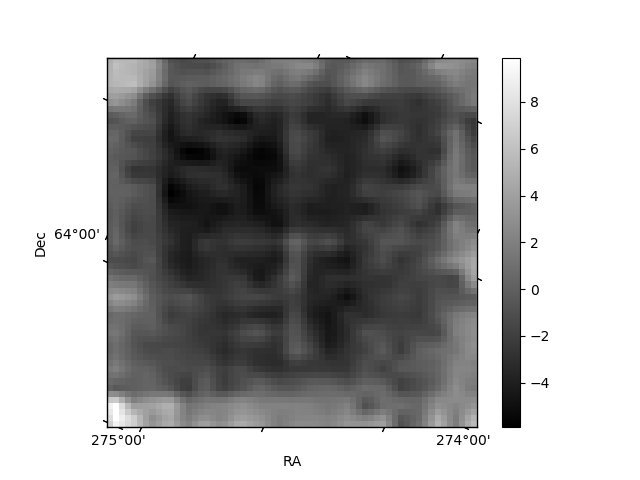
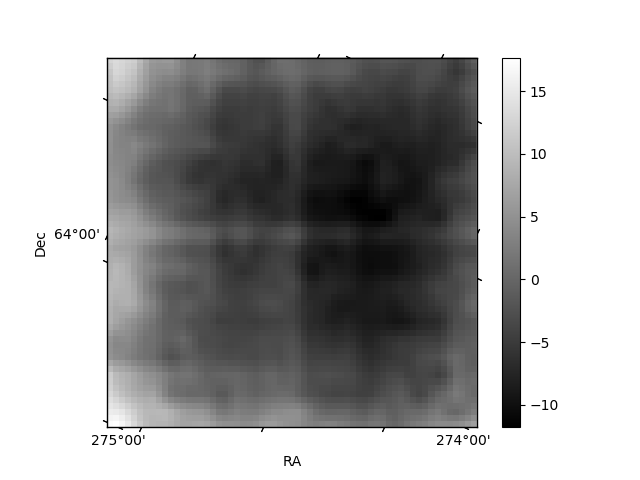
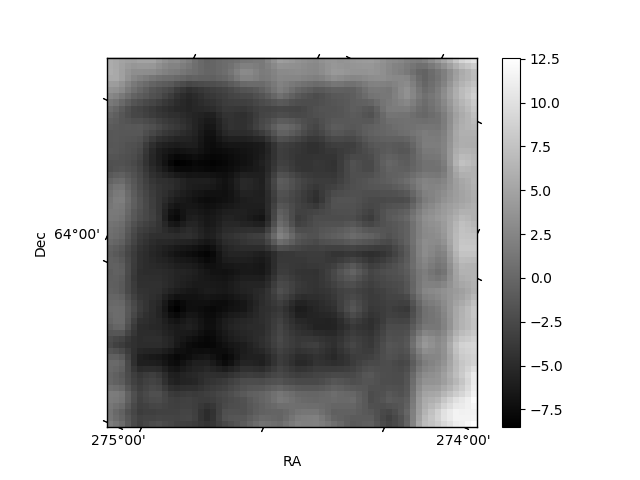
Histogram calculated using DETX and DETY for each event in the final _common_clean file
| Quadrant A | 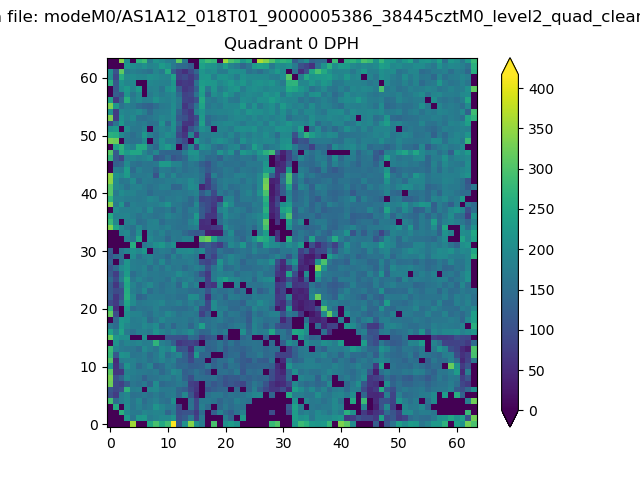 |
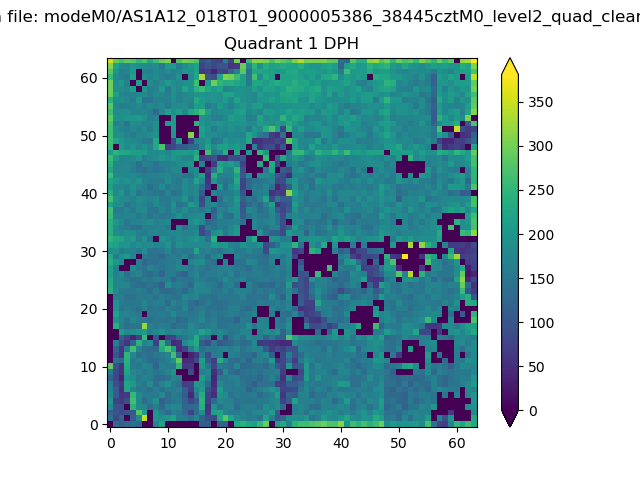 |
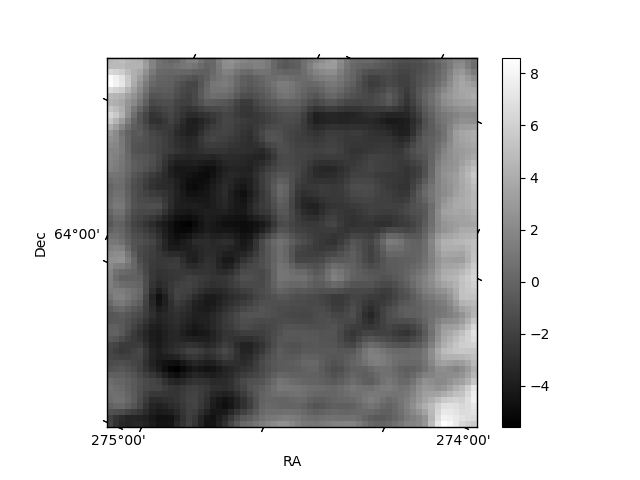
Quadrant B |
|---|---|---|---|
| Quadrant D | 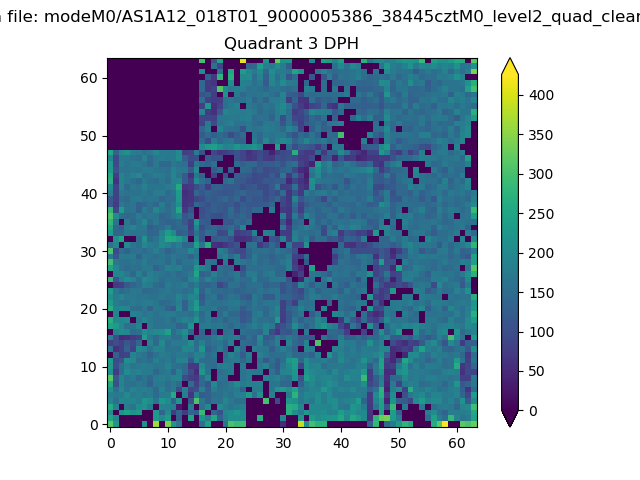 |
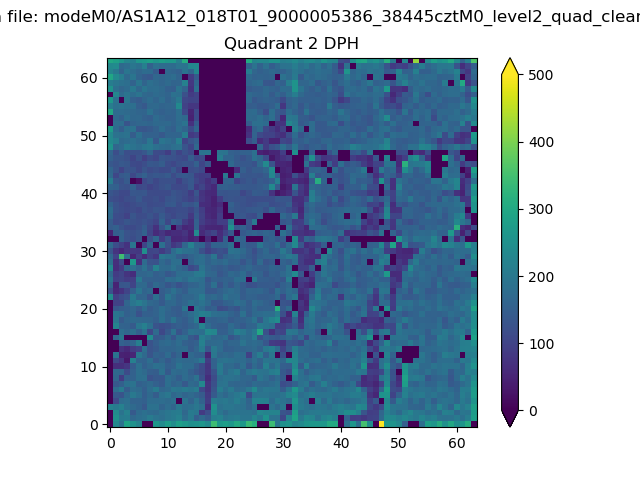 |
Quadrant C |
| Plot type | Count rate plots | Images |
|---|---|---|
| Comparison with Poisson distribution Blue bars denote a histogram of data divided into 1 sec bins. Red curve is a Poisson curve with rate = median count rate of data. |
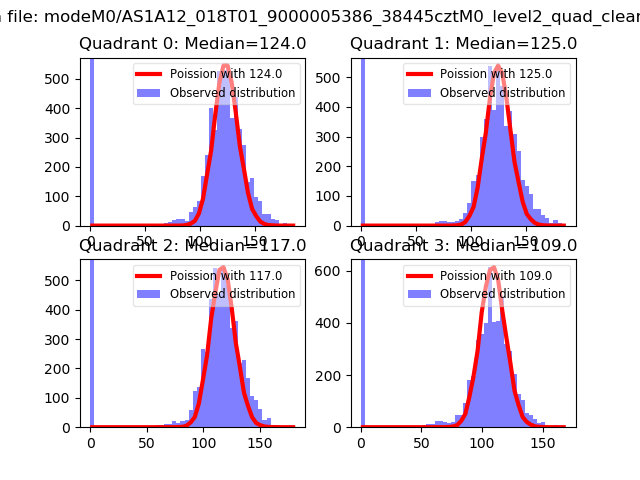 |
 |
| Quadrant-wise count rates Data is divided into 100 sec bins |
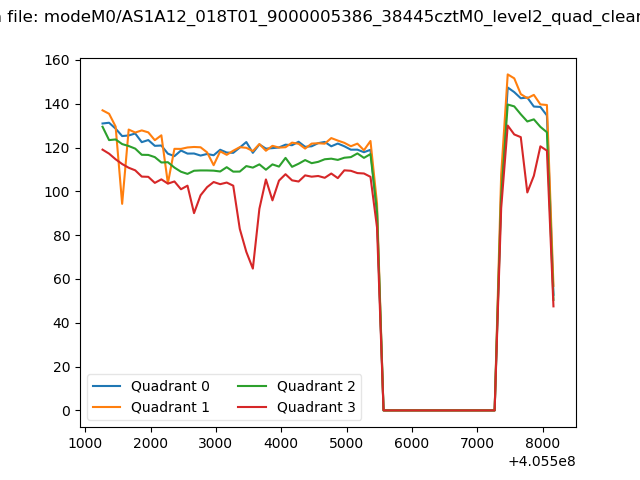 |
|
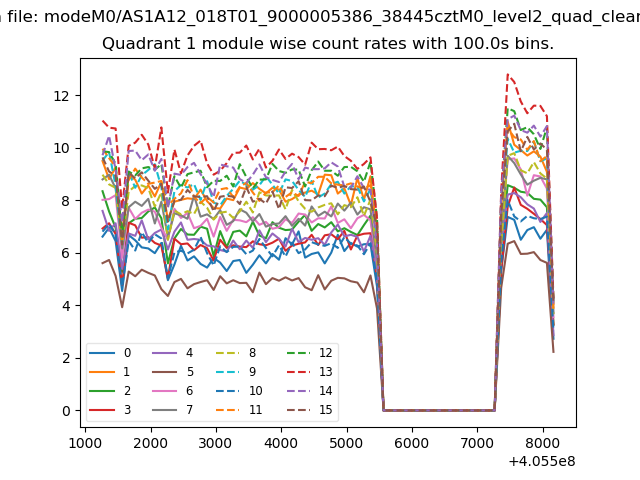
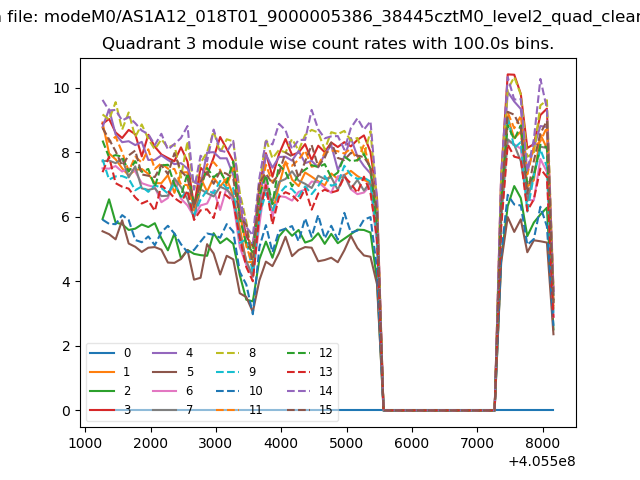
| Module-wise count rates for Quadrant A Data is divided into 100 sec bins |
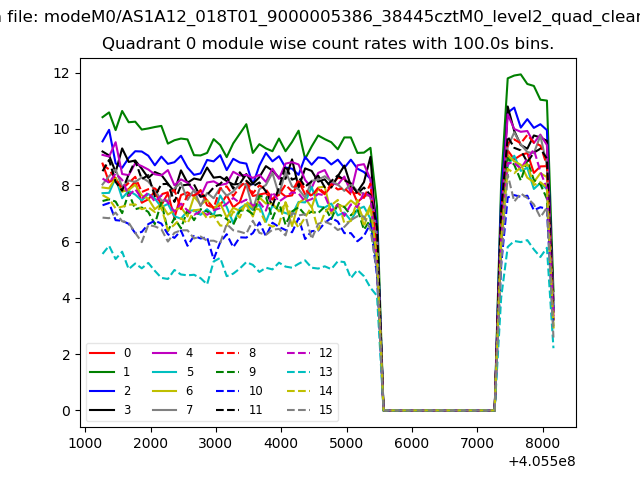 |
 |
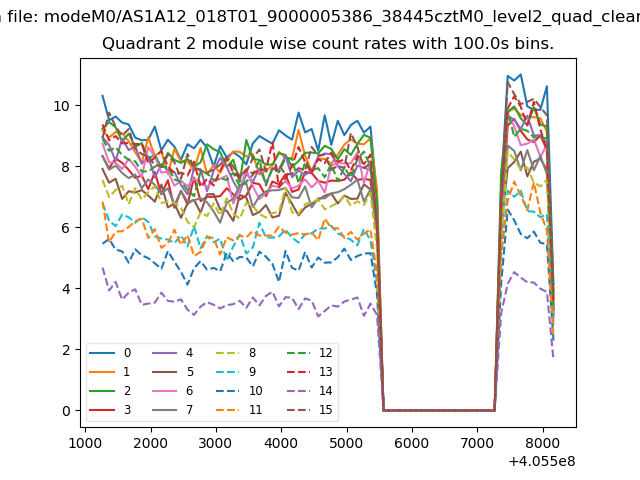
| Module-wise count rates for Quadrant B Data is divided into 100 sec bins |
 |
 |
| Module-wise count rates for Quadrant C Data is divided into 100 sec bins |
 |
 |
| Module-wise count rates for Quadrant D Data is divided into 100 sec bins |
 |
 |
| Parameter | Plot |
|---|---|
| CZT HV Monitor | 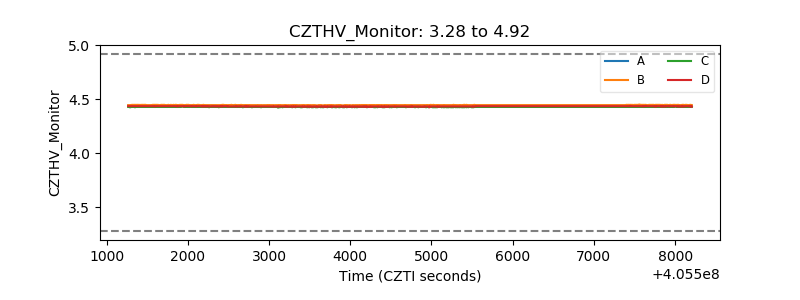 |
| D_VDD | 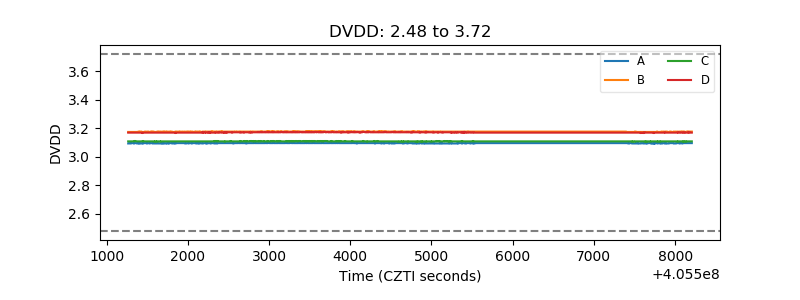 |
| Temperature 1 | 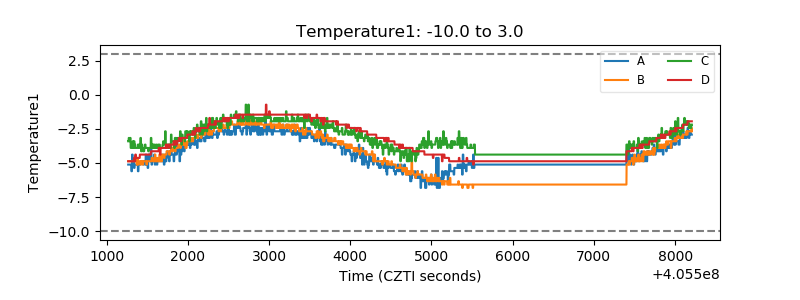 |
| Veto HV Monitor | 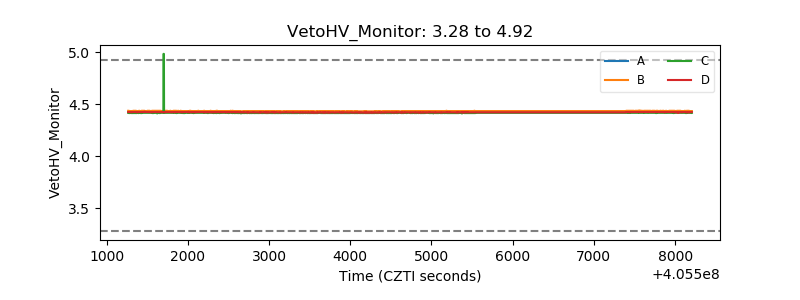 |
| Veto LLD | 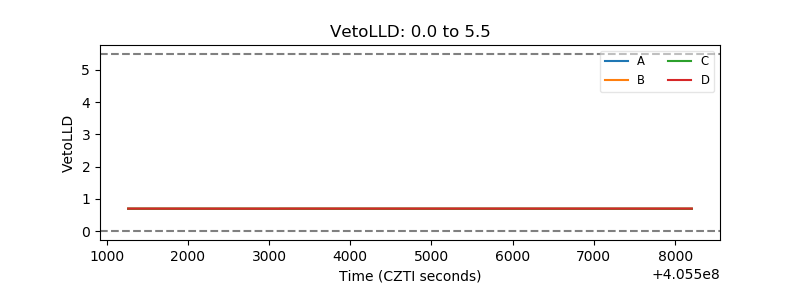 |
| Alpha Counter | 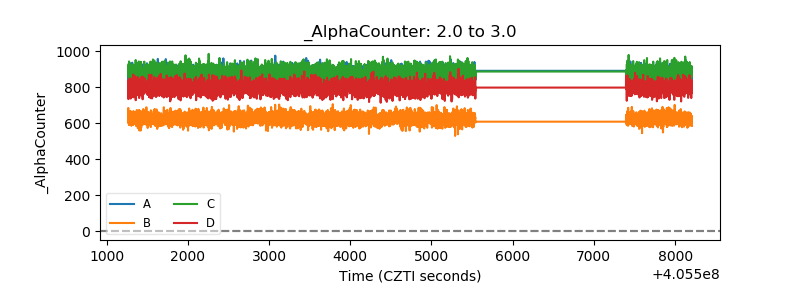 |
| _CPM_Rate | 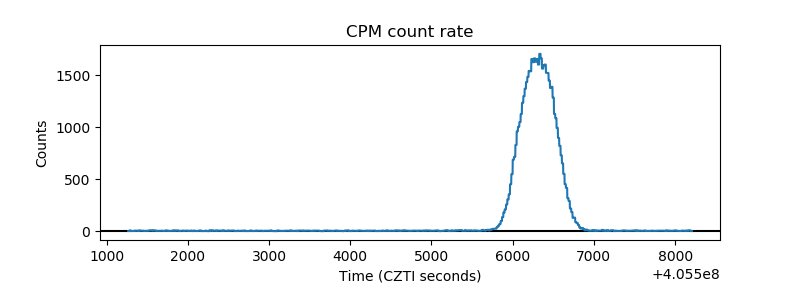 |
| CZT Counter | 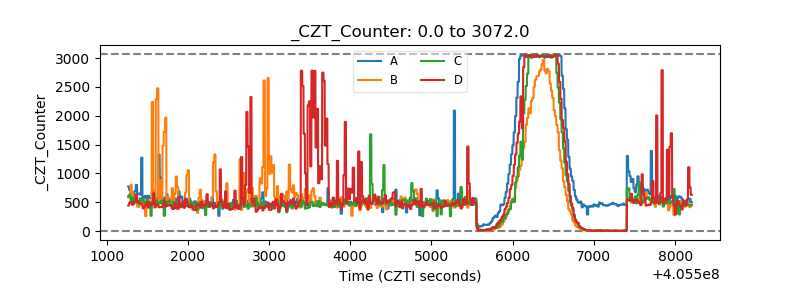 |
| +2.5 Volts monitor | 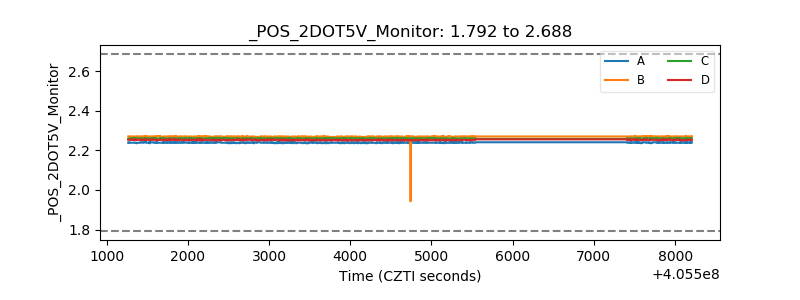 |
| +5 Volts monitor | 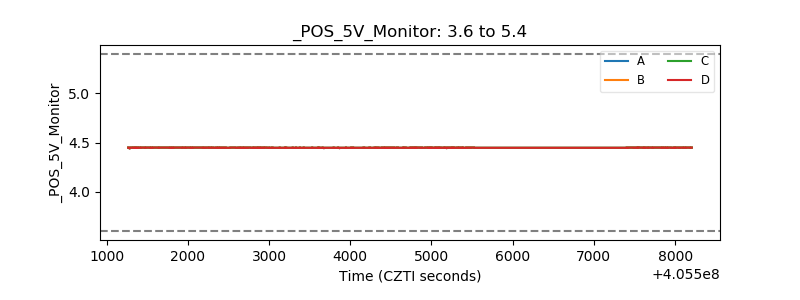 |
| _ROLL_ROT | 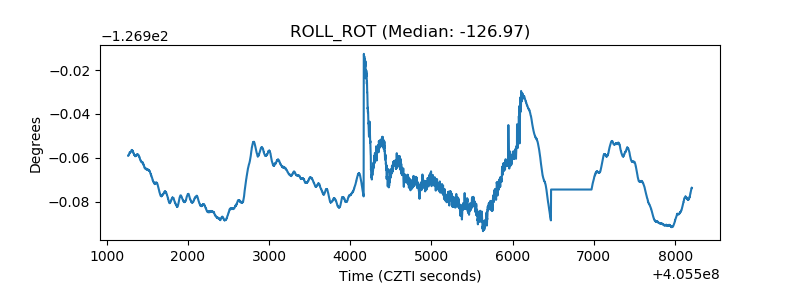 |
| _Roll_DEC | 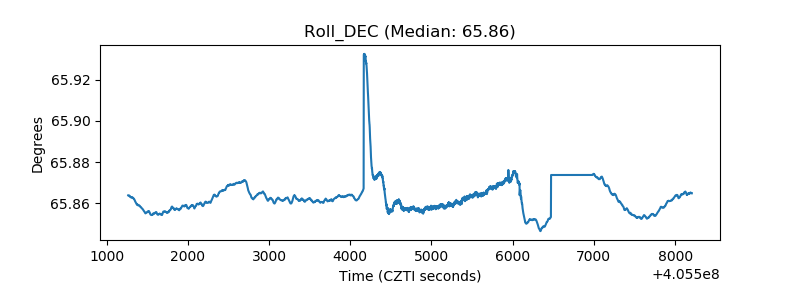 |
| _Roll_RA | 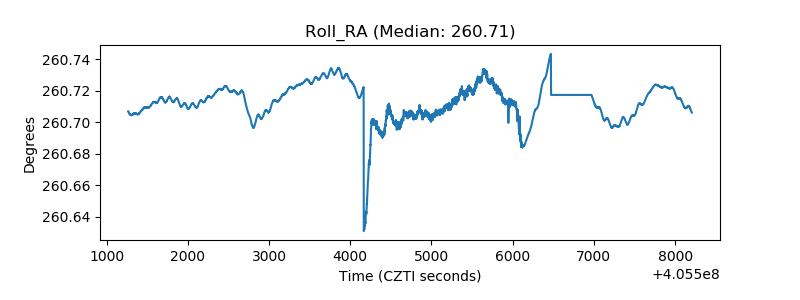 |
| Veto Counter | 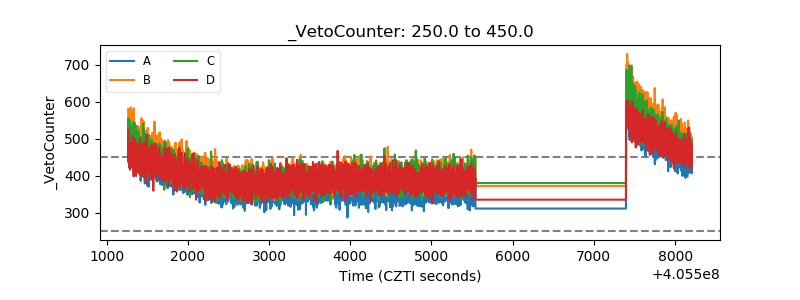 |