| Param | Original file | Final file |
|---|---|---|
| Filename | modeM0/AS1A12_018T01_9000005386_38446cztM0_level2.fits | modeM0/AS1A12_018T01_9000005386_38446cztM0_level2_quad_clean.evt |
| Size (bytes) | 345,847,680 | 96,802,560 |
| Size | 329.8 MB | 92.3 MB |
| Events in quadrant A | 3,001,503 | 682,001 |
| Events in quadrant B | 3,288,218 | 673,989 |
| Events in quadrant C | 2,576,343 | 637,470 |
| Events in quadrant D | 3,534,320 | 576,448 |
| Mode SS | |||
|---|---|---|---|
| Quadrant | BADHDUFLAG | Total packets | Discarded packets |
| A | 0 | 106 | 0 |
| B | 0 | 106 | 0 |
| C | 0 | 106 | 0 |
| D | 0 | 106 | 0 |
| Mode M9 | |||
|---|---|---|---|
| Quadrant | BADHDUFLAG | Total packets | Discarded packets |
| A | 0 | 23 | 0 |
| B | 0 | 23 | 0 |
| C | 0 | 23 | 0 |
| D | 0 | 24 | 0 |
| Mode M0 | |||
|---|---|---|---|
| Quadrant | BADHDUFLAG | Total packets | Discarded packets |
| A | 0 | 12050 | 3 |
| B | 0 | 12907 | 2 |
| C | 0 | 10619 | 2 |
| D | 0 | 13732 | 2 |
| Quadrant | Total seconds | Saturated seconds | Saturation percentage |
|---|---|---|---|
| A | 5158 | 16 | 0.310198% |
| B | 5158 | 172 | 3.334626% |
| C | 5158 | 7 | 0.135712% |
| D | 5158 | 244 | 4.730516% |
Noise dominated data is calculated using 1-second bins in cleaned event files. If a bin has >2000 counts, and if more than 50% of those come from <1% of pixels, then it is considered to be noise-dominated and hence unusable.
| Quadrant | # 1 sec bins | Bins with >0 counts | Bins with >2000 counts | High rate bins dominated by noise | Noise dominated (total time) | Noise dominated (detector-on time) | Marked lightcurve |
|---|---|---|---|---|---|---|---|
| A | 7131 | 5159 | 6 | 6 | 0.08% | 0.12% | 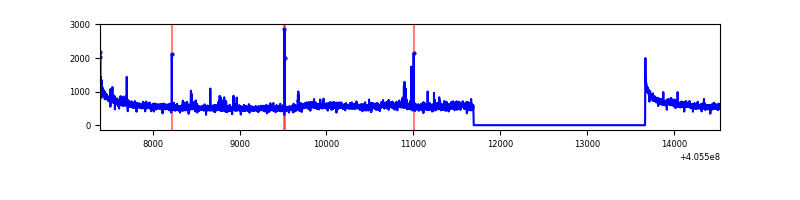 |
| B | 7131 | 5159 | 155 | 155 | 2.17% | 3.00% | 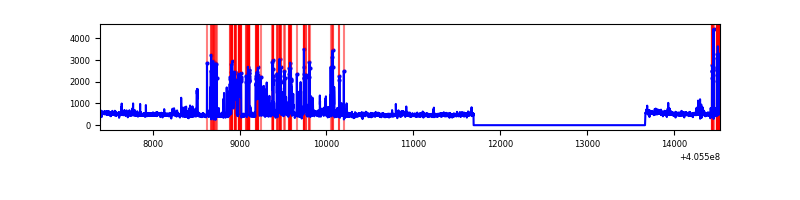 |
| C | 7131 | 5159 | 6 | 6 | 0.08% | 0.12% | 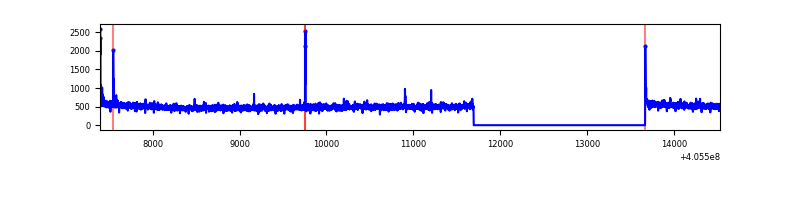 |
| D | 7131 | 5159 | 203 | 203 | 2.85% | 3.93% | 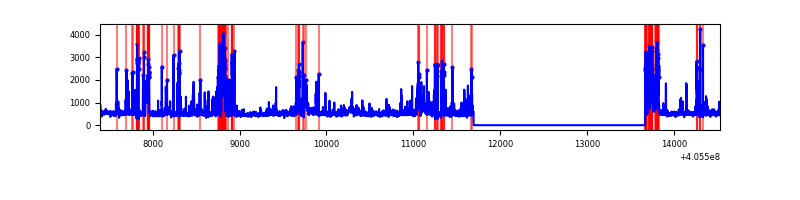 |
Top three noisy pixels from each quadrant. If the there are fewer than three noisy pixels in the level2.evt file, extra rows are filled as -1
| Pixel properties | Quadrant properties | ||||||
|---|---|---|---|---|---|---|---|
| Quadrant | DetID | PixID | Counts | Sigma | Mean | Median | Sigma |
| A | 10 | 83 | 392049 | 3159.8 | 619 | 608 | 123.9 |
| A | 15 | 223 | 140574 | 1129.84 | 619 | 608 | 123.9 |
| A | 13 | 248 | 39601 | 314.76 | 619 | 608 | 123.9 |
| B | 0 | 183 | 576017 | 5098.74 | 602 | 588 | 112.9 |
| B | 4 | 232 | 227425 | 2009.95 | 602 | 588 | 112.9 |
| B | 0 | 155 | 29177 | 253.32 | 602 | 588 | 112.9 |
| C | 15 | 214 | 219768 | 1624.14 | 589 | 593 | 134.9 |
| C | 0 | 10 | 25214 | 182.45 | 589 | 593 | 134.9 |
| C | 14 | 254 | 16342 | 116.7 | 589 | 593 | 134.9 |
| D | 2 | 249 | 225218 | 1610.91 | 587 | 572 | 139.5 |
| D | 7 | 38 | 183013 | 1308.27 | 587 | 572 | 139.5 |
| D | 12 | 227 | 180006 | 1286.7 | 587 | 572 | 139.5 |
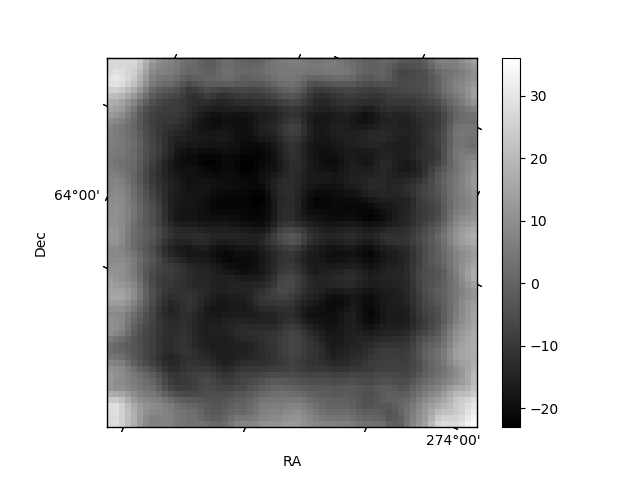
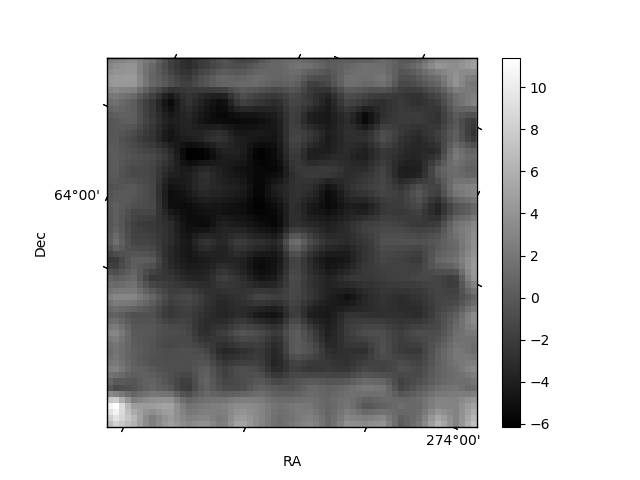
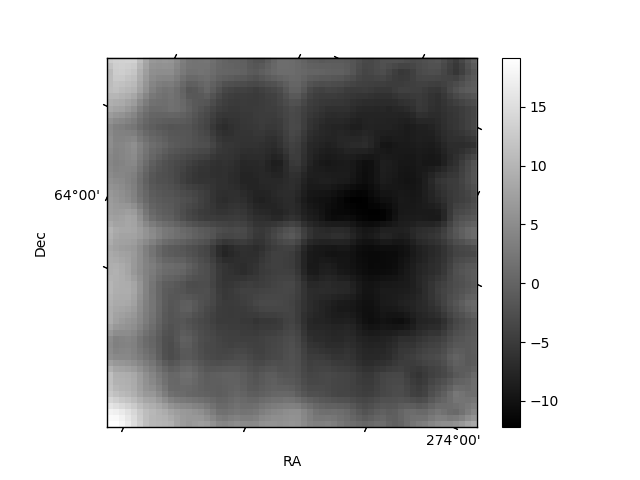
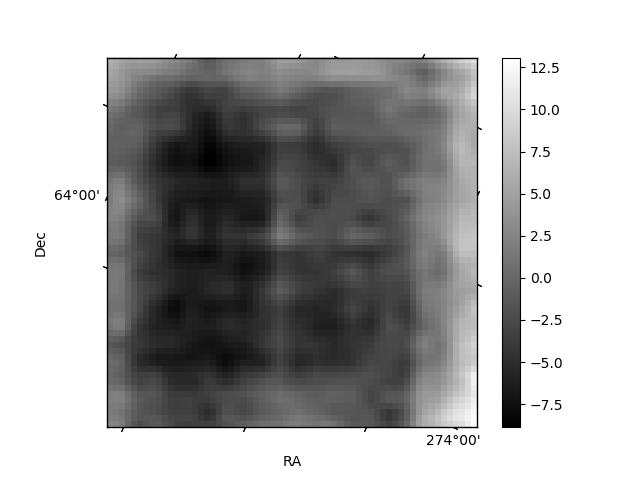
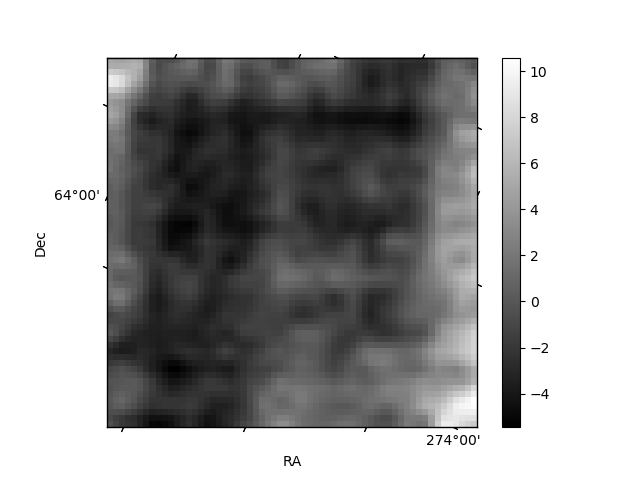
Histogram calculated using DETX and DETY for each event in the final _common_clean file
| Quadrant A | 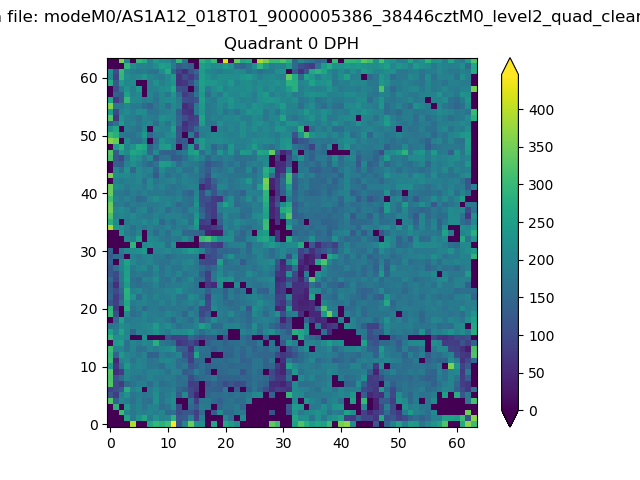 |
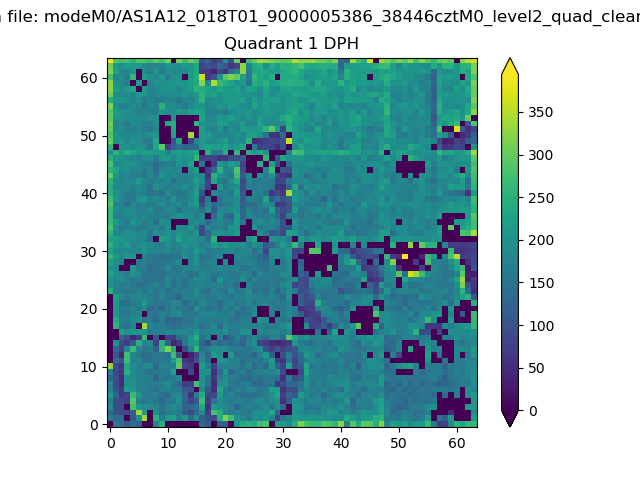 |
Quadrant B |
|---|---|---|---|
| Quadrant D | 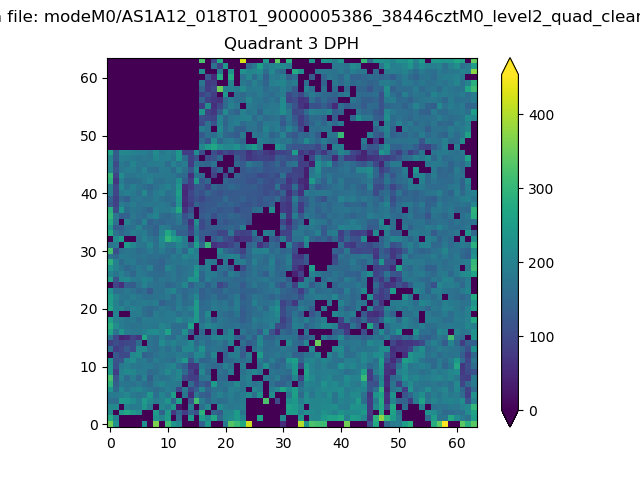 |
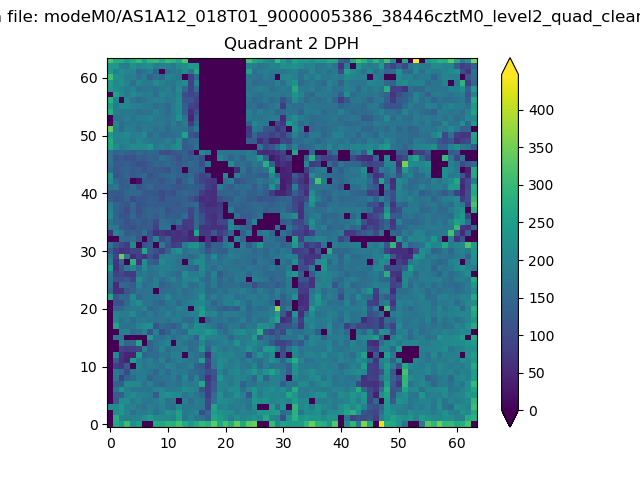 |
Quadrant C |
| Plot type | Count rate plots | Images |
|---|---|---|
| Comparison with Poisson distribution Blue bars denote a histogram of data divided into 1 sec bins. Red curve is a Poisson curve with rate = median count rate of data. |
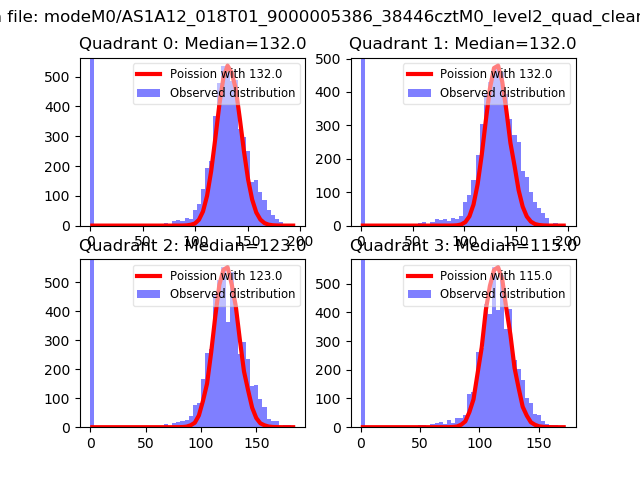 |
 |
| Quadrant-wise count rates Data is divided into 100 sec bins |
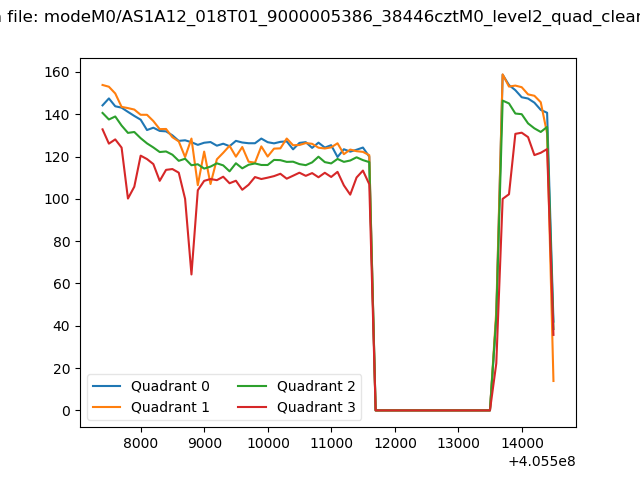 |
|
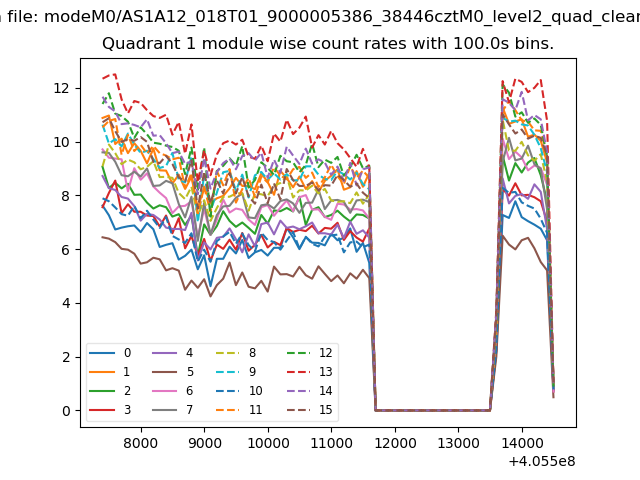
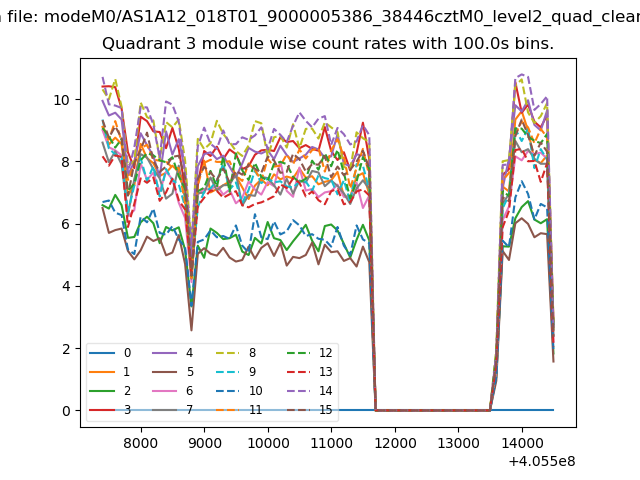
| Module-wise count rates for Quadrant A Data is divided into 100 sec bins |
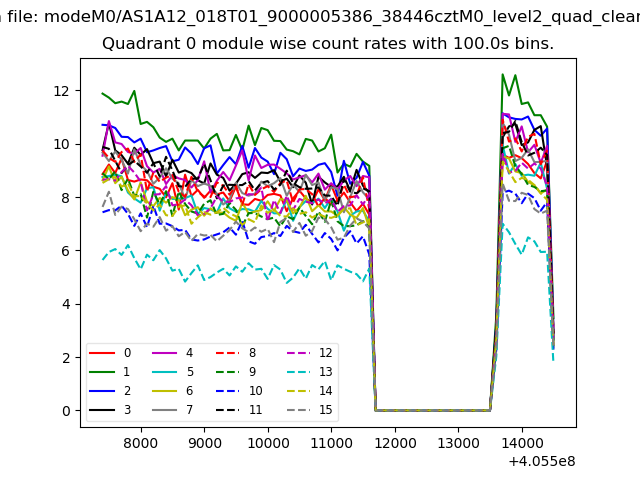 |
 |
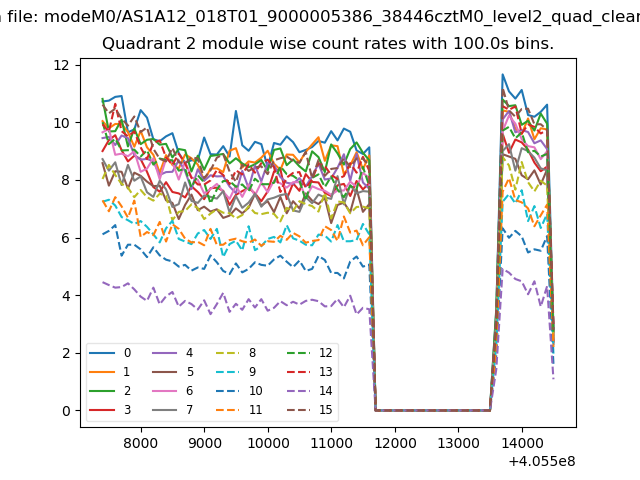
| Module-wise count rates for Quadrant B Data is divided into 100 sec bins |
 |
 |
| Module-wise count rates for Quadrant C Data is divided into 100 sec bins |
 |
 |
| Module-wise count rates for Quadrant D Data is divided into 100 sec bins |
 |
 |
| Parameter | Plot |
|---|---|
| CZT HV Monitor | 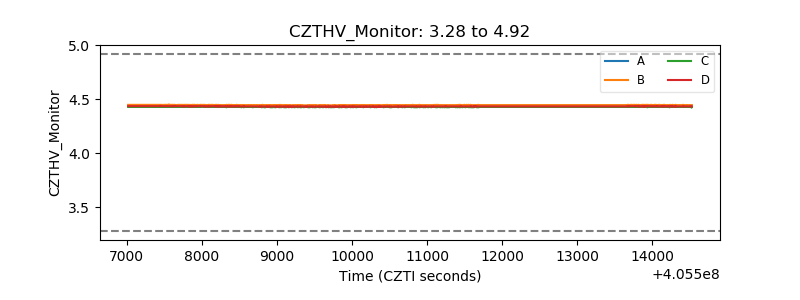 |
| D_VDD | 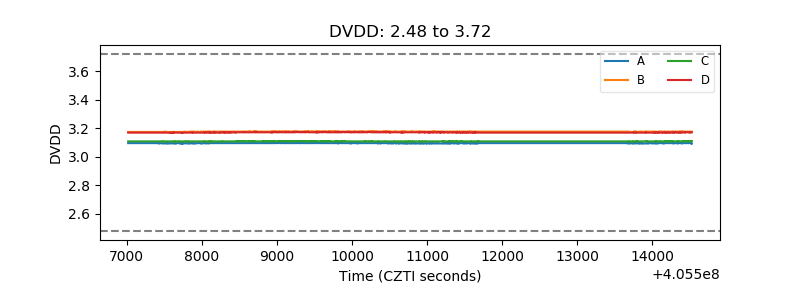 |
| Temperature 1 | 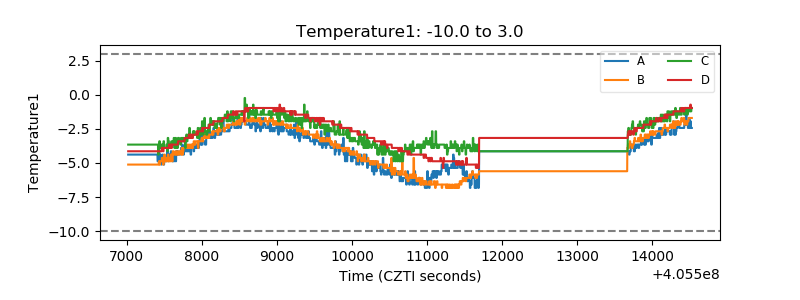 |
| Veto HV Monitor | 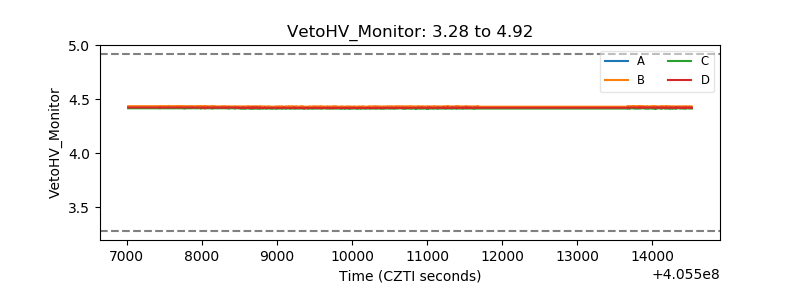 |
| Veto LLD | 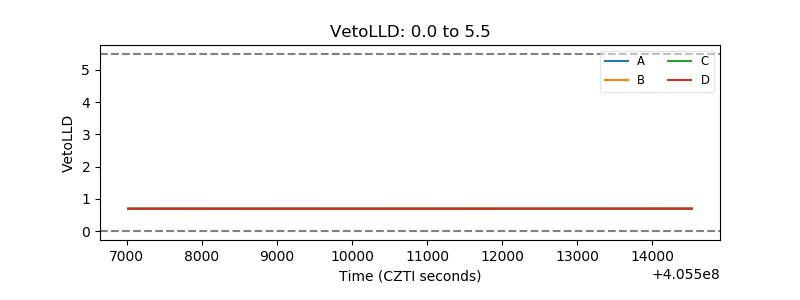 |
| Alpha Counter | 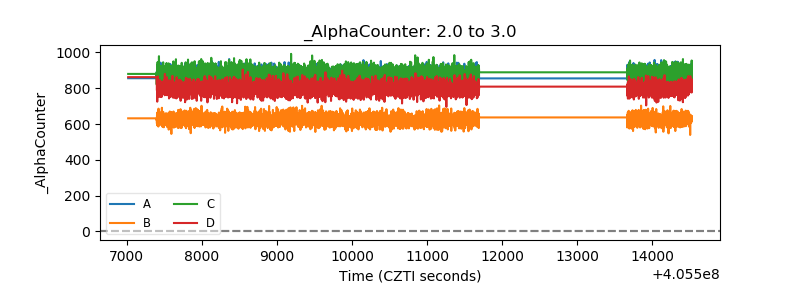 |
| _CPM_Rate | 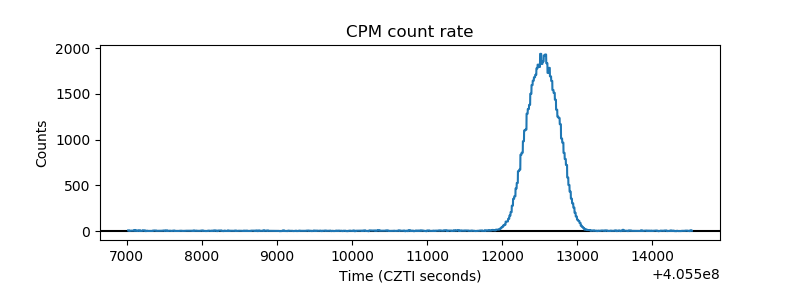 |
| CZT Counter | 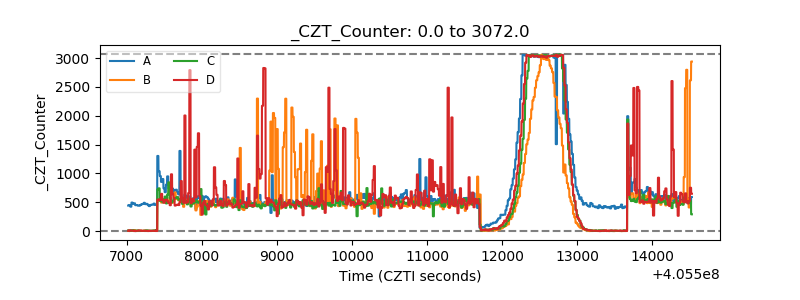 |
| +2.5 Volts monitor | 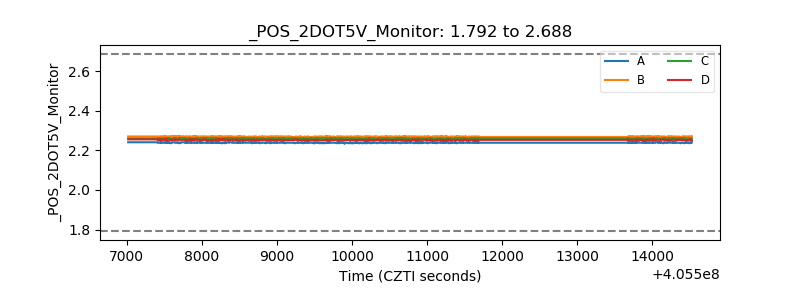 |
| +5 Volts monitor | 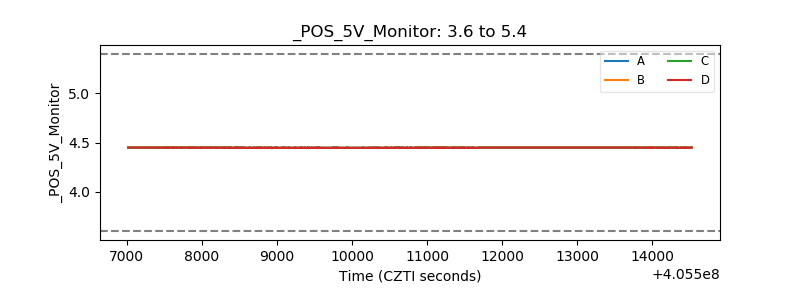 |
| _ROLL_ROT | 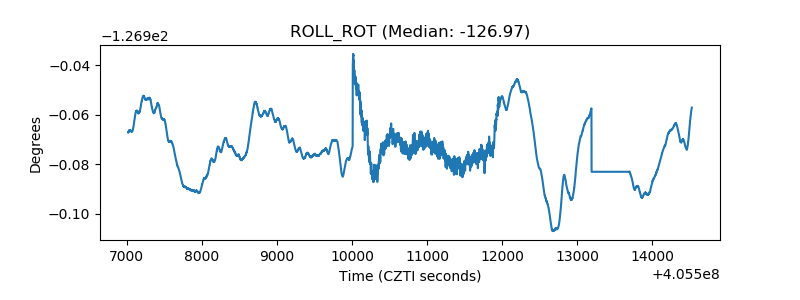 |
| _Roll_DEC | 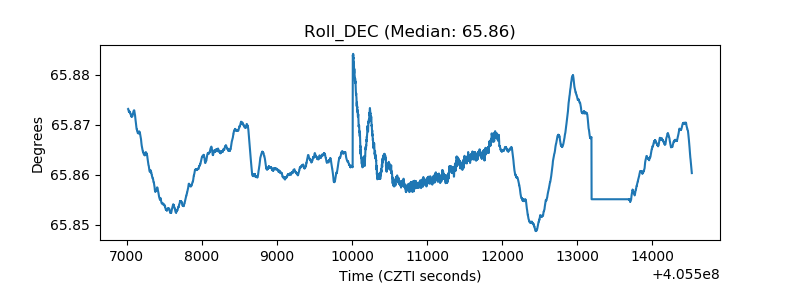 |
| _Roll_RA | 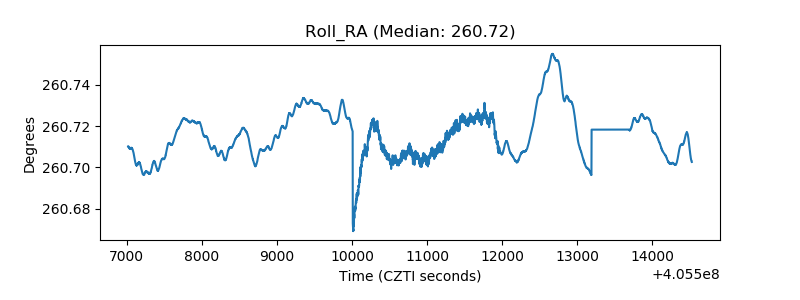 |
| Veto Counter | 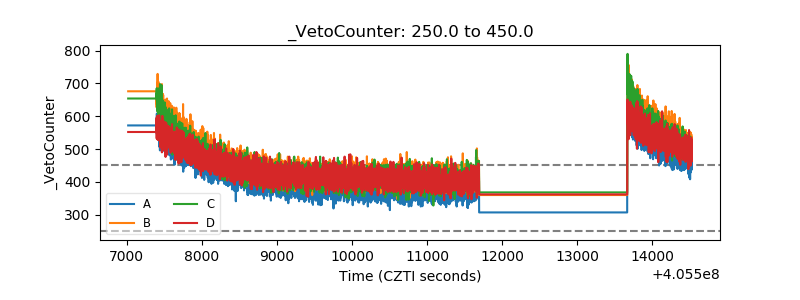 |