| Param | Original file | Final file |
|---|---|---|
| Filename | modeM0/AS1A12_018T01_9000005386_38447cztM0_level2.fits | modeM0/AS1A12_018T01_9000005386_38447cztM0_level2_quad_clean.evt |
| Size (bytes) | 330,338,880 | 95,313,600 |
| Size | 315.0 MB | 90.9 MB |
| Events in quadrant A | 2,913,248 | 672,554 |
| Events in quadrant B | 2,891,984 | 667,041 |
| Events in quadrant C | 2,511,614 | 631,654 |
| Events in quadrant D | 3,521,010 | 563,982 |
| Mode SS | |||
|---|---|---|---|
| Quadrant | BADHDUFLAG | Total packets | Discarded packets |
| A | 0 | 102 | 0 |
| B | 0 | 102 | 0 |
| C | 0 | 102 | 0 |
| D | 0 | 102 | 0 |
| Mode M9 | |||
|---|---|---|---|
| Quadrant | BADHDUFLAG | Total packets | Discarded packets |
| A | 0 | 21 | 0 |
| B | 0 | 21 | 0 |
| C | 0 | 21 | 0 |
| D | 0 | 21 | 0 |
| Mode M0 | |||
|---|---|---|---|
| Quadrant | BADHDUFLAG | Total packets | Discarded packets |
| A | 0 | 11725 | 3 |
| B | 0 | 11679 | 2 |
| C | 0 | 10242 | 2 |
| D | 0 | 13593 | 2 |
| Quadrant | Total seconds | Saturated seconds | Saturation percentage |
|---|---|---|---|
| A | 5008 | 6 | 0.119808% |
| B | 5008 | 104 | 2.076677% |
| C | 5008 | 3 | 0.059904% |
| D | 5008 | 324 | 6.469649% |
Noise dominated data is calculated using 1-second bins in cleaned event files. If a bin has >2000 counts, and if more than 50% of those come from <1% of pixels, then it is considered to be noise-dominated and hence unusable.
| Quadrant | # 1 sec bins | Bins with >0 counts | Bins with >2000 counts | High rate bins dominated by noise | Noise dominated (total time) | Noise dominated (detector-on time) | Marked lightcurve |
|---|---|---|---|---|---|---|---|
| A | 7072 | 5009 | 2 | 2 | 0.03% | 0.04% | 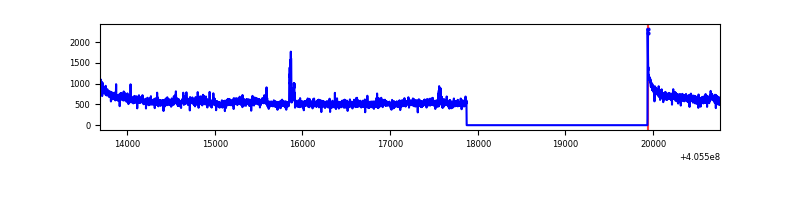 |
| B | 7072 | 5009 | 76 | 76 | 1.07% | 1.52% | 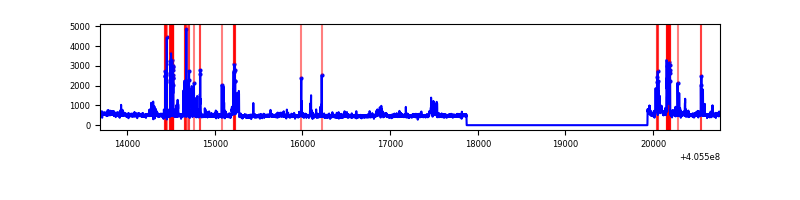 |
| C | 7072 | 5009 | 2 | 2 | 0.03% | 0.04% | 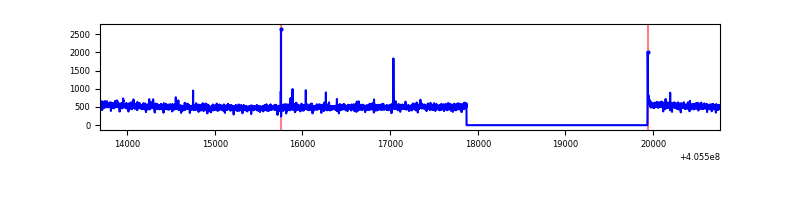 |
| D | 7072 | 5009 | 245 | 245 | 3.46% | 4.89% | 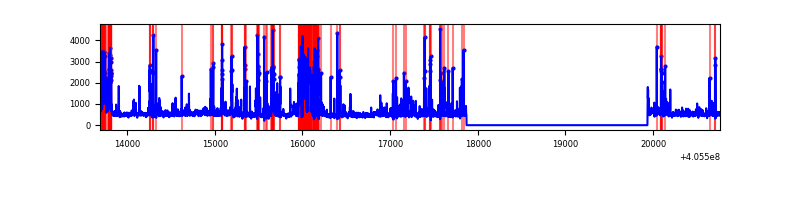 |
Top three noisy pixels from each quadrant. If the there are fewer than three noisy pixels in the level2.evt file, extra rows are filled as -1
| Pixel properties | Quadrant properties | ||||||
|---|---|---|---|---|---|---|---|
| Quadrant | DetID | PixID | Counts | Sigma | Mean | Median | Sigma |
| A | 10 | 83 | 377650 | 3124.88 | 604 | 593 | 120.7 |
| A | 15 | 223 | 169028 | 1395.92 | 604 | 593 | 120.7 |
| A | 13 | 6 | 17223 | 137.82 | 604 | 593 | 120.7 |
| B | 4 | 232 | 226481 | 2036.97 | 589 | 573 | 110.9 |
| B | 8 | 3 | 130398 | 1170.61 | 589 | 573 | 110.9 |
| B | 0 | 183 | 90954 | 814.95 | 589 | 573 | 110.9 |
| C | 15 | 214 | 213764 | 1616.1 | 579 | 582 | 131.9 |
| C | 14 | 254 | 11822 | 85.21 | 579 | 582 | 131.9 |
| C | 0 | 10 | 10513 | 75.29 | 579 | 582 | 131.9 |
| D | 13 | 249 | 732729 | 5338.22 | 574 | 560 | 137.2 |
| D | 2 | 249 | 221468 | 1610.63 | 574 | 560 | 137.2 |
| D | 10 | 118 | 83083 | 601.67 | 574 | 560 | 137.2 |
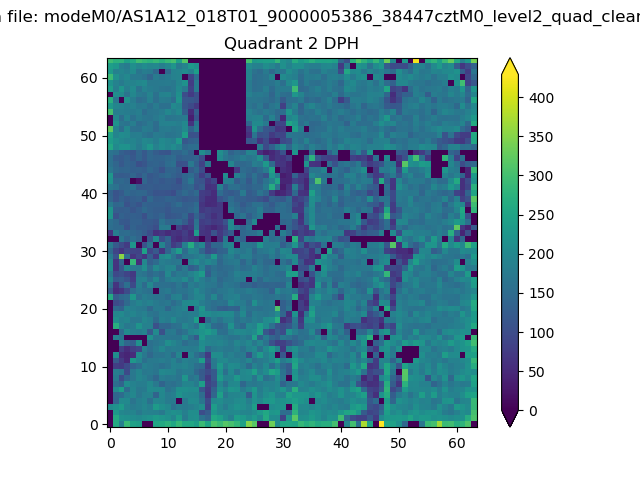
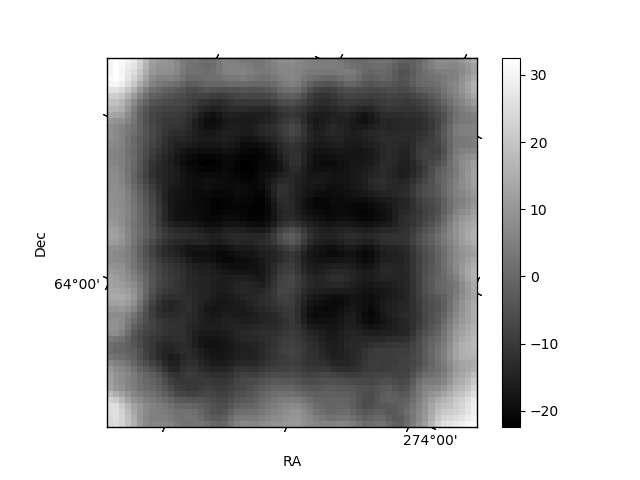
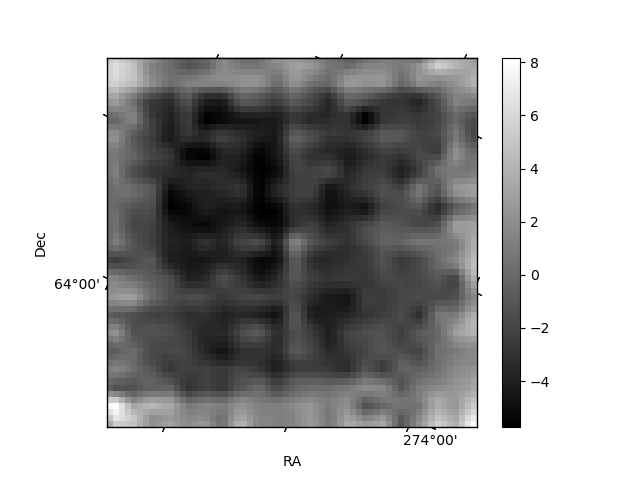
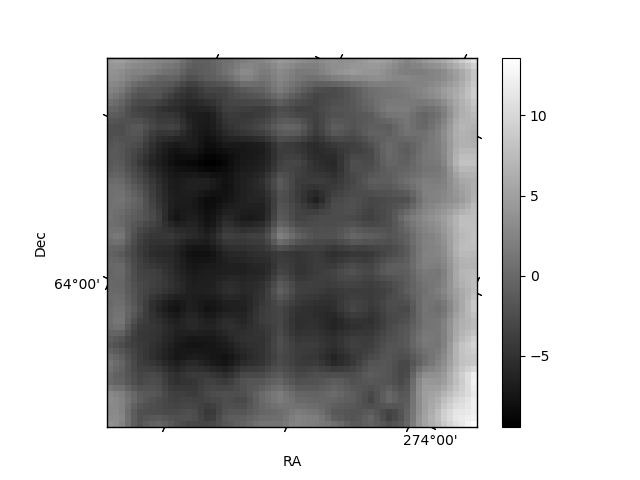
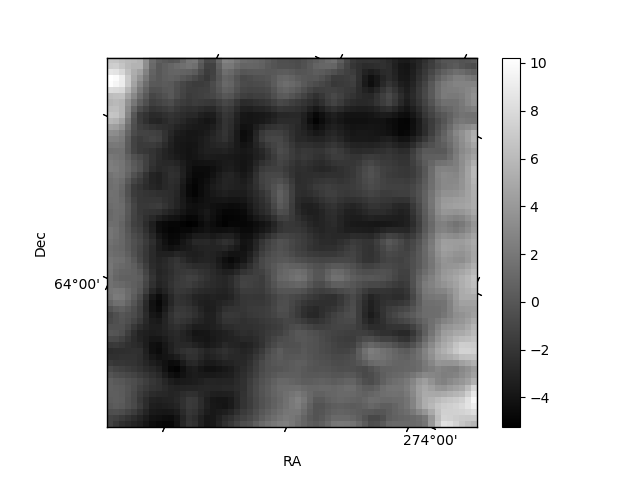
Histogram calculated using DETX and DETY for each event in the final _common_clean file
| Quadrant A | 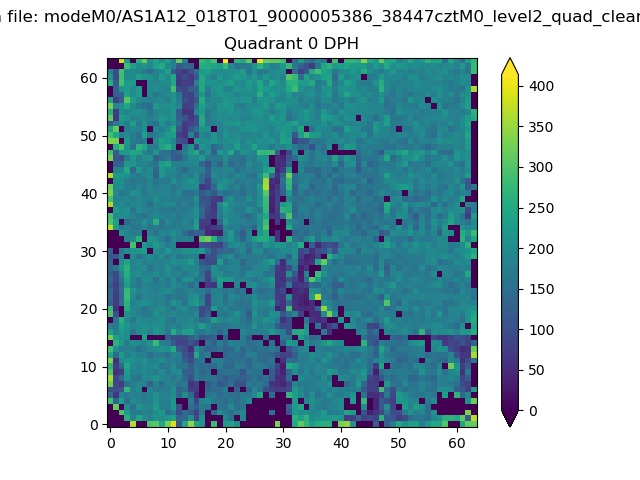 |
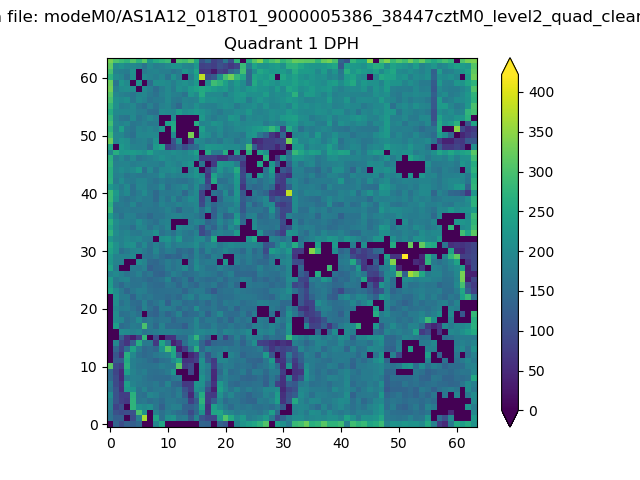 |
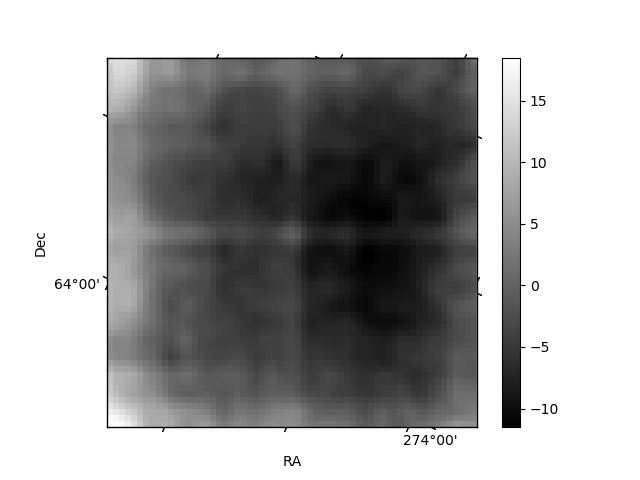
Quadrant B |
|---|---|---|---|
| Quadrant D | 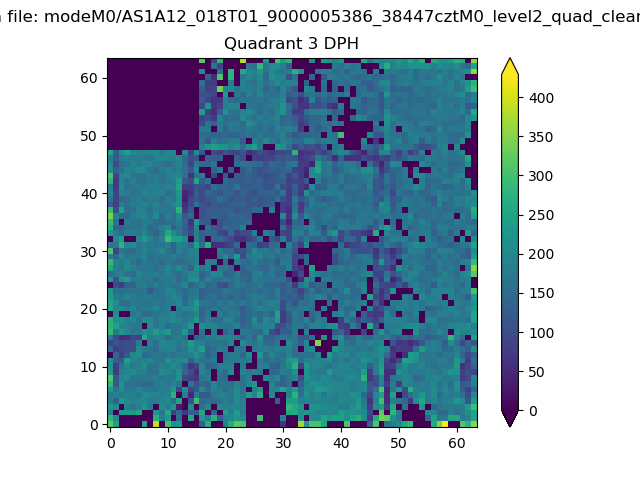 |
 |
Quadrant C |
| Plot type | Count rate plots | Images |
|---|---|---|
| Comparison with Poisson distribution Blue bars denote a histogram of data divided into 1 sec bins. Red curve is a Poisson curve with rate = median count rate of data. |
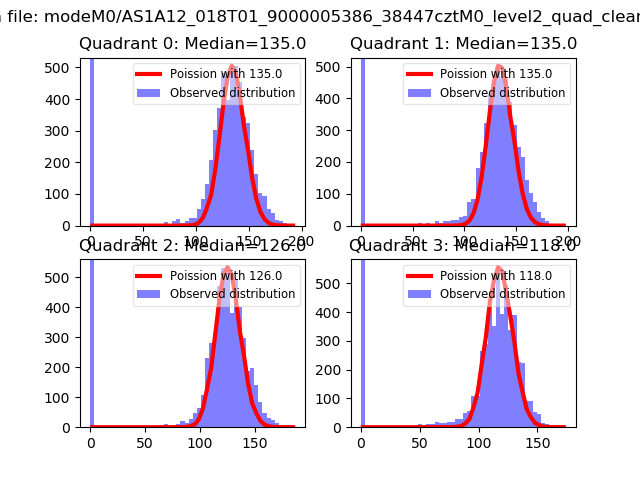 |
 |
| Quadrant-wise count rates Data is divided into 100 sec bins |
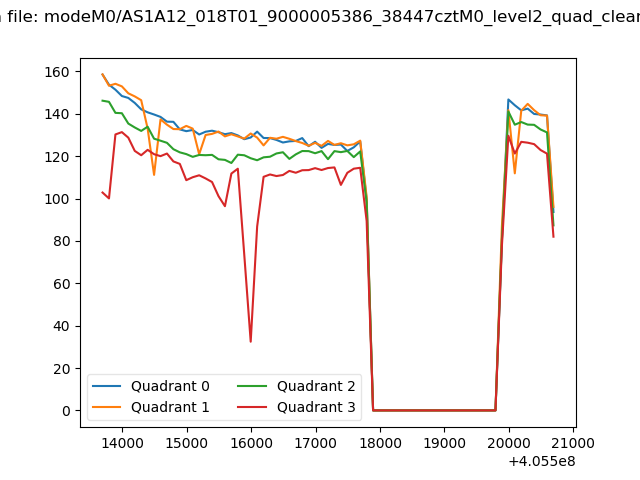 |
|
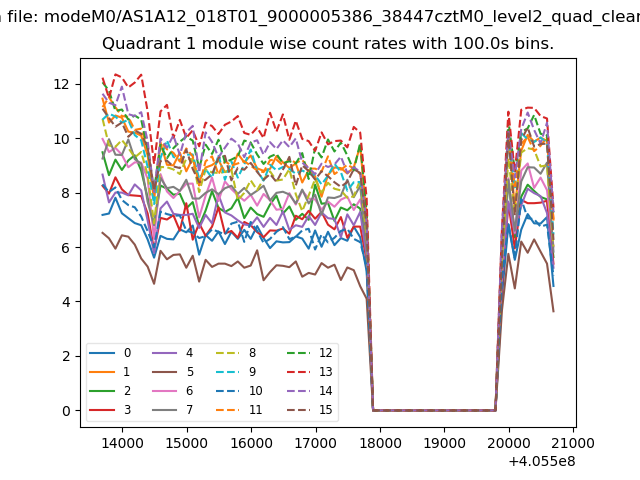
| Module-wise count rates for Quadrant A Data is divided into 100 sec bins |
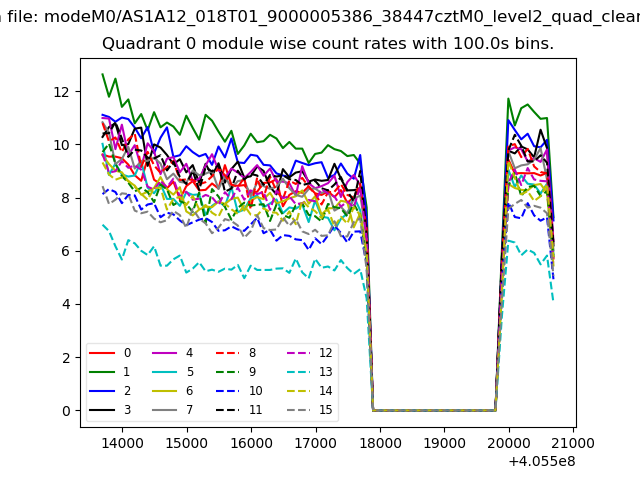 |
 |
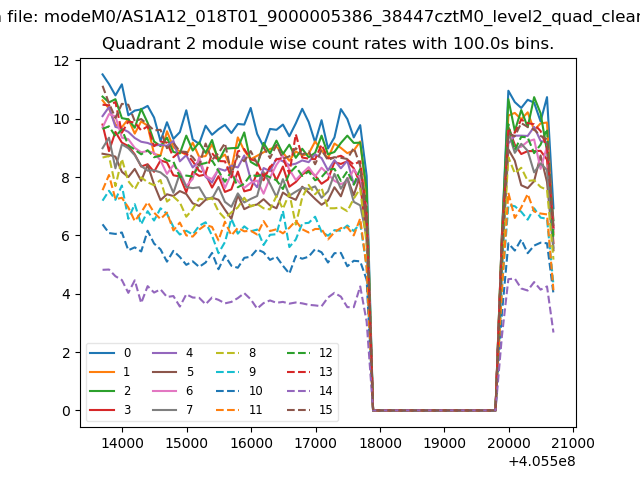
| Module-wise count rates for Quadrant B Data is divided into 100 sec bins |
 |
 |
| Module-wise count rates for Quadrant C Data is divided into 100 sec bins |
 |
 |
| Module-wise count rates for Quadrant D Data is divided into 100 sec bins |
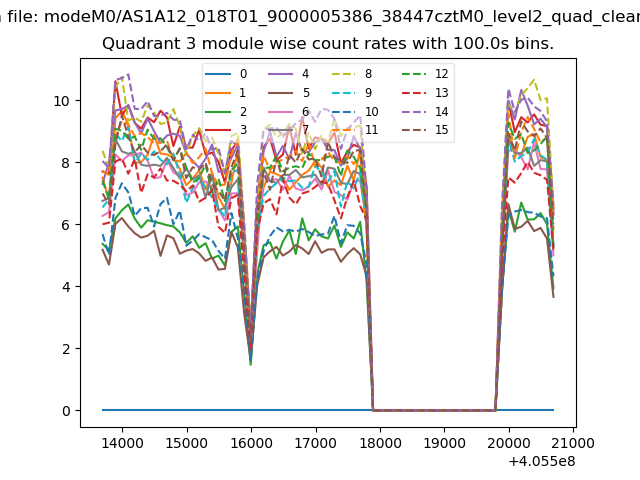 |
 |
| Parameter | Plot |
|---|---|
| CZT HV Monitor | 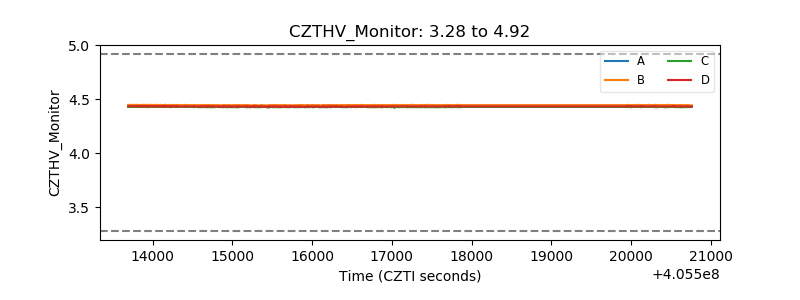 |
| D_VDD | 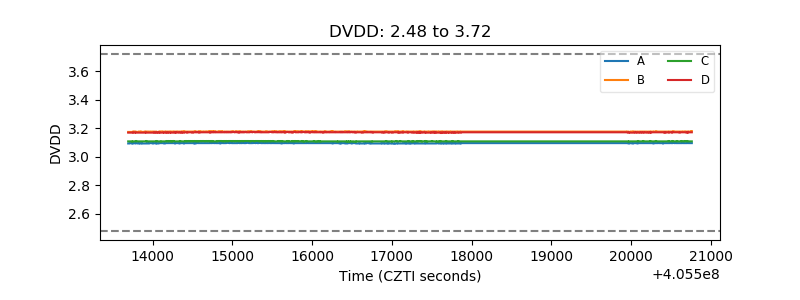 |
| Temperature 1 | 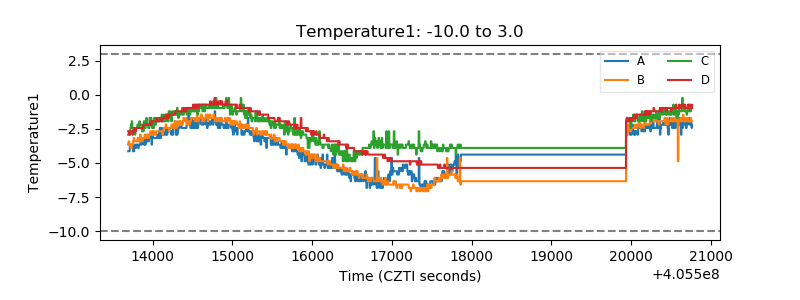 |
| Veto HV Monitor | 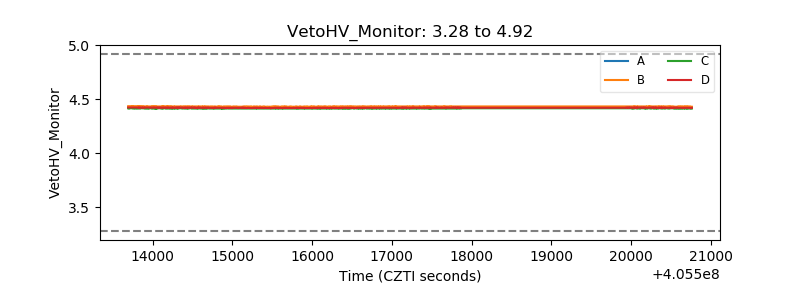 |
| Veto LLD | 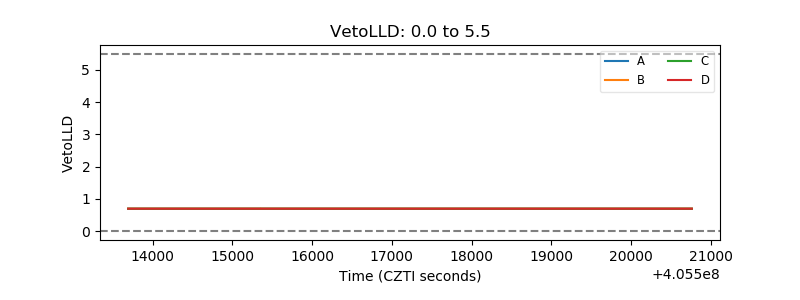 |
| Alpha Counter | 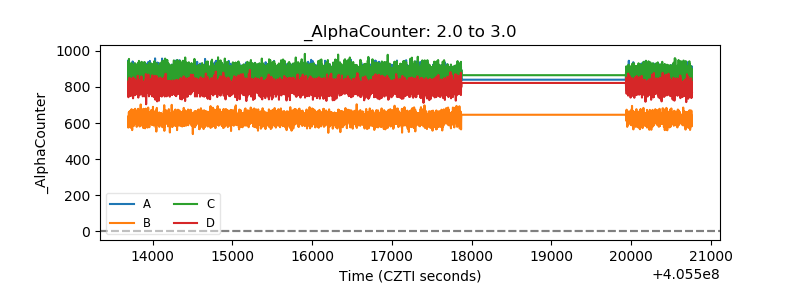 |
| _CPM_Rate | 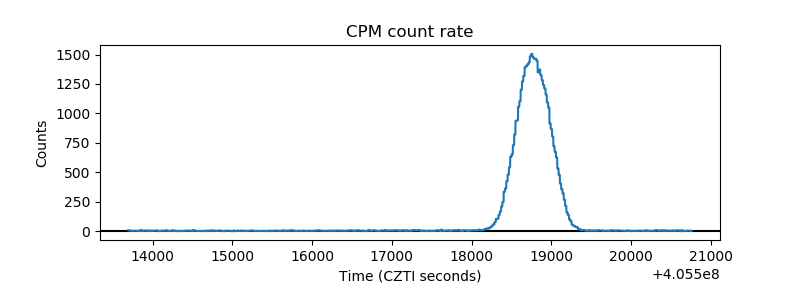 |
| CZT Counter | 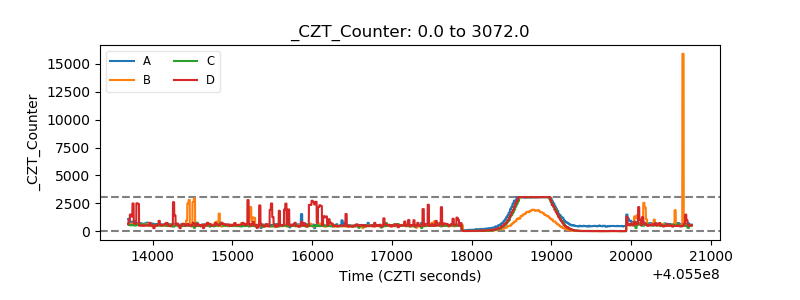 |
| +2.5 Volts monitor | 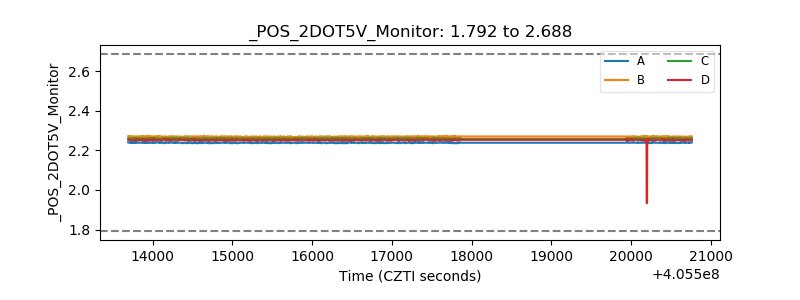 |
| +5 Volts monitor | 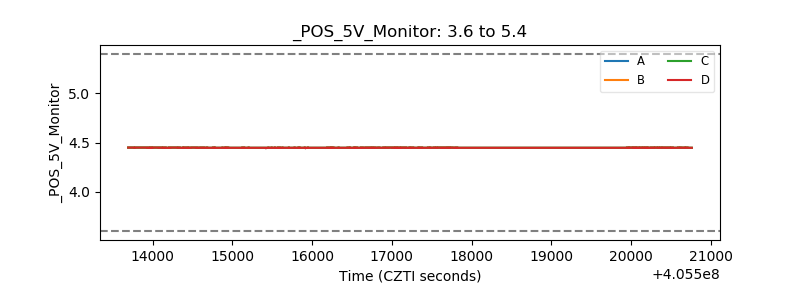 |
| _ROLL_ROT | 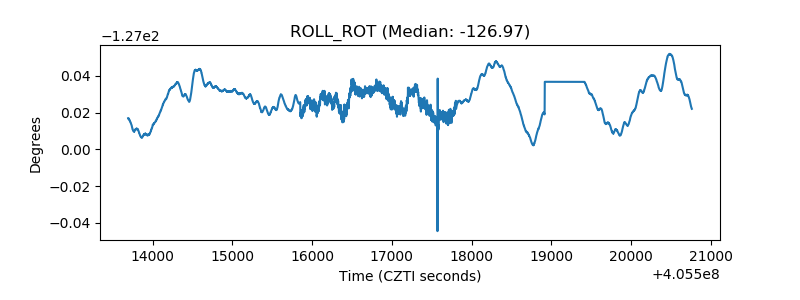 |
| _Roll_DEC | 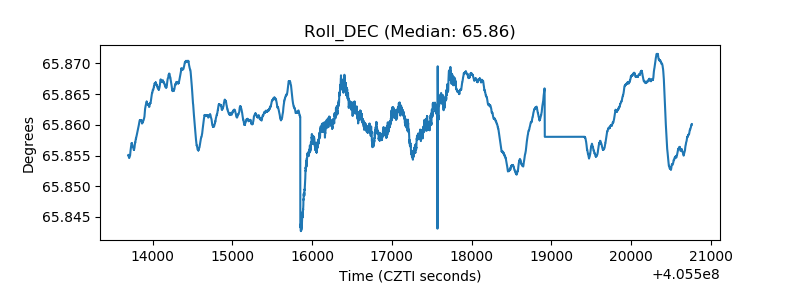 |
| _Roll_RA | 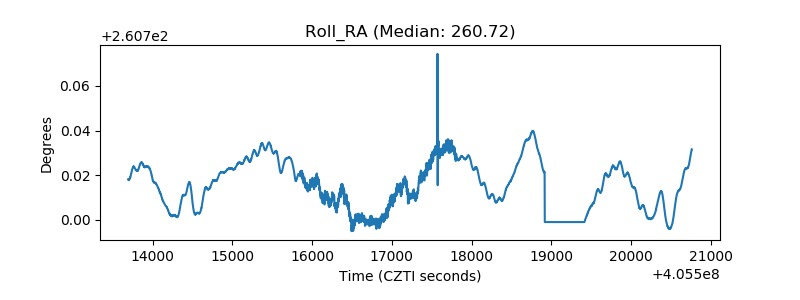 |
| Veto Counter | 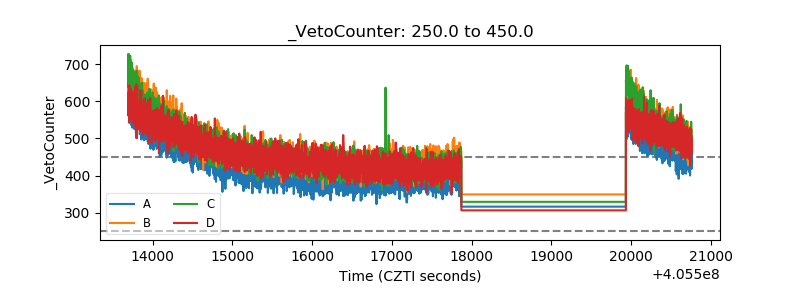 |