| Param | Original file | Final file |
|---|---|---|
| Filename | modeM0/AS1A12_018T01_9000005386_38448cztM0_level2.fits | modeM0/AS1A12_018T01_9000005386_38448cztM0_level2_quad_clean.evt |
| Size (bytes) | 367,655,040 | 97,606,080 |
| Size | 350.6 MB | 93.1 MB |
| Events in quadrant A | 2,911,269 | 679,062 |
| Events in quadrant B | 3,029,099 | 670,505 |
| Events in quadrant C | 2,626,699 | 646,277 |
| Events in quadrant D | 4,634,729 | 593,232 |
| Mode SS | |||
|---|---|---|---|
| Quadrant | BADHDUFLAG | Total packets | Discarded packets |
| A | 0 | 106 | 0 |
| B | 0 | 106 | 0 |
| C | 0 | 106 | 0 |
| D | 0 | 106 | 0 |
| Mode M9 | |||
|---|---|---|---|
| Quadrant | BADHDUFLAG | Total packets | Discarded packets |
| A | 0 | 26 | 0 |
| B | 0 | 26 | 0 |
| C | 0 | 26 | 0 |
| D | 0 | 27 | 0 |
| Mode M0 | |||
|---|---|---|---|
| Quadrant | BADHDUFLAG | Total packets | Discarded packets |
| A | 0 | 11884 | 3 |
| B | 0 | 12207 | 2 |
| C | 0 | 10733 | 2 |
| D | 0 | 17312 | 2 |
| Quadrant | Total seconds | Saturated seconds | Saturation percentage |
|---|---|---|---|
| A | 5240 | 12 | 0.229008% |
| B | 5240 | 136 | 2.595420% |
| C | 5240 | 7 | 0.133588% |
| D | 5240 | 208 | 3.969466% |
Noise dominated data is calculated using 1-second bins in cleaned event files. If a bin has >2000 counts, and if more than 50% of those come from <1% of pixels, then it is considered to be noise-dominated and hence unusable.
| Quadrant | # 1 sec bins | Bins with >0 counts | Bins with >2000 counts | High rate bins dominated by noise | Noise dominated (total time) | Noise dominated (detector-on time) | Marked lightcurve |
|---|---|---|---|---|---|---|---|
| A | 7363 | 5241 | 5 | 5 | 0.07% | 0.10% | 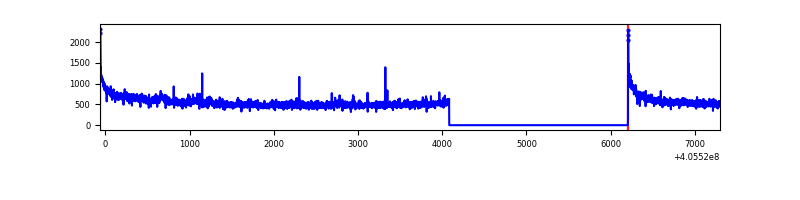 |
| B | 7363 | 5241 | 96 | 96 | 1.30% | 1.83% | 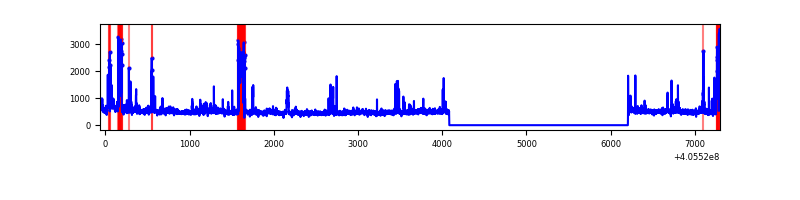 |
| C | 7363 | 5241 | 4 | 4 | 0.05% | 0.08% | 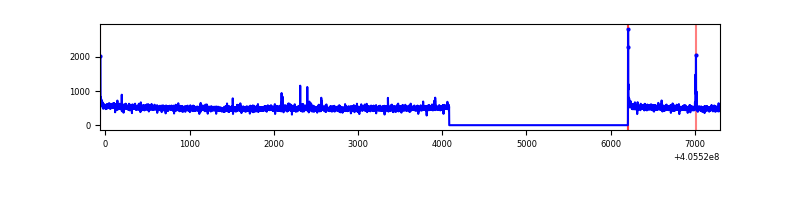 |
| D | 7363 | 5241 | 184 | 184 | 2.50% | 3.51% | 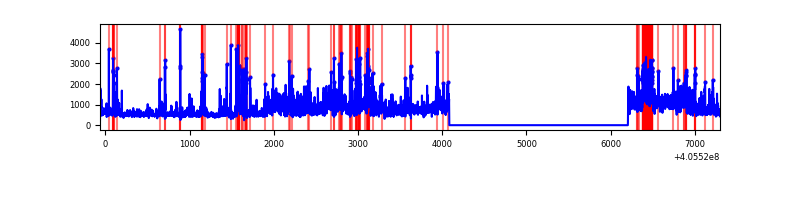 |
Top three noisy pixels from each quadrant. If the there are fewer than three noisy pixels in the level2.evt file, extra rows are filled as -1
| Pixel properties | Quadrant properties | ||||||
|---|---|---|---|---|---|---|---|
| Quadrant | DetID | PixID | Counts | Sigma | Mean | Median | Sigma |
| A | 10 | 83 | 412532 | 3331.12 | 621 | 610 | 123.7 |
| A | 15 | 223 | 61899 | 495.63 | 621 | 610 | 123.7 |
| A | 13 | 6 | 21383 | 167.99 | 621 | 610 | 123.7 |
| B | 8 | 3 | 211559 | 1856.84 | 604 | 590 | 113.6 |
| B | 0 | 183 | 149626 | 1311.74 | 604 | 590 | 113.6 |
| B | 5 | 184 | 94868 | 829.79 | 604 | 590 | 113.6 |
| C | 15 | 214 | 221178 | 1613.6 | 603 | 607 | 136.7 |
| C | 0 | 10 | 19831 | 140.63 | 603 | 607 | 136.7 |
| C | 14 | 254 | 16629 | 117.21 | 603 | 607 | 136.7 |
| D | 2 | 16 | 1345683 | 9389.67 | 602 | 587 | 143.3 |
| D | 13 | 249 | 322061 | 2244.1 | 602 | 587 | 143.3 |
| D | 2 | 153 | 310722 | 2164.95 | 602 | 587 | 143.3 |
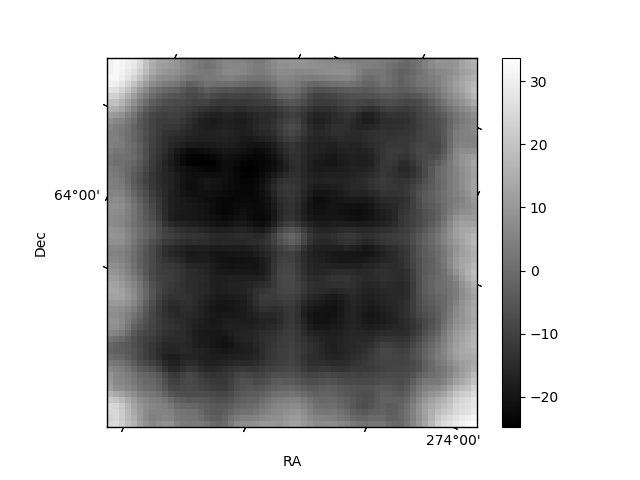
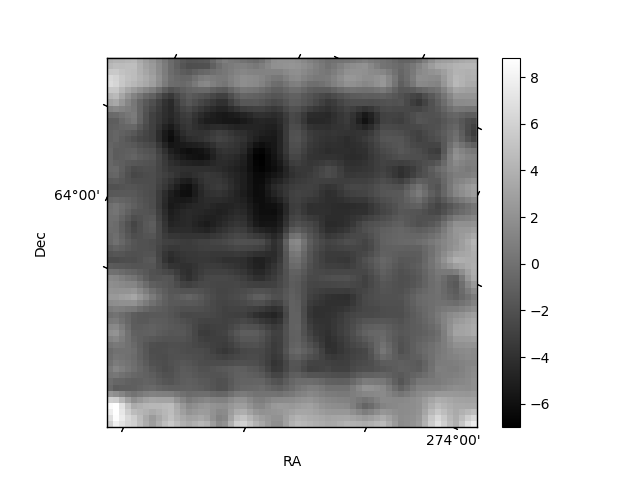
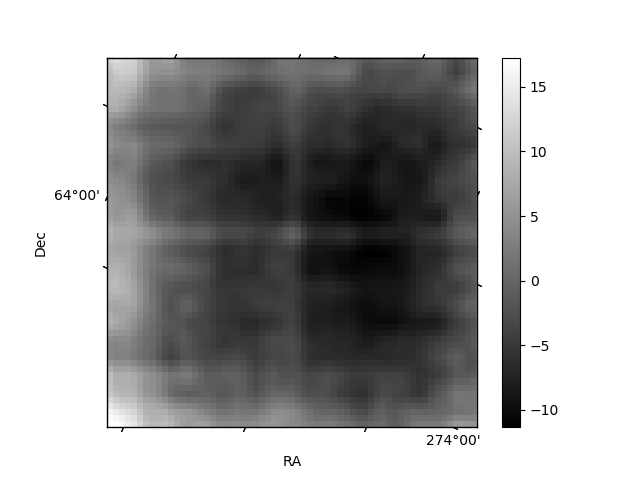
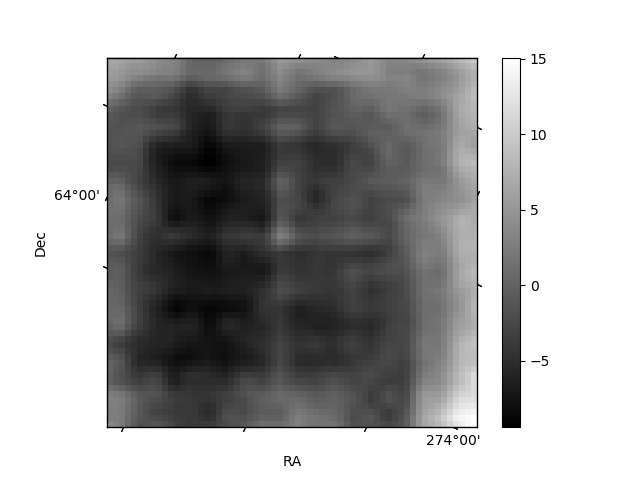
Histogram calculated using DETX and DETY for each event in the final _common_clean file
| Quadrant A | 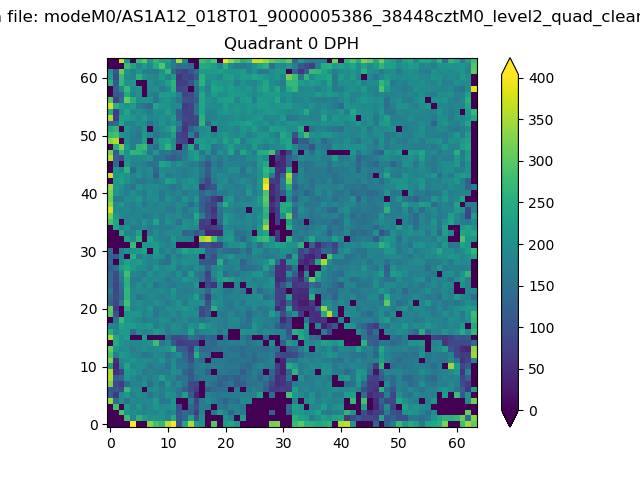 |
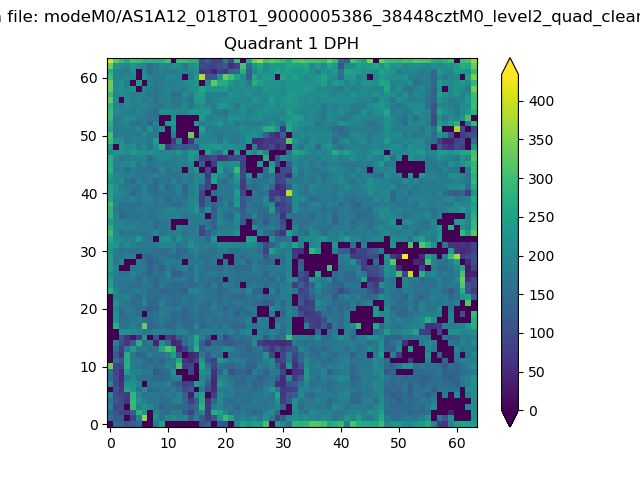 |
Quadrant B |
|---|---|---|---|
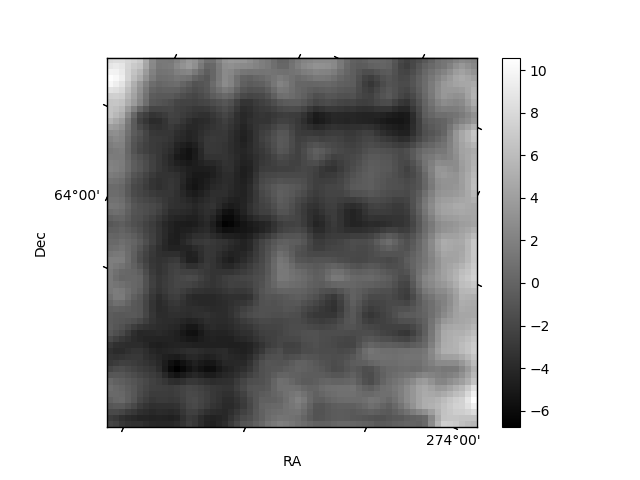
| Quadrant D | 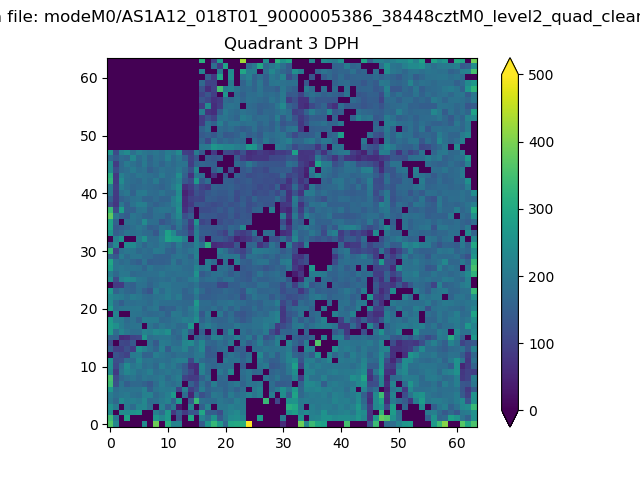 |
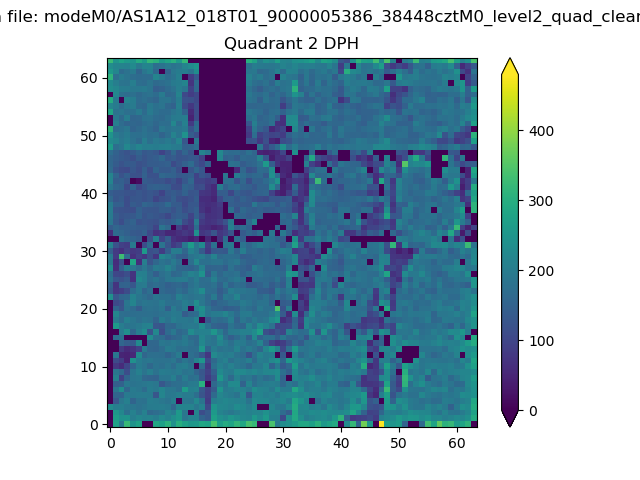 |
Quadrant C |
| Plot type | Count rate plots | Images |
|---|---|---|
| Comparison with Poisson distribution Blue bars denote a histogram of data divided into 1 sec bins. Red curve is a Poisson curve with rate = median count rate of data. |
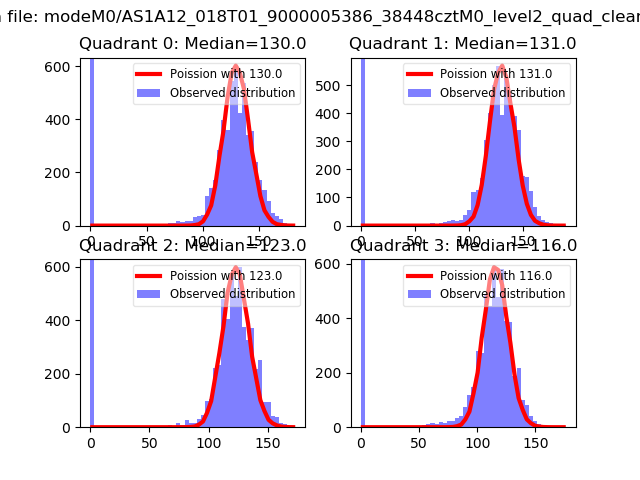 |
 |
| Quadrant-wise count rates Data is divided into 100 sec bins |
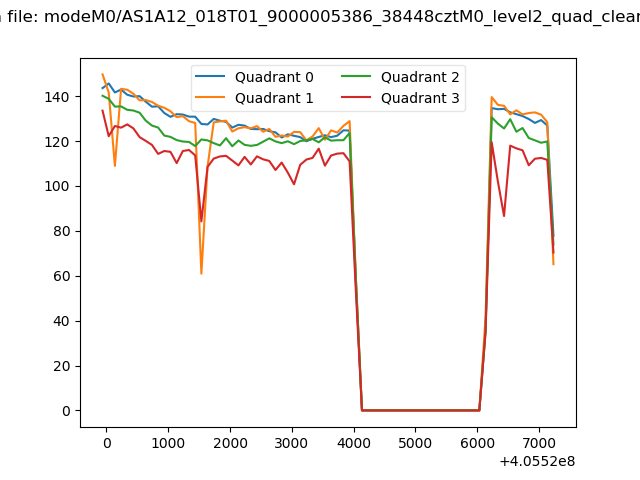 |
|
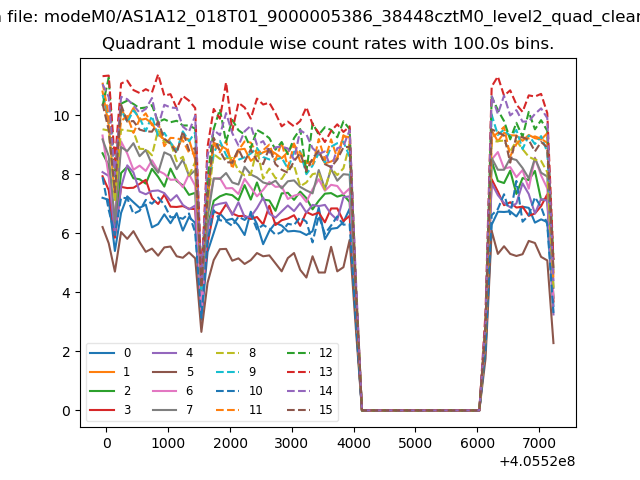
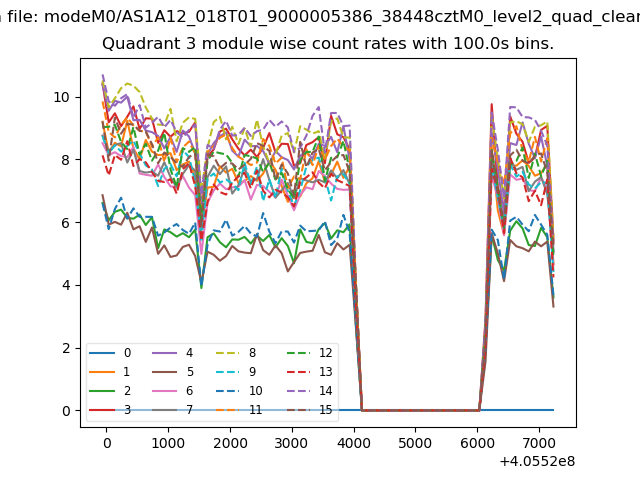
| Module-wise count rates for Quadrant A Data is divided into 100 sec bins |
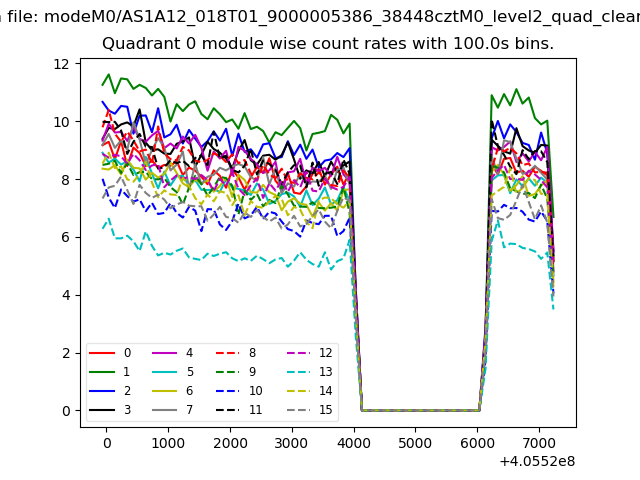 |
 |
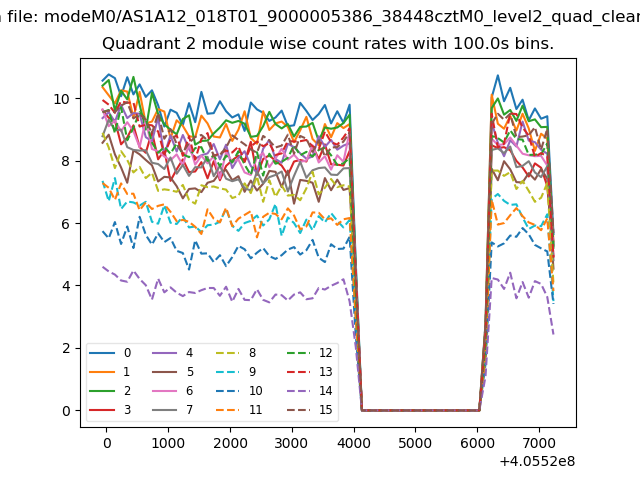
| Module-wise count rates for Quadrant B Data is divided into 100 sec bins |
 |
 |
| Module-wise count rates for Quadrant C Data is divided into 100 sec bins |
 |
 |
| Module-wise count rates for Quadrant D Data is divided into 100 sec bins |
 |
 |
| Parameter | Plot |
|---|---|
| CZT HV Monitor | 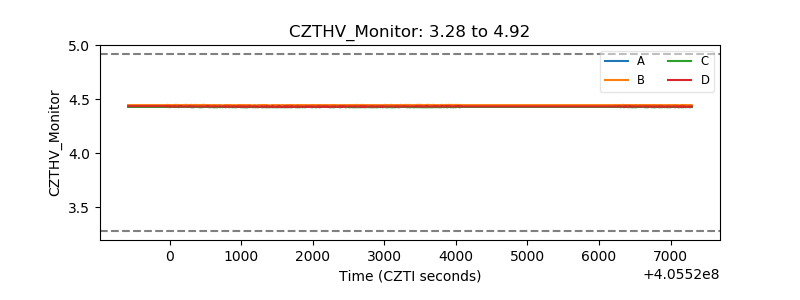 |
| D_VDD | 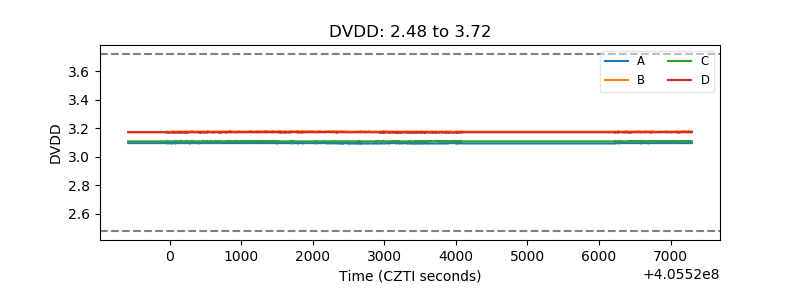 |
| Temperature 1 | 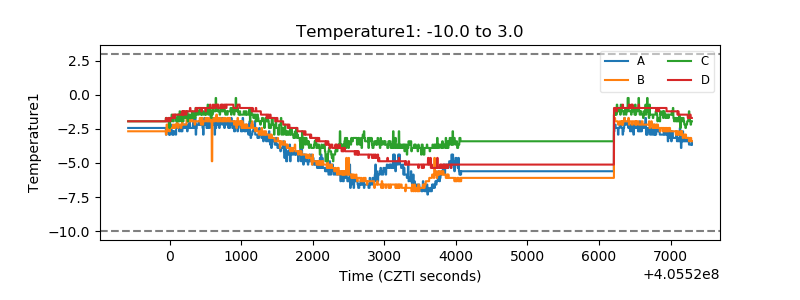 |
| Veto HV Monitor | 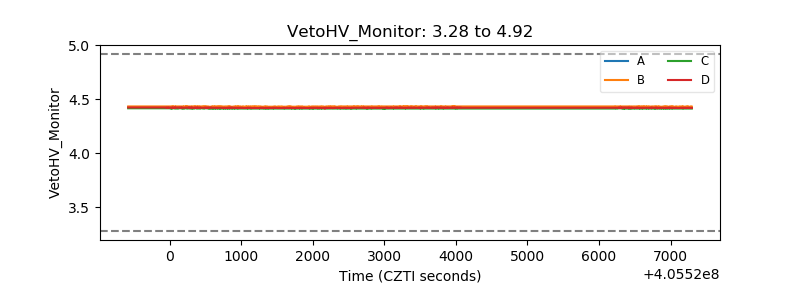 |
| Veto LLD | 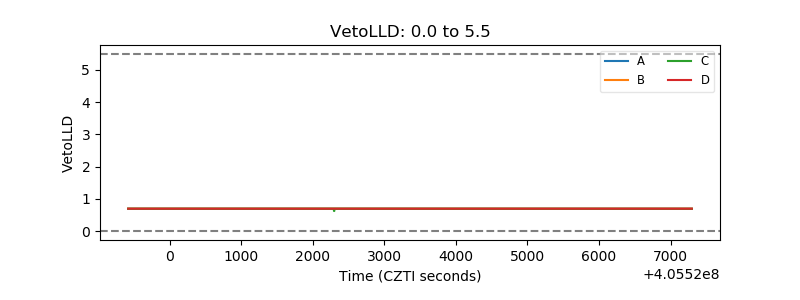 |
| Alpha Counter | 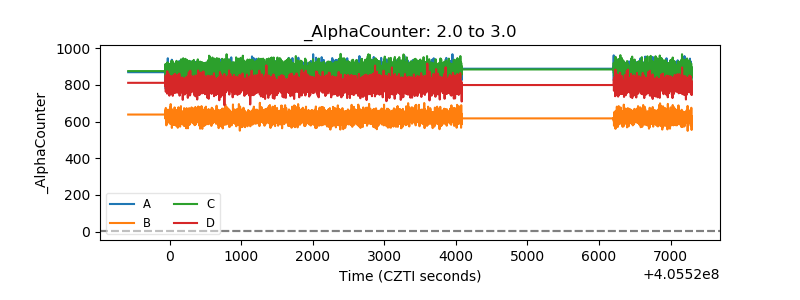 |
| _CPM_Rate | 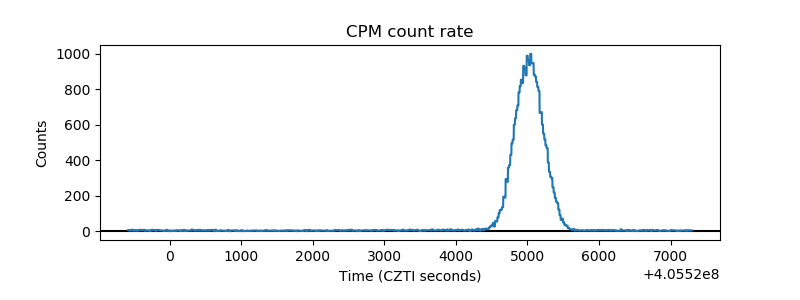 |
| CZT Counter | 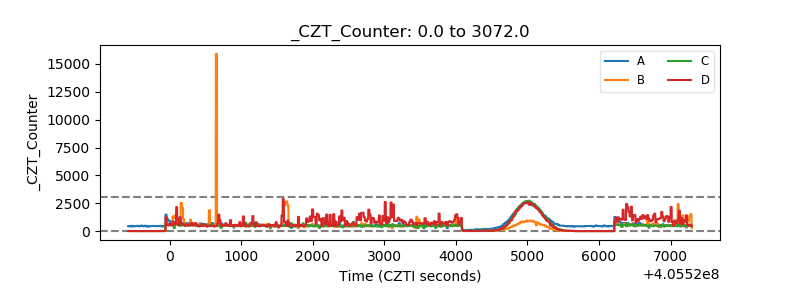 |
| +2.5 Volts monitor | 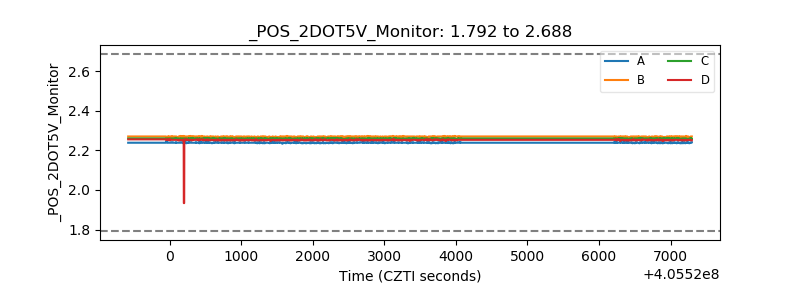 |
| +5 Volts monitor |  |
| _ROLL_ROT | 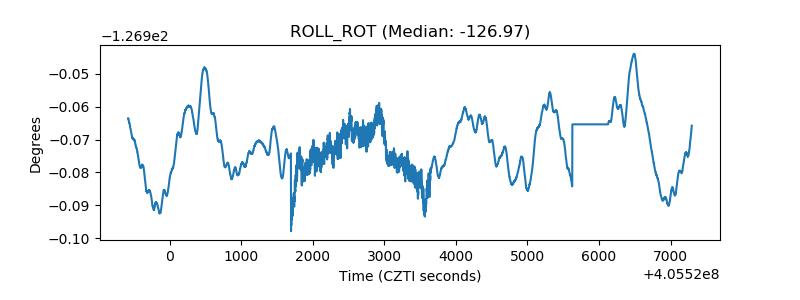 |
| _Roll_DEC | 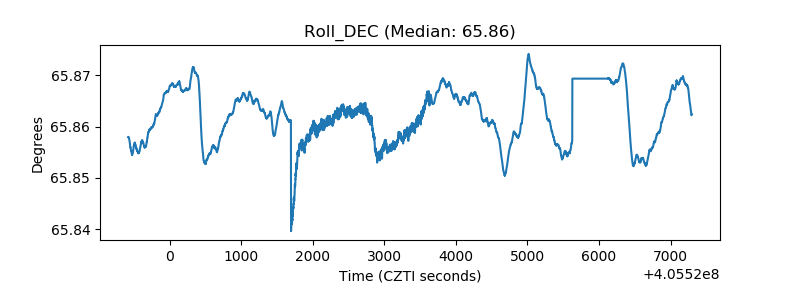 |
| _Roll_RA | 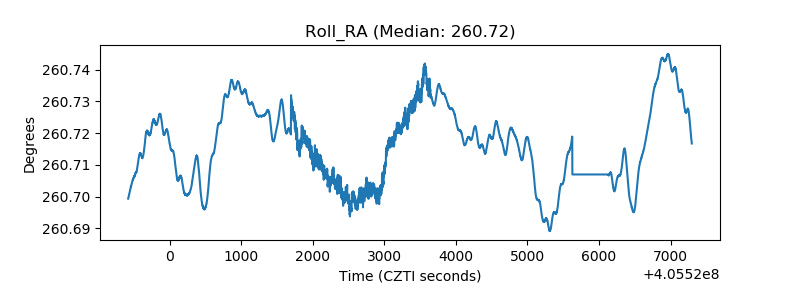 |
| Veto Counter | 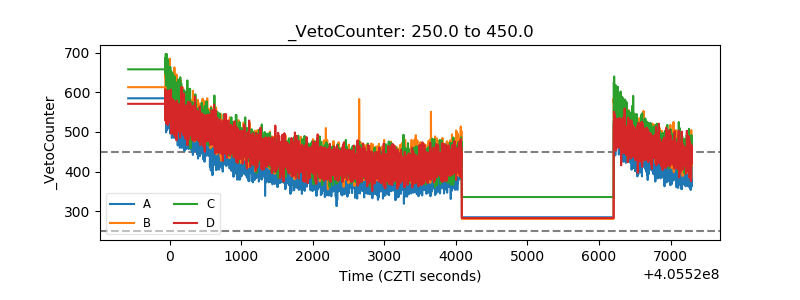 |