| Param | Original file | Final file |
|---|---|---|
| Filename | modeM0/AS1A12_018T01_9000005386_38449cztM0_level2.fits | modeM0/AS1A12_018T01_9000005386_38449cztM0_level2_quad_clean.evt |
| Size (bytes) | 430,597,440 | 87,840,000 |
| Size | 410.6 MB | 83.8 MB |
| Events in quadrant A | 2,734,978 | 627,237 |
| Events in quadrant B | 5,562,049 | 528,357 |
| Events in quadrant C | 2,504,621 | 604,287 |
| Events in quadrant D | 4,740,361 | 541,284 |
| Mode SS | |||
|---|---|---|---|
| Quadrant | BADHDUFLAG | Total packets | Discarded packets |
| A | 0 | 106 | 0 |
| B | 0 | 106 | 0 |
| C | 0 | 106 | 0 |
| D | 0 | 106 | 0 |
| Mode M9 | |||
|---|---|---|---|
| Quadrant | BADHDUFLAG | Total packets | Discarded packets |
| A | 0 | 21 | 0 |
| B | 0 | 21 | 0 |
| C | 0 | 21 | 0 |
| D | 0 | 21 | 0 |
| Mode M0 | |||
|---|---|---|---|
| Quadrant | BADHDUFLAG | Total packets | Discarded packets |
| A | 0 | 11202 | 3 |
| B | 0 | 19897 | 2 |
| C | 0 | 10415 | 2 |
| D | 0 | 17487 | 2 |
| Quadrant | Total seconds | Saturated seconds | Saturation percentage |
|---|---|---|---|
| A | 5111 | 9 | 0.176091% |
| B | 5111 | 1085 | 21.228722% |
| C | 5111 | 12 | 0.234788% |
| D | 5112 | 309 | 6.044601% |
Noise dominated data is calculated using 1-second bins in cleaned event files. If a bin has >2000 counts, and if more than 50% of those come from <1% of pixels, then it is considered to be noise-dominated and hence unusable.
| Quadrant | # 1 sec bins | Bins with >0 counts | Bins with >2000 counts | High rate bins dominated by noise | Noise dominated (total time) | Noise dominated (detector-on time) | Marked lightcurve |
|---|---|---|---|---|---|---|---|
| A | 7234 | 5112 | 7 | 7 | 0.10% | 0.14% | 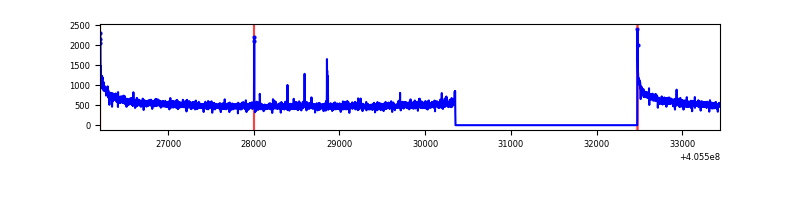 |
| B | 7234 | 5111 | 820 | 820 | 11.34% | 16.04% | 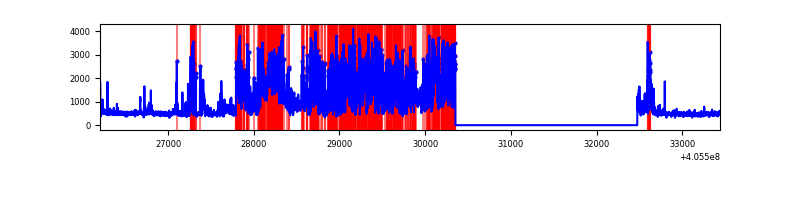 |
| C | 7234 | 5112 | 6 | 6 | 0.08% | 0.12% | 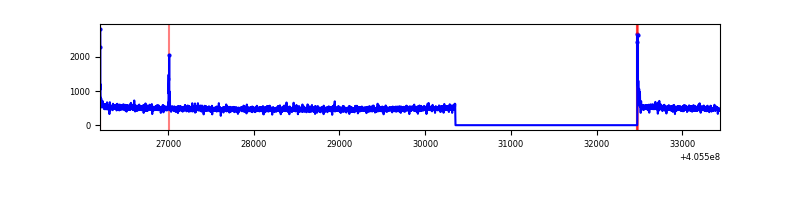 |
| D | 7235 | 5113 | 326 | 326 | 4.51% | 6.38% | 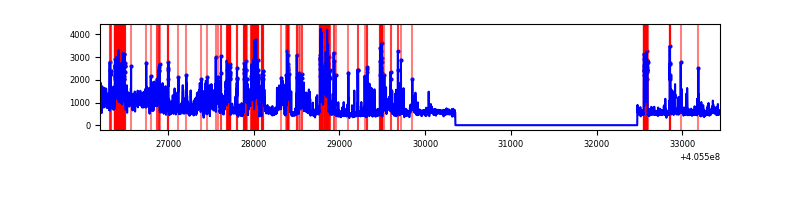 |
Top three noisy pixels from each quadrant. If the there are fewer than three noisy pixels in the level2.evt file, extra rows are filled as -1
| Pixel properties | Quadrant properties | ||||||
|---|---|---|---|---|---|---|---|
| Quadrant | DetID | PixID | Counts | Sigma | Mean | Median | Sigma |
| A | 10 | 83 | 401909 | 3404.97 | 586 | 573 | 117.9 |
| A | 15 | 223 | 20929 | 172.7 | 586 | 573 | 117.9 |
| A | 13 | 6 | 14283 | 116.32 | 586 | 573 | 117.9 |
| B | 8 | 3 | 2648581 | 26357.02 | 536 | 522 | 100.5 |
| B | 5 | 184 | 573043 | 5698.49 | 536 | 522 | 100.5 |
| B | 0 | 189 | 87215 | 862.88 | 536 | 522 | 100.5 |
| C | 15 | 214 | 216883 | 1620.98 | 576 | 578 | 133.4 |
| C | 0 | 10 | 28580 | 209.85 | 576 | 578 | 133.4 |
| C | 1 | 241 | 10878 | 77.19 | 576 | 578 | 133.4 |
| D | 2 | 16 | 1477484 | 10790.25 | 567 | 551 | 136.9 |
| D | 2 | 153 | 428044 | 3123.2 | 567 | 551 | 136.9 |
| D | 2 | 249 | 215778 | 1572.42 | 567 | 551 | 136.9 |
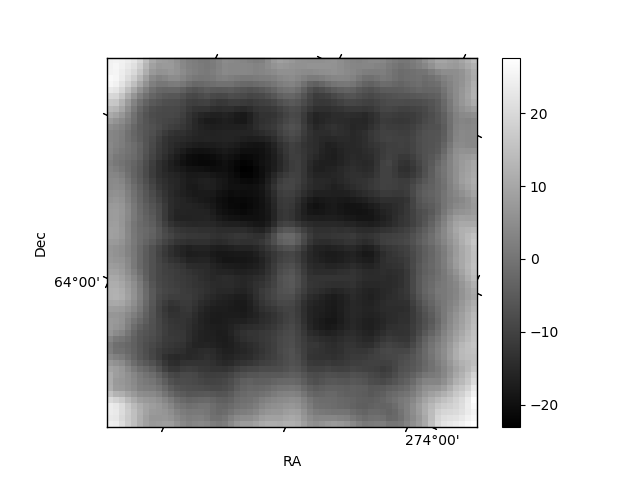
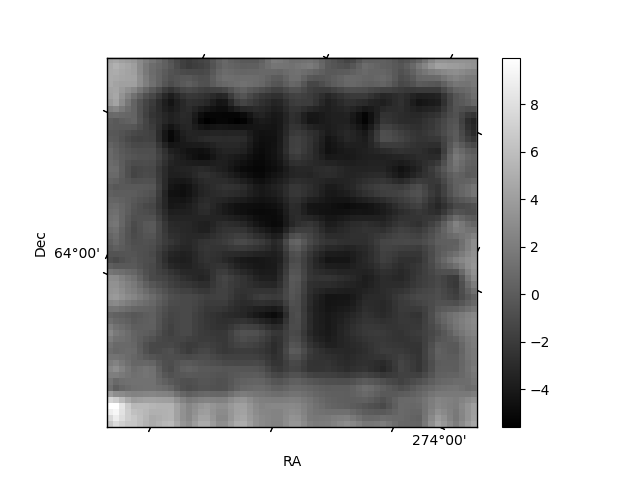
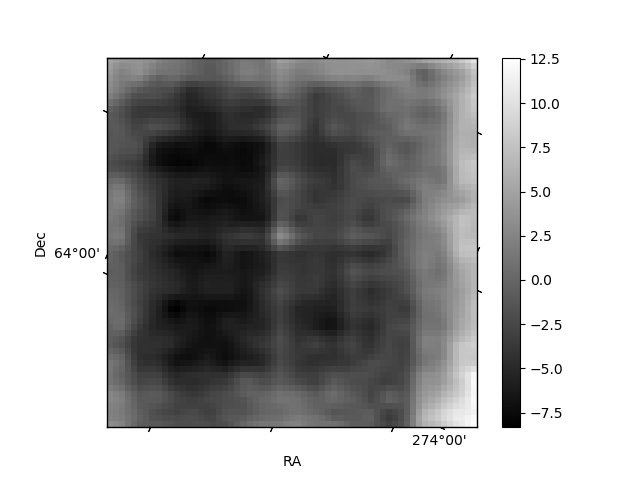
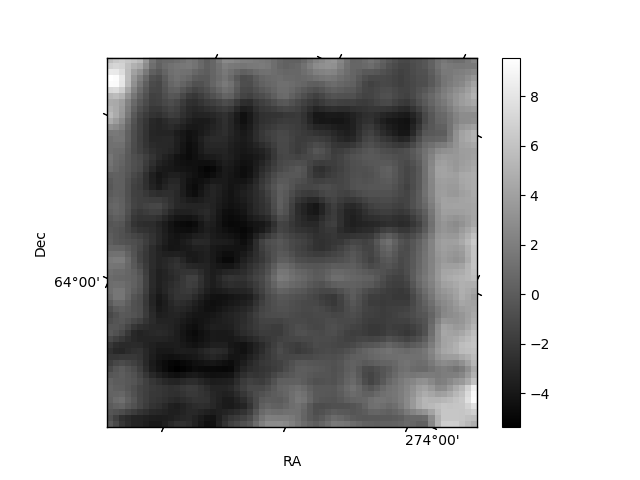
Histogram calculated using DETX and DETY for each event in the final _common_clean file
| Quadrant A | 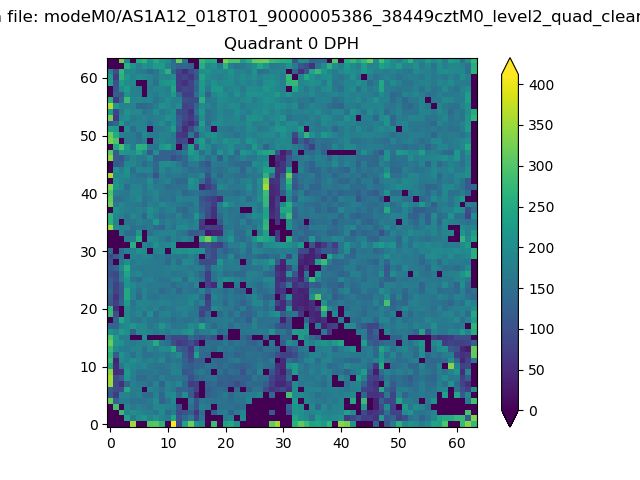 |
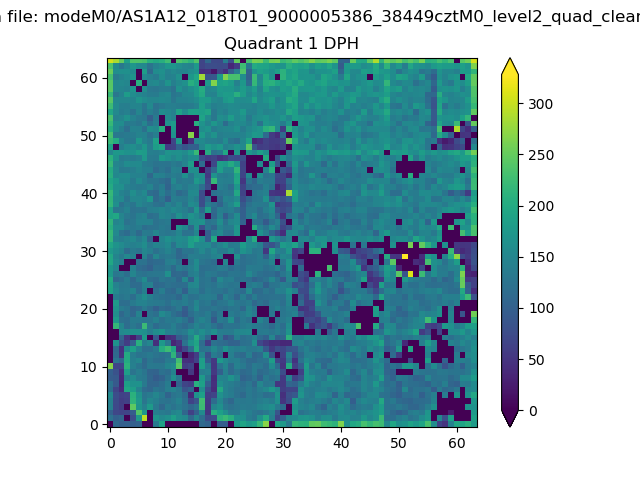 |
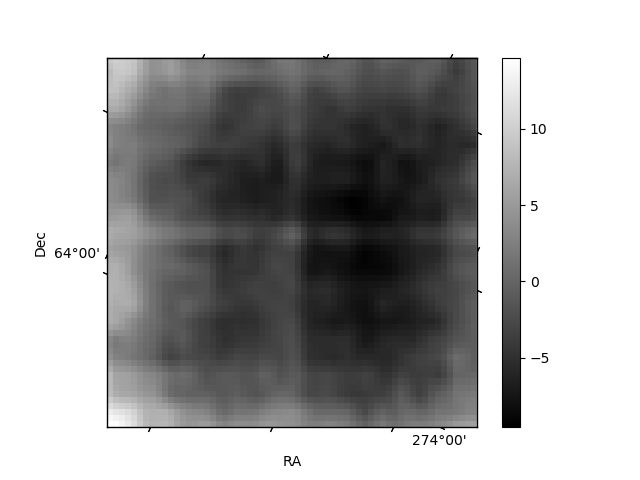
Quadrant B |
|---|---|---|---|
| Quadrant D | 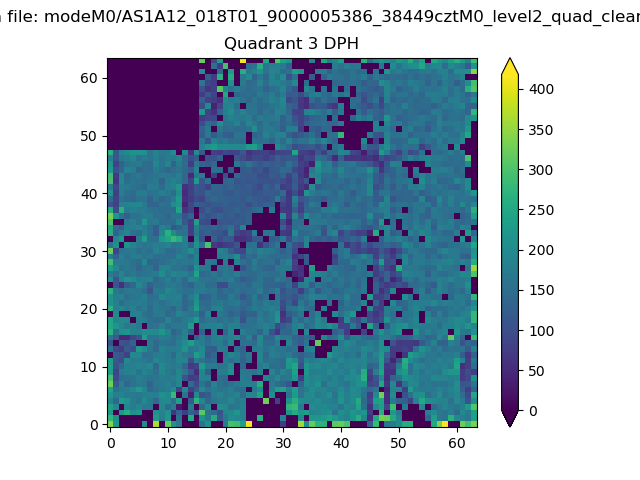 |
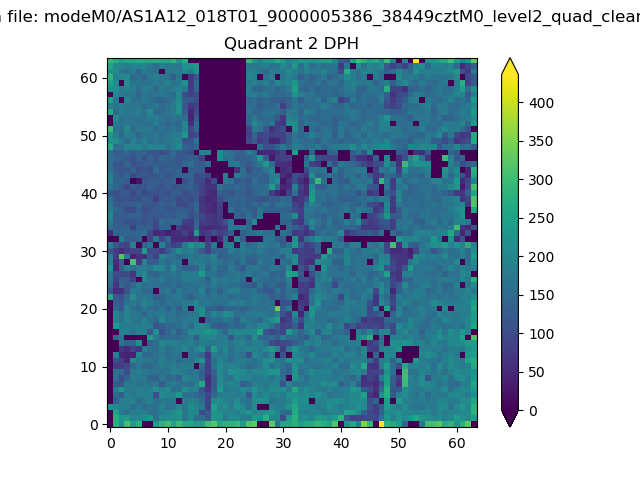 |
Quadrant C |
| Plot type | Count rate plots | Images |
|---|---|---|
| Comparison with Poisson distribution Blue bars denote a histogram of data divided into 1 sec bins. Red curve is a Poisson curve with rate = median count rate of data. |
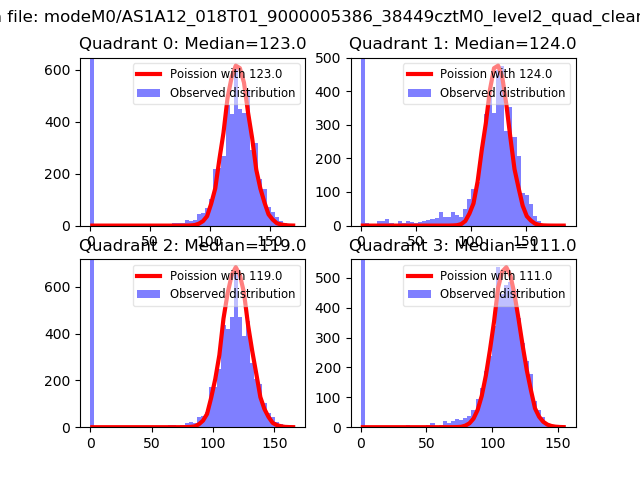 |
 |
| Quadrant-wise count rates Data is divided into 100 sec bins |
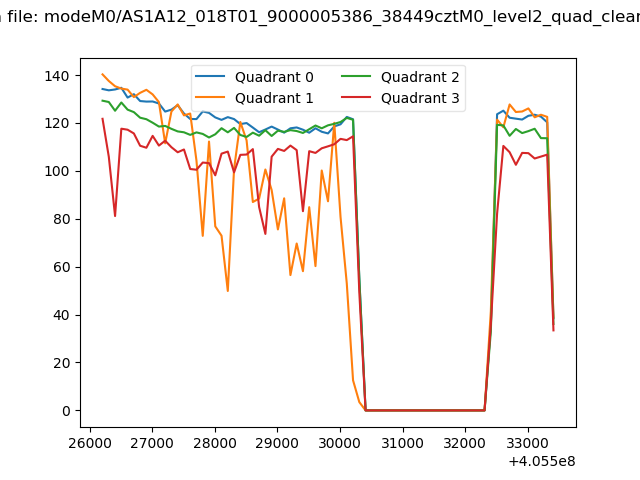 |
|
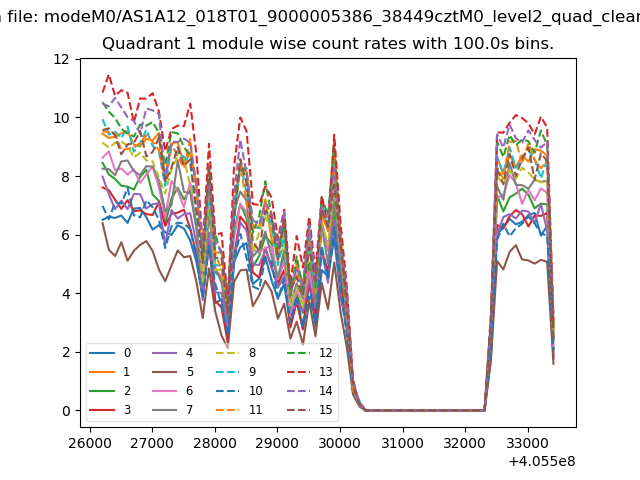
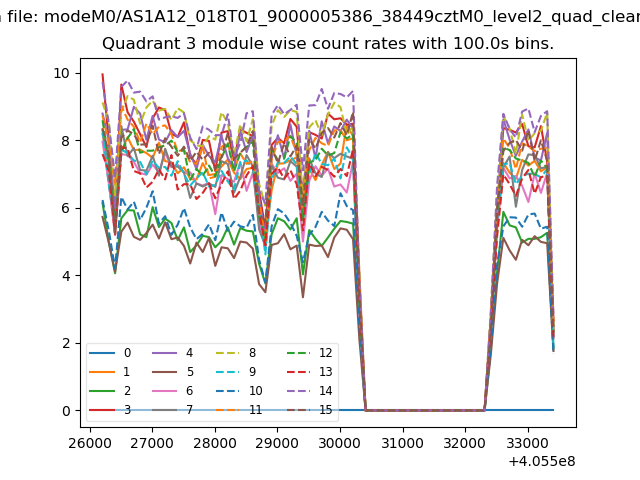
| Module-wise count rates for Quadrant A Data is divided into 100 sec bins |
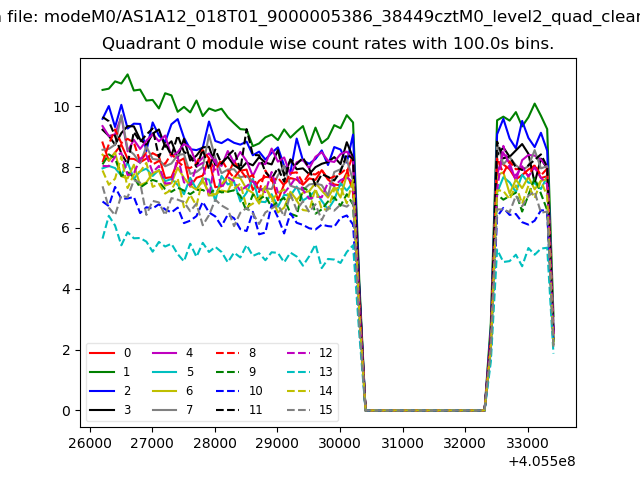 |
 |
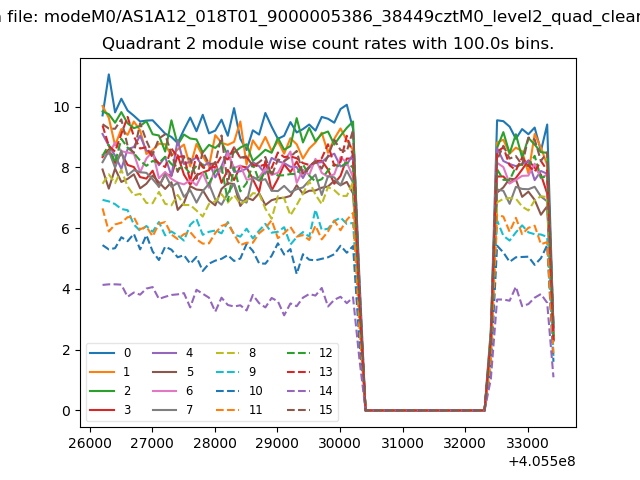
| Module-wise count rates for Quadrant B Data is divided into 100 sec bins |
 |
 |
| Module-wise count rates for Quadrant C Data is divided into 100 sec bins |
 |
 |
| Module-wise count rates for Quadrant D Data is divided into 100 sec bins |
 |
 |
| Parameter | Plot |
|---|---|
| CZT HV Monitor |  |
| D_VDD | 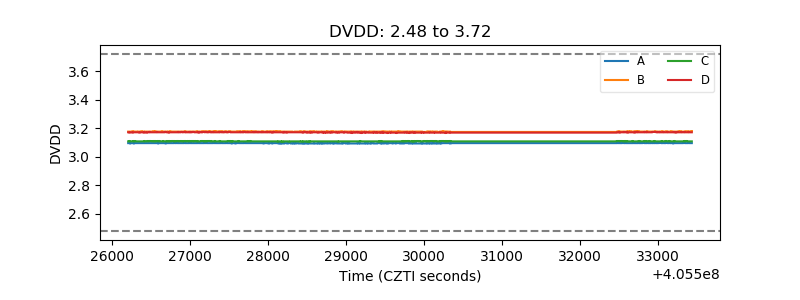 |
| Temperature 1 | 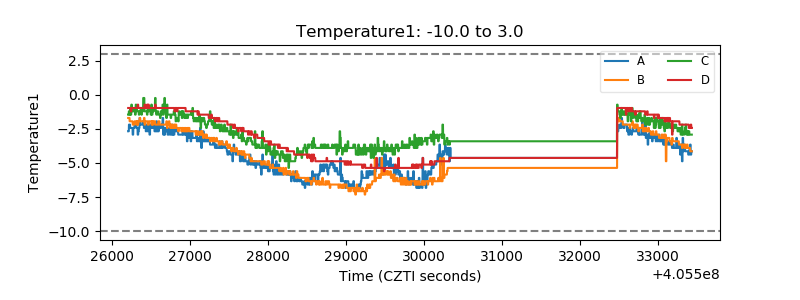 |
| Veto HV Monitor | 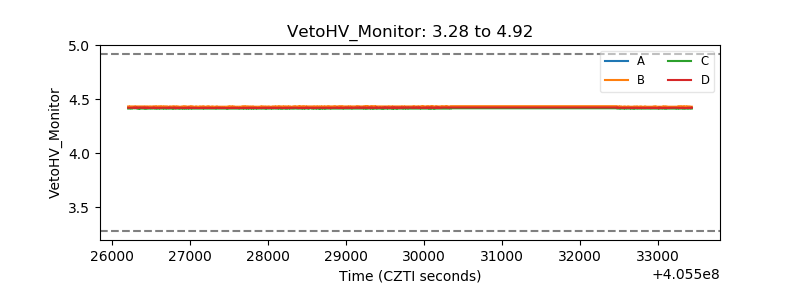 |
| Veto LLD | 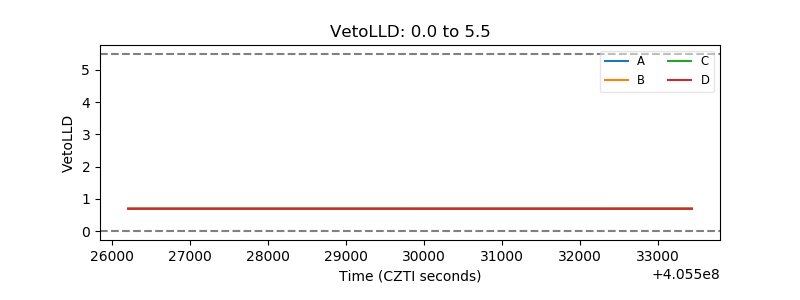 |
| Alpha Counter | 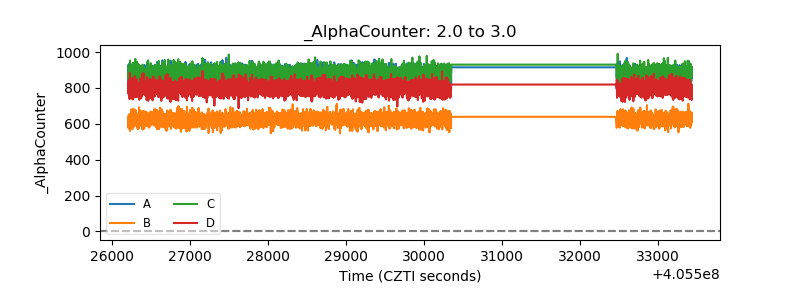 |
| _CPM_Rate | 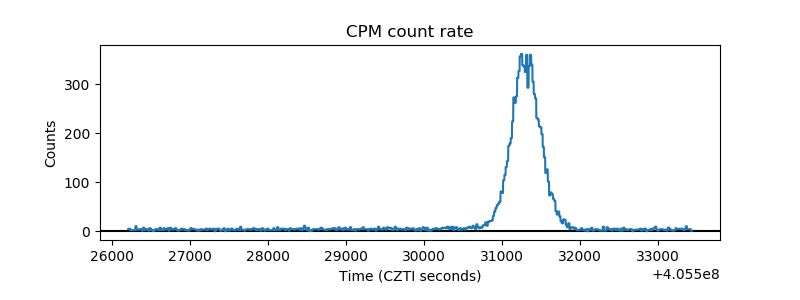 |
| CZT Counter | 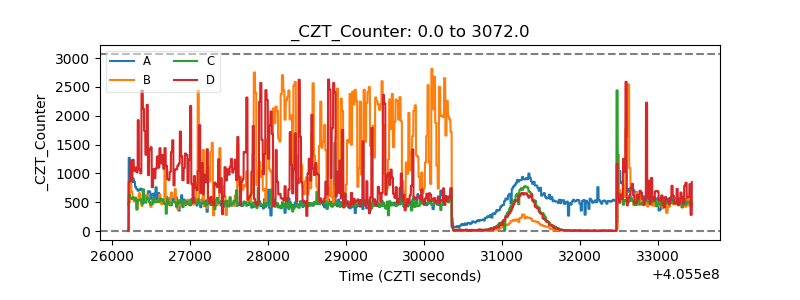 |
| +2.5 Volts monitor | 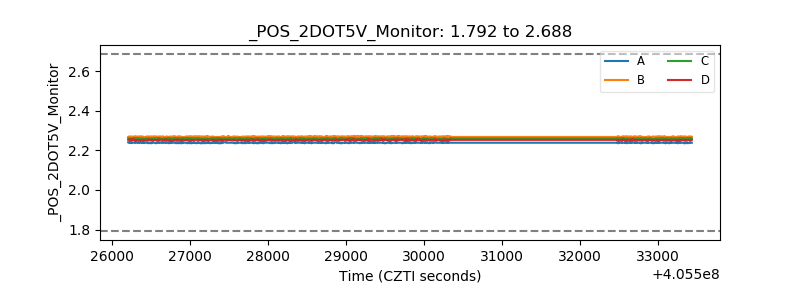 |
| +5 Volts monitor | 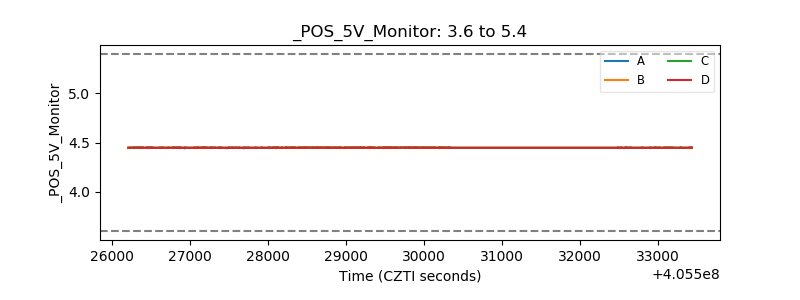 |
| _ROLL_ROT | 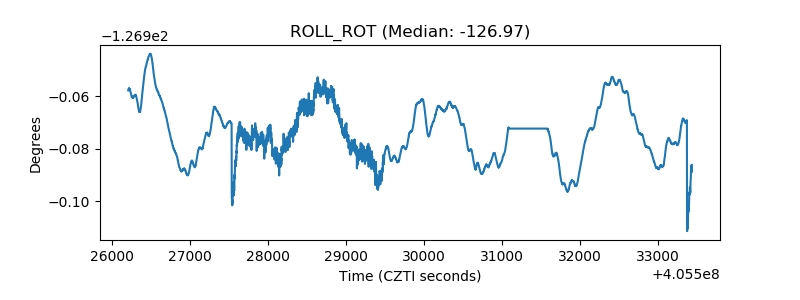 |
| _Roll_DEC | 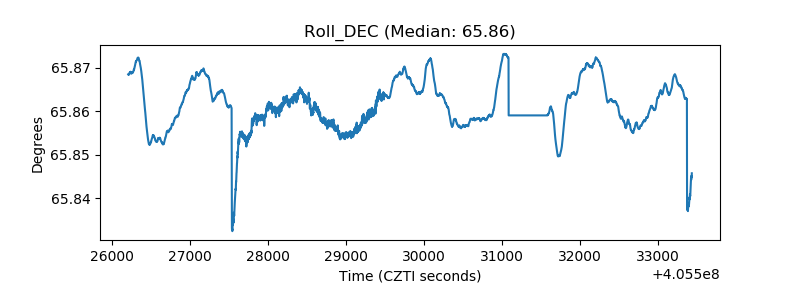 |
| _Roll_RA | 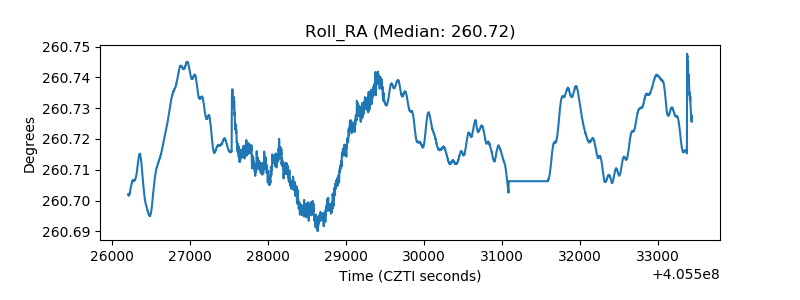 |
| Veto Counter | 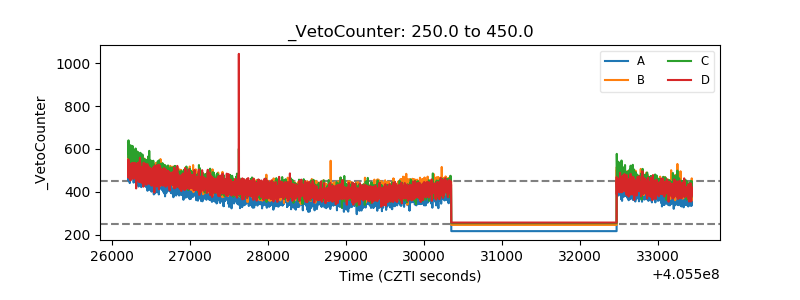 |