| Param | Original file | Final file |
|---|---|---|
| Filename | modeM0/AS1A12_018T01_9000005386_38450cztM0_level2.fits | modeM0/AS1A12_018T01_9000005386_38450cztM0_level2_quad_clean.evt |
| Size (bytes) | 307,051,200 | 87,431,040 |
| Size | 292.8 MB | 83.4 MB |
| Events in quadrant A | 2,675,719 | 594,622 |
| Events in quadrant B | 2,574,559 | 598,278 |
| Events in quadrant C | 2,440,442 | 574,870 |
| Events in quadrant D | 3,280,320 | 524,728 |
| Mode SS | |||
|---|---|---|---|
| Quadrant | BADHDUFLAG | Total packets | Discarded packets |
| A | 0 | 102 | 0 |
| B | 0 | 102 | 0 |
| C | 0 | 102 | 0 |
| D | 0 | 102 | 0 |
| Mode M9 | |||
|---|---|---|---|
| Quadrant | BADHDUFLAG | Total packets | Discarded packets |
| A | 0 | 28 | 0 |
| B | 0 | 28 | 0 |
| C | 0 | 28 | 0 |
| D | 0 | 29 | 0 |
| Mode M0 | |||
|---|---|---|---|
| Quadrant | BADHDUFLAG | Total packets | Discarded packets |
| A | 0 | 11063 | 3 |
| B | 0 | 10958 | 2 |
| C | 0 | 10341 | 2 |
| D | 0 | 13192 | 2 |
| Quadrant | Total seconds | Saturated seconds | Saturation percentage |
|---|---|---|---|
| A | 5068 | 13 | 0.256511% |
| B | 5068 | 31 | 0.611681% |
| C | 5068 | 15 | 0.295975% |
| D | 5068 | 117 | 2.308603% |
Noise dominated data is calculated using 1-second bins in cleaned event files. If a bin has >2000 counts, and if more than 50% of those come from <1% of pixels, then it is considered to be noise-dominated and hence unusable.
| Quadrant | # 1 sec bins | Bins with >0 counts | Bins with >2000 counts | High rate bins dominated by noise | Noise dominated (total time) | Noise dominated (detector-on time) | Marked lightcurve |
|---|---|---|---|---|---|---|---|
| A | 7012 | 5069 | 5 | 5 | 0.07% | 0.10% | 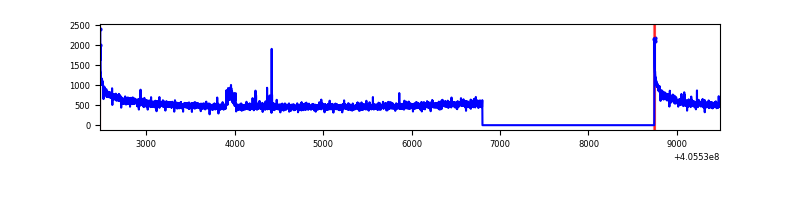 |
| B | 7012 | 5069 | 9 | 9 | 0.13% | 0.18% | 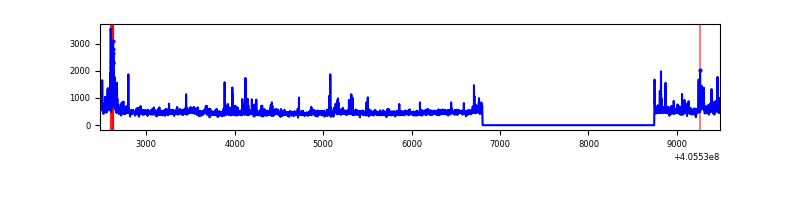 |
| C | 7012 | 5069 | 9 | 9 | 0.13% | 0.18% | 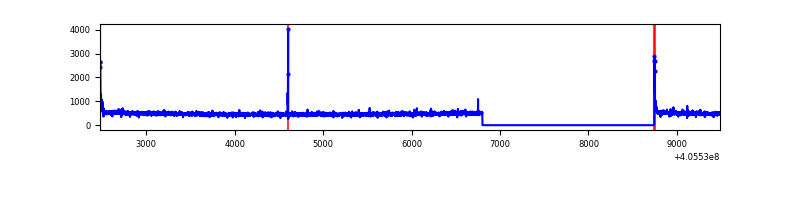 |
| D | 7012 | 5069 | 93 | 93 | 1.33% | 1.83% | 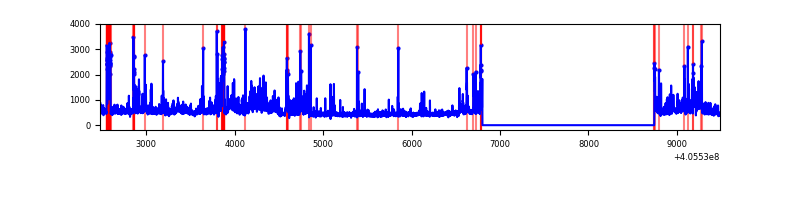 |
Top three noisy pixels from each quadrant. If the there are fewer than three noisy pixels in the level2.evt file, extra rows are filled as -1
| Pixel properties | Quadrant properties | ||||||
|---|---|---|---|---|---|---|---|
| Quadrant | DetID | PixID | Counts | Sigma | Mean | Median | Sigma |
| A | 10 | 83 | 394557 | 3443.33 | 567 | 556 | 114.4 |
| A | 6 | 10 | 30497 | 261.67 | 567 | 556 | 114.4 |
| A | 15 | 223 | 25039 | 213.97 | 567 | 556 | 114.4 |
| B | 0 | 183 | 96776 | 894.63 | 564 | 548 | 107.6 |
| B | 5 | 184 | 85069 | 785.79 | 564 | 548 | 107.6 |
| B | 0 | 189 | 67747 | 624.75 | 564 | 548 | 107.6 |
| C | 15 | 214 | 214068 | 1668.39 | 556 | 559 | 128.0 |
| C | 0 | 10 | 38130 | 293.59 | 556 | 559 | 128.0 |
| C | 1 | 23 | 11070 | 82.13 | 556 | 559 | 128.0 |
| D | 2 | 16 | 282968 | 2095.1 | 554 | 540 | 134.8 |
| D | 2 | 249 | 281634 | 2085.2 | 554 | 540 | 134.8 |
| D | 12 | 235 | 123160 | 909.62 | 554 | 540 | 134.8 |
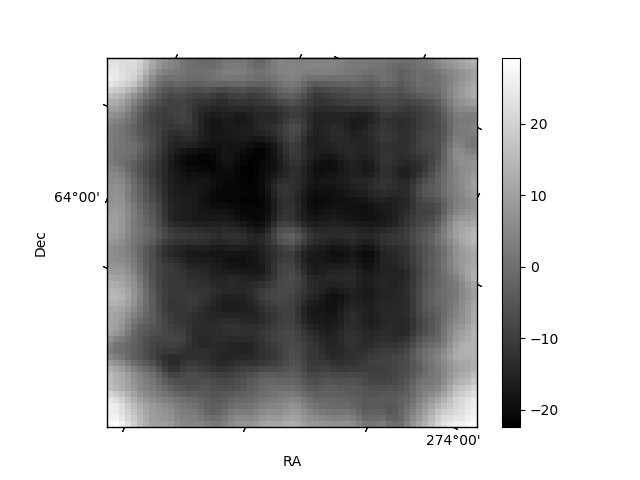
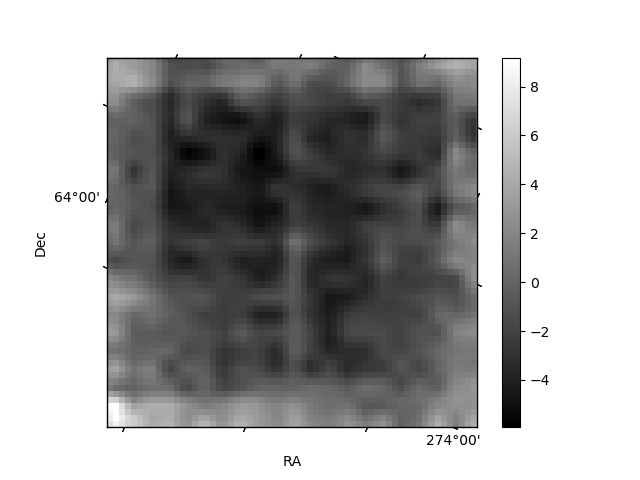
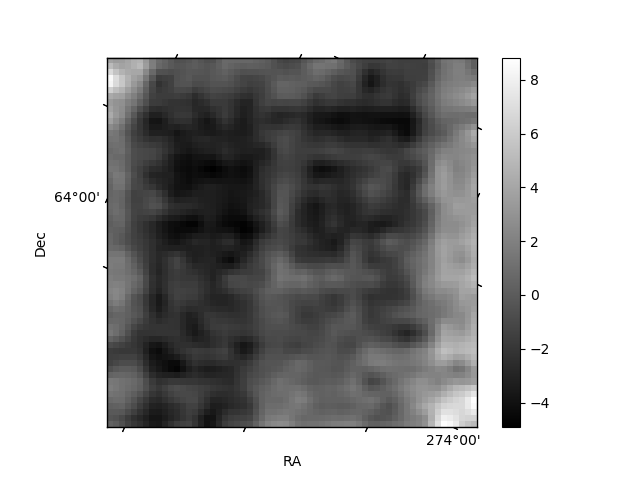
Histogram calculated using DETX and DETY for each event in the final _common_clean file
| Quadrant A | 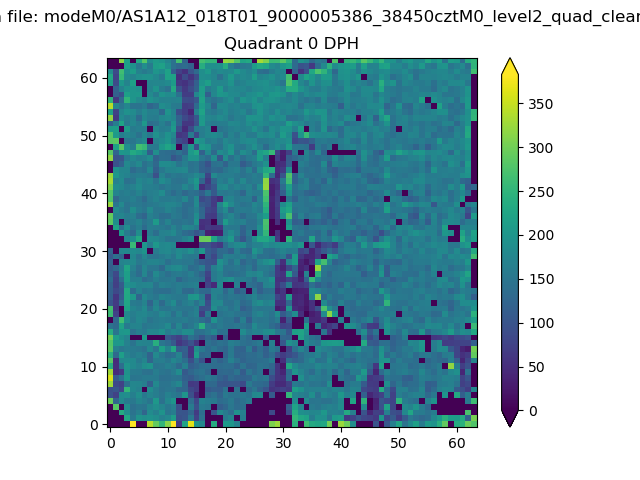 |
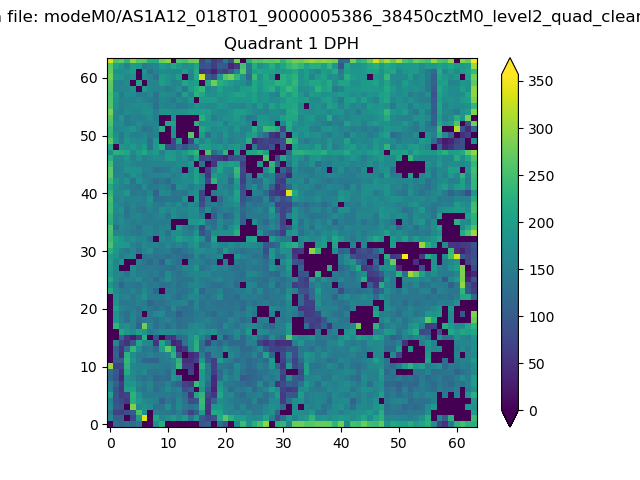 |
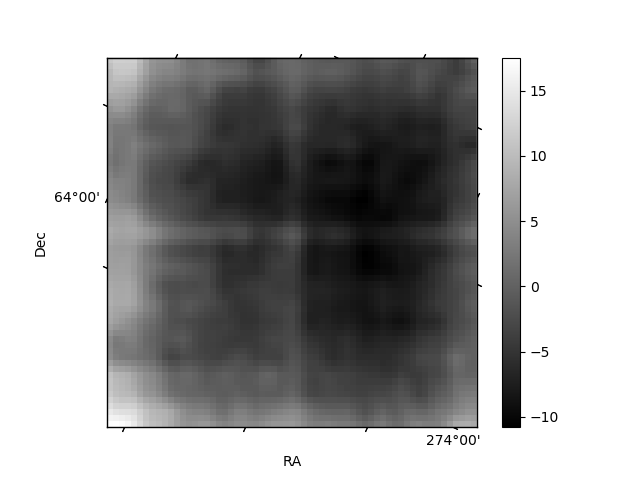
Quadrant B |
|---|---|---|---|
| Quadrant D | 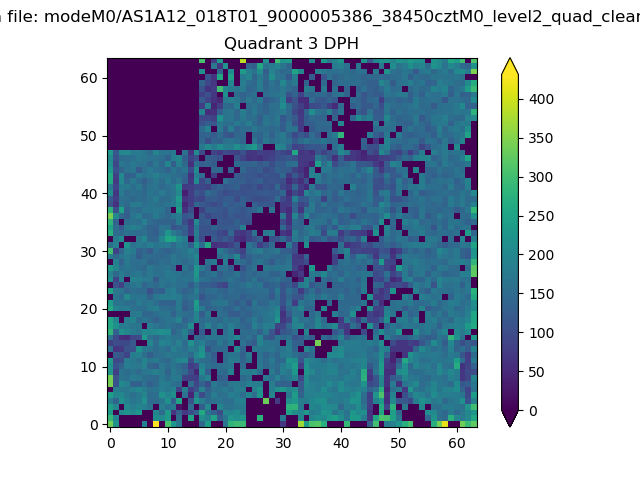 |
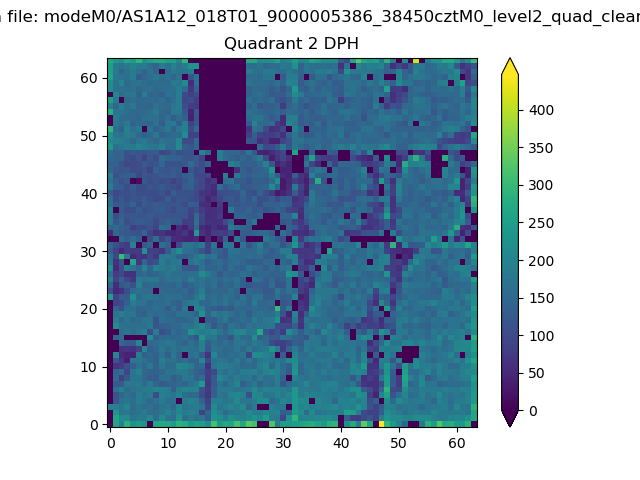 |
Quadrant C |
| Plot type | Count rate plots | Images |
|---|---|---|
| Comparison with Poisson distribution Blue bars denote a histogram of data divided into 1 sec bins. Red curve is a Poisson curve with rate = median count rate of data. |
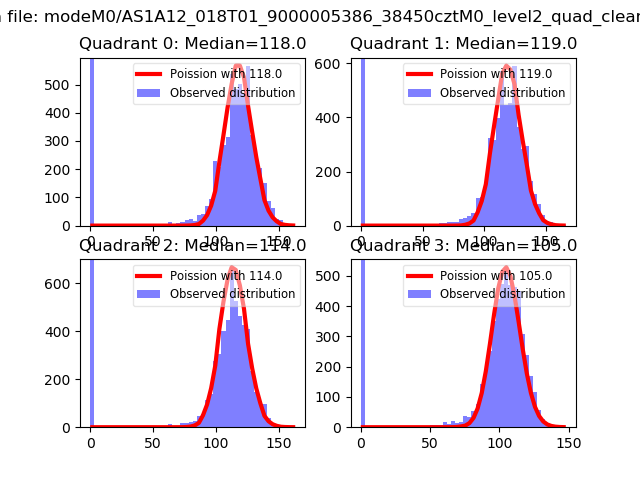 |
 |
| Quadrant-wise count rates Data is divided into 100 sec bins |
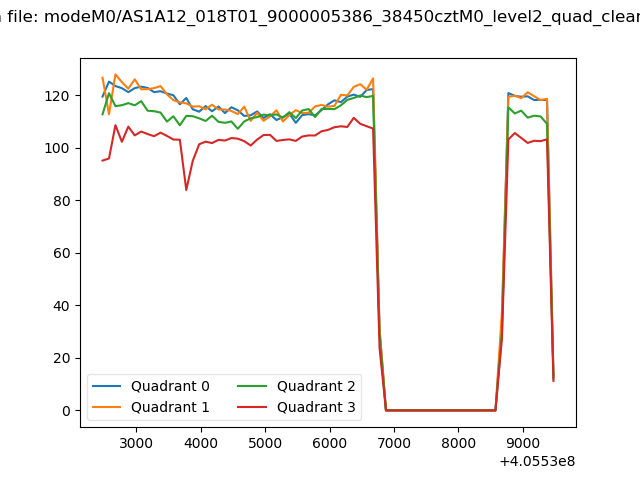 |
|
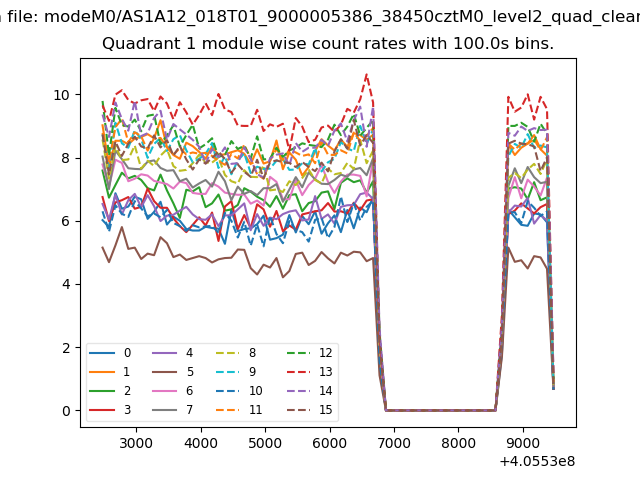
| Module-wise count rates for Quadrant A Data is divided into 100 sec bins |
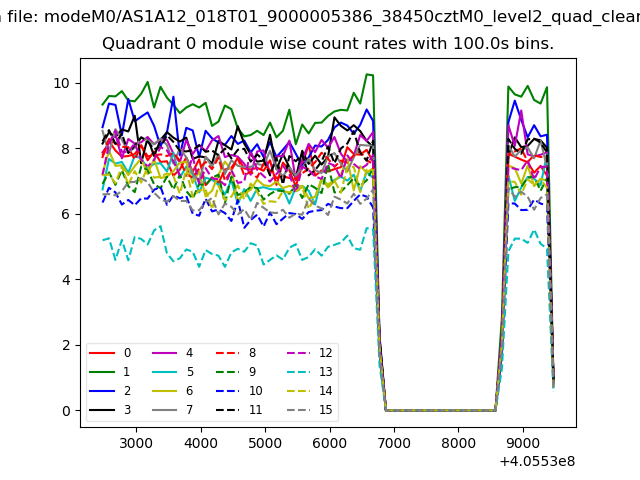 |
 |
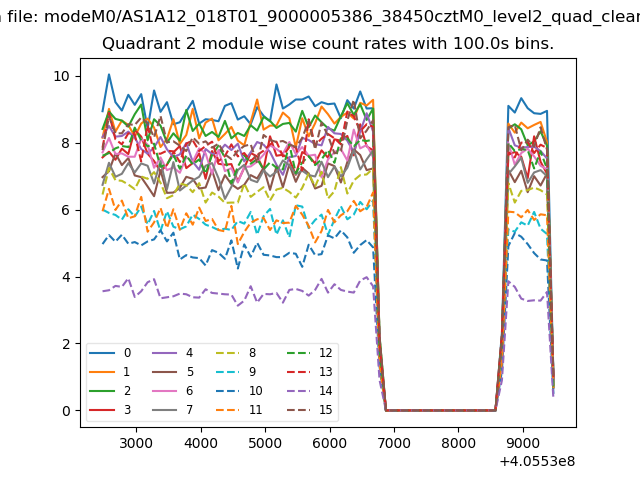
| Module-wise count rates for Quadrant B Data is divided into 100 sec bins |
 |
 |
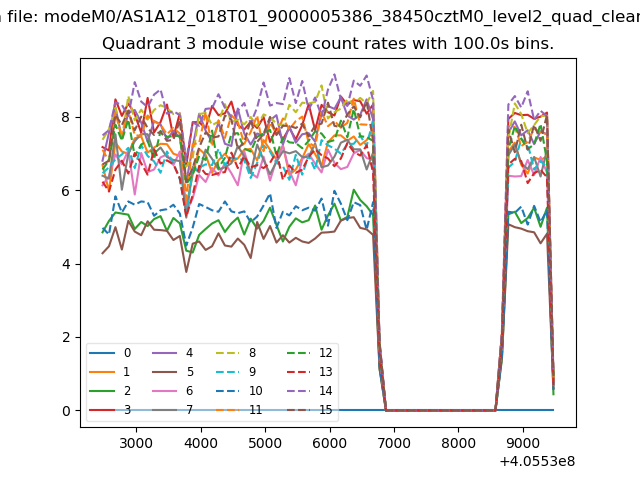
| Module-wise count rates for Quadrant C Data is divided into 100 sec bins |
 |
 |
| Module-wise count rates for Quadrant D Data is divided into 100 sec bins |
 |
 |
| Parameter | Plot |
|---|---|
| CZT HV Monitor | 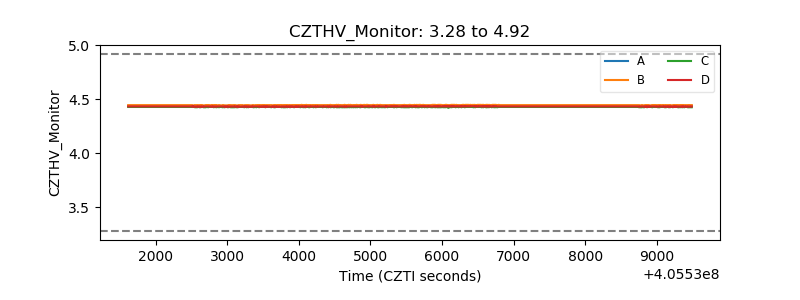 |
| D_VDD | 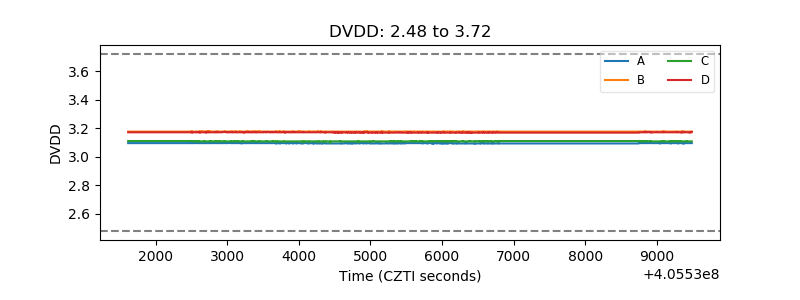 |
| Temperature 1 | 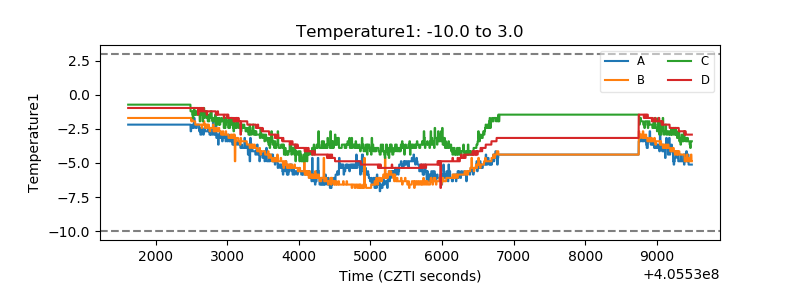 |
| Veto HV Monitor | 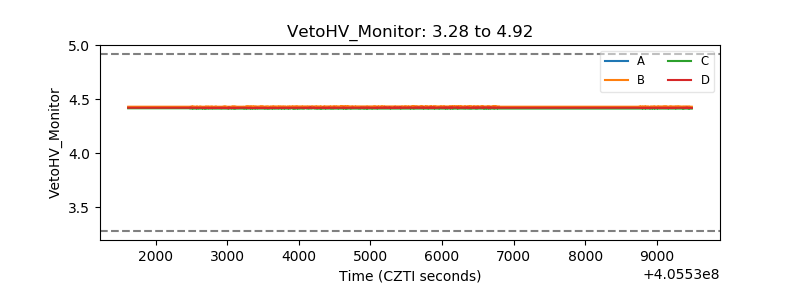 |
| Veto LLD | 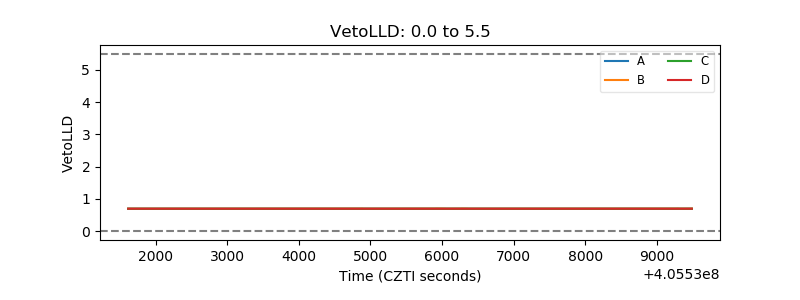 |
| Alpha Counter | 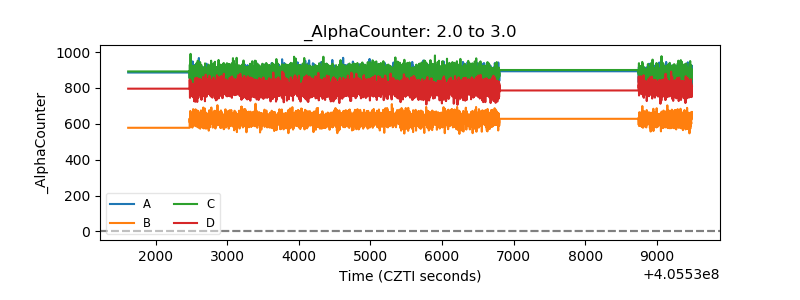 |
| _CPM_Rate | 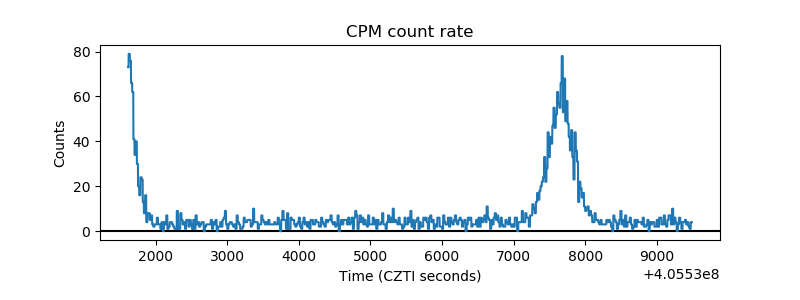 |
| CZT Counter | 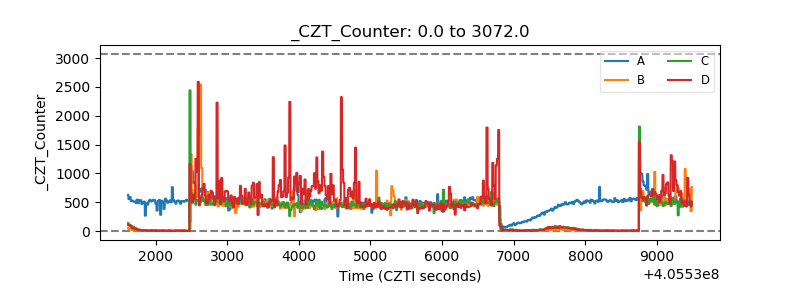 |
| +2.5 Volts monitor | 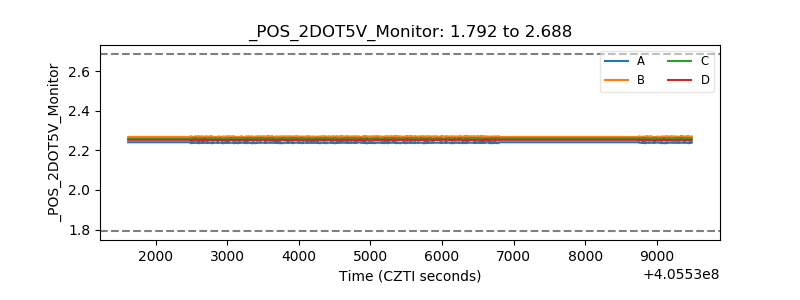 |
| +5 Volts monitor | 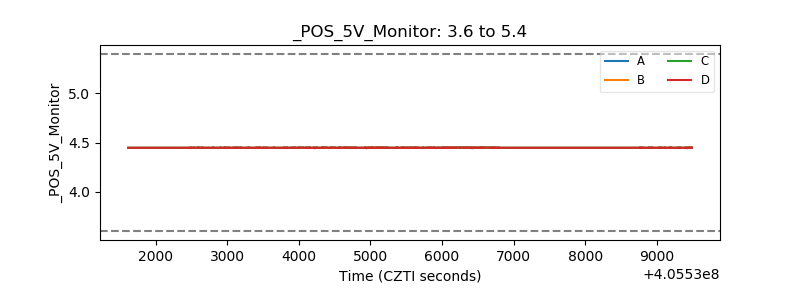 |
| _ROLL_ROT | 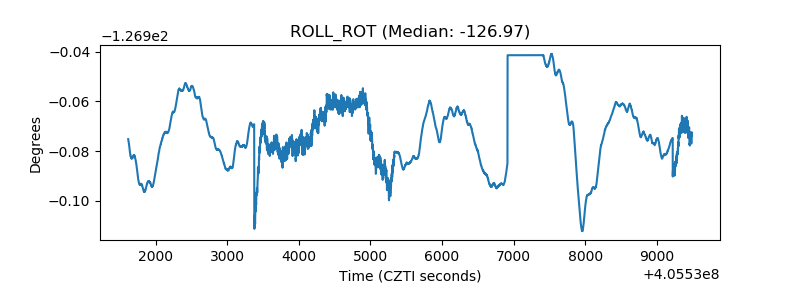 |
| _Roll_DEC | 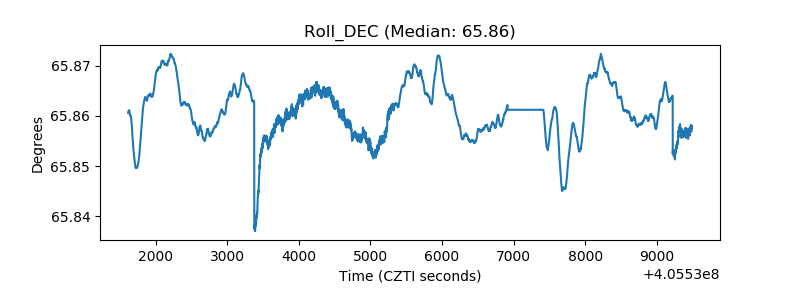 |
| _Roll_RA | 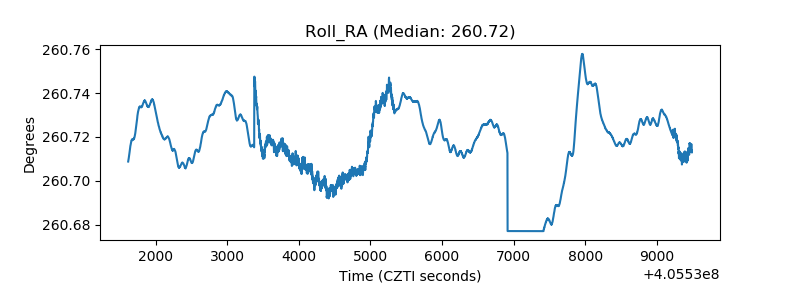 |
| Veto Counter | 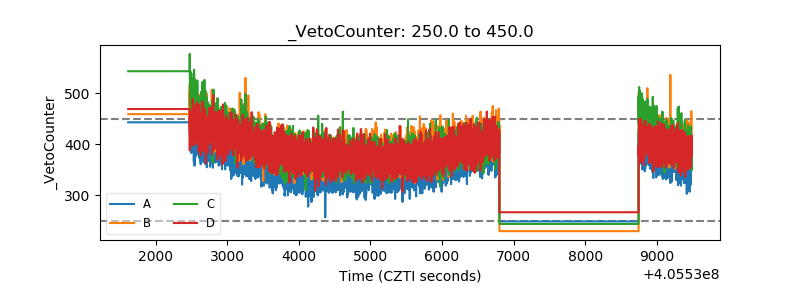 |