| Param | Original file | Final file |
|---|---|---|
| Filename | modeM0/AS1A12_018T01_9000005386_38451cztM0_level2.fits | modeM0/AS1A12_018T01_9000005386_38451cztM0_level2_quad_clean.evt |
| Size (bytes) | 360,864,000 | 90,097,920 |
| Size | 344.1 MB | 85.9 MB |
| Events in quadrant A | 3,048,581 | 613,210 |
| Events in quadrant B | 3,762,382 | 582,926 |
| Events in quadrant C | 2,692,559 | 601,008 |
| Events in quadrant D | 3,431,534 | 550,829 |
| Mode SS | |||
|---|---|---|---|
| Quadrant | BADHDUFLAG | Total packets | Discarded packets |
| A | 0 | 110 | 0 |
| B | 0 | 110 | 0 |
| C | 0 | 110 | 0 |
| D | 0 | 110 | 0 |
| Mode M9 | |||
|---|---|---|---|
| Quadrant | BADHDUFLAG | Total packets | Discarded packets |
| A | 0 | 29 | 0 |
| B | 0 | 29 | 0 |
| C | 0 | 29 | 0 |
| D | 0 | 30 | 0 |
| Mode M0 | |||
|---|---|---|---|
| Quadrant | BADHDUFLAG | Total packets | Discarded packets |
| A | 0 | 12369 | 3 |
| B | 0 | 14777 | 2 |
| C | 0 | 11385 | 2 |
| D | 0 | 13938 | 2 |
| Quadrant | Total seconds | Saturated seconds | Saturation percentage |
|---|---|---|---|
| A | 5431 | 76 | 1.399374% |
| B | 5431 | 473 | 8.709262% |
| C | 5431 | 20 | 0.368256% |
| D | 5431 | 128 | 2.356840% |
Noise dominated data is calculated using 1-second bins in cleaned event files. If a bin has >2000 counts, and if more than 50% of those come from <1% of pixels, then it is considered to be noise-dominated and hence unusable.
| Quadrant | # 1 sec bins | Bins with >0 counts | Bins with >2000 counts | High rate bins dominated by noise | Noise dominated (total time) | Noise dominated (detector-on time) | Marked lightcurve |
|---|---|---|---|---|---|---|---|
| A | 7043 | 5432 | 58 | 58 | 0.82% | 1.07% | 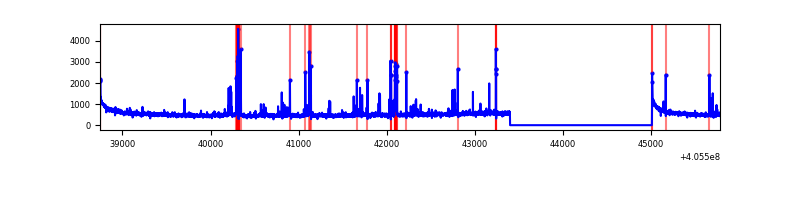 |
| B | 7043 | 5432 | 311 | 311 | 4.42% | 5.73% | 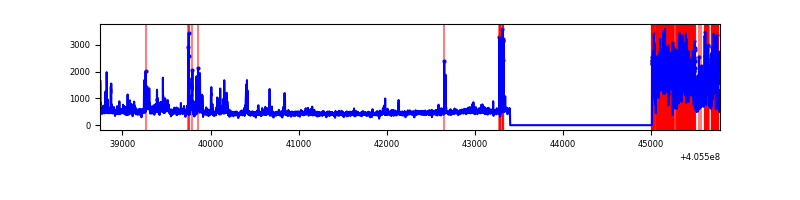 |
| C | 7043 | 5432 | 12 | 12 | 0.17% | 0.22% | 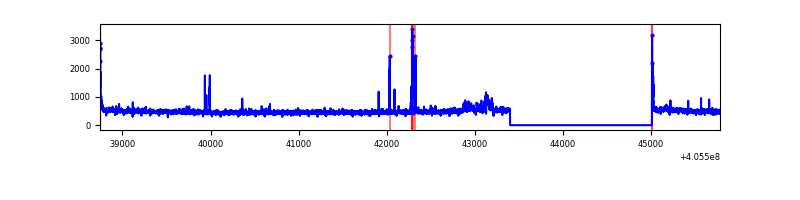 |
| D | 7043 | 5432 | 102 | 102 | 1.45% | 1.88% | 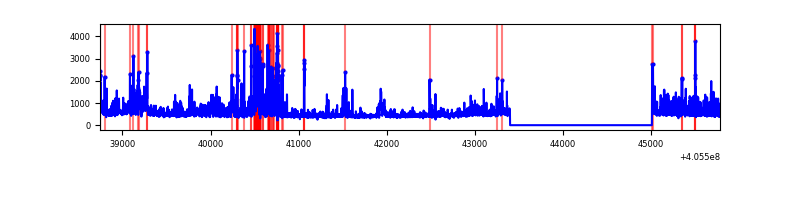 |
Top three noisy pixels from each quadrant. If the there are fewer than three noisy pixels in the level2.evt file, extra rows are filled as -1
| Pixel properties | Quadrant properties | ||||||
|---|---|---|---|---|---|---|---|
| Quadrant | DetID | PixID | Counts | Sigma | Mean | Median | Sigma |
| A | 10 | 83 | 396360 | 3228.83 | 600 | 585 | 122.6 |
| A | 9 | 143 | 245923 | 2001.53 | 600 | 585 | 122.6 |
| A | 15 | 223 | 44133 | 355.27 | 600 | 585 | 122.6 |
| B | 5 | 184 | 1181091 | 10520.44 | 585 | 569 | 112.2 |
| B | 0 | 183 | 88499 | 783.6 | 585 | 569 | 112.2 |
| B | 4 | 232 | 75578 | 668.46 | 585 | 569 | 112.2 |
| C | 15 | 214 | 228937 | 1660.42 | 591 | 595 | 137.5 |
| C | 3 | 233 | 70547 | 508.67 | 591 | 595 | 137.5 |
| C | 0 | 10 | 35017 | 250.3 | 591 | 595 | 137.5 |
| D | 12 | 235 | 227136 | 1588.95 | 587 | 570 | 142.6 |
| D | 13 | 249 | 223155 | 1561.03 | 587 | 570 | 142.6 |
| D | 2 | 153 | 200230 | 1400.25 | 587 | 570 | 142.6 |
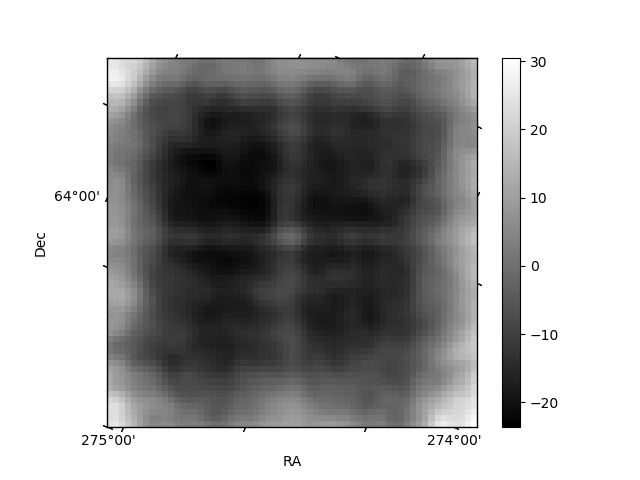
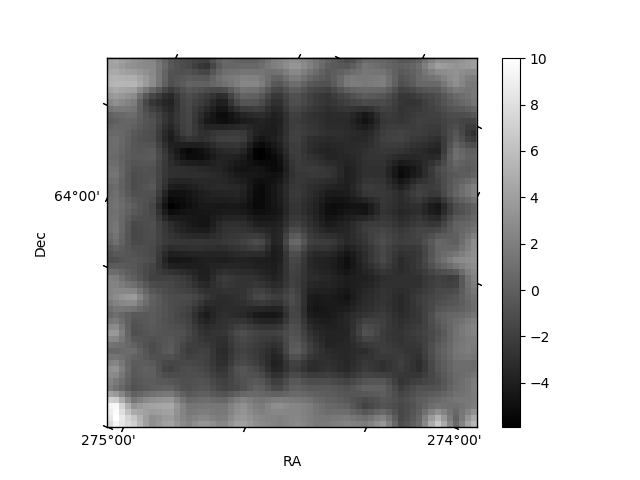
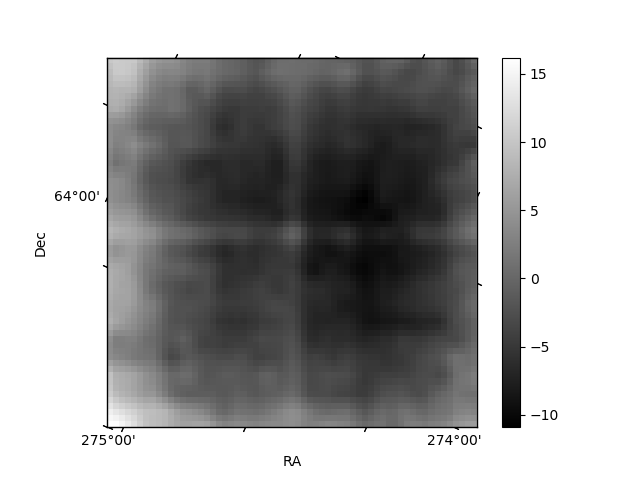
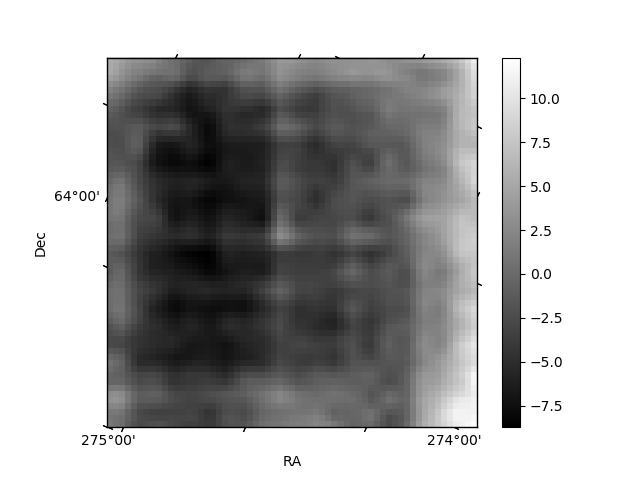
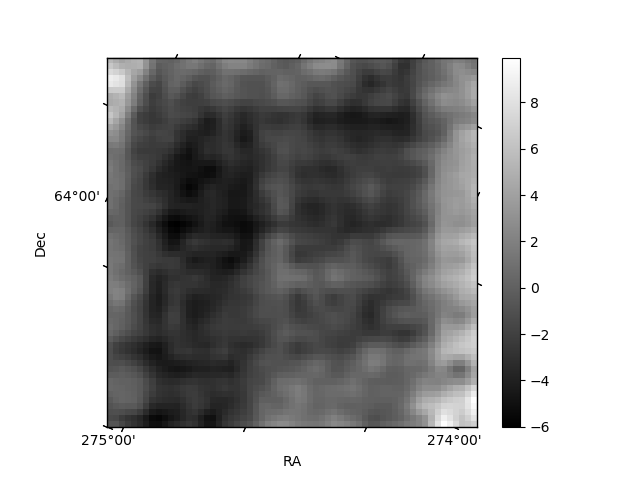
Histogram calculated using DETX and DETY for each event in the final _common_clean file
| Quadrant A | 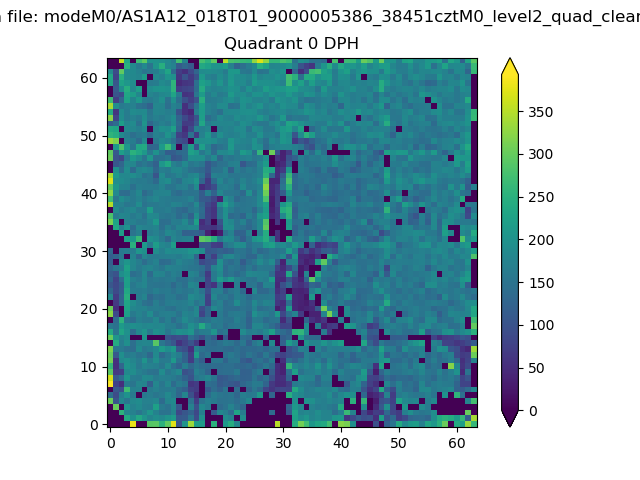 |
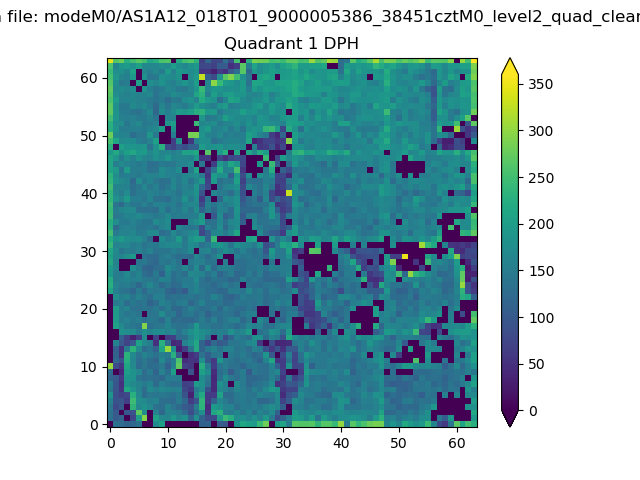 |
Quadrant B |
|---|---|---|---|
| Quadrant D | 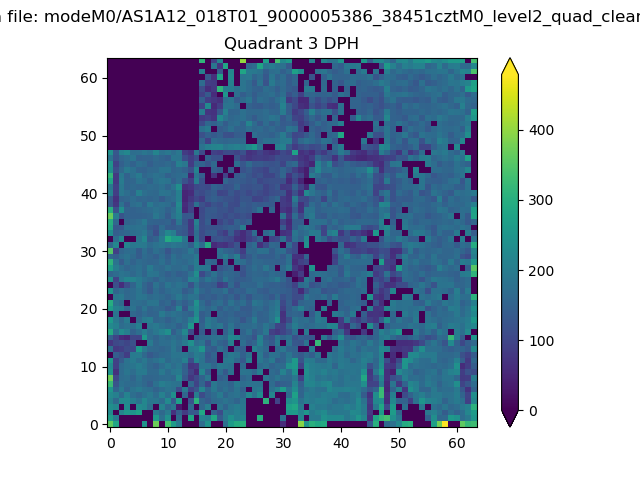 |
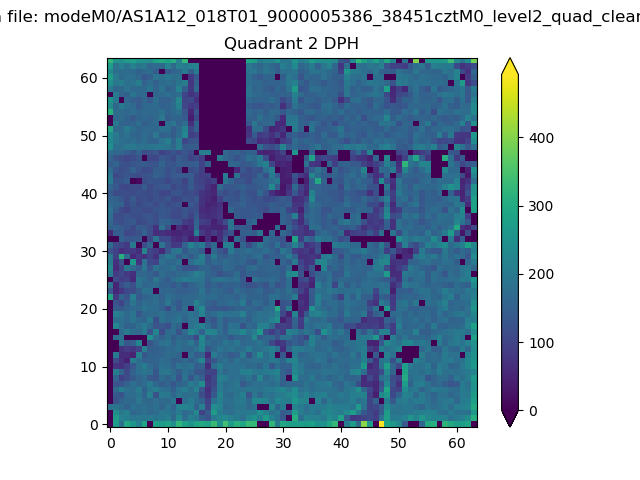 |
Quadrant C |
| Plot type | Count rate plots | Images |
|---|---|---|
| Comparison with Poisson distribution Blue bars denote a histogram of data divided into 1 sec bins. Red curve is a Poisson curve with rate = median count rate of data. |
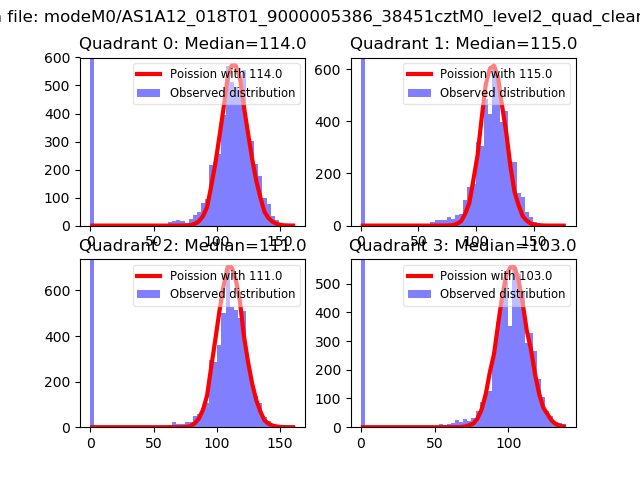 |
 |
| Quadrant-wise count rates Data is divided into 100 sec bins |
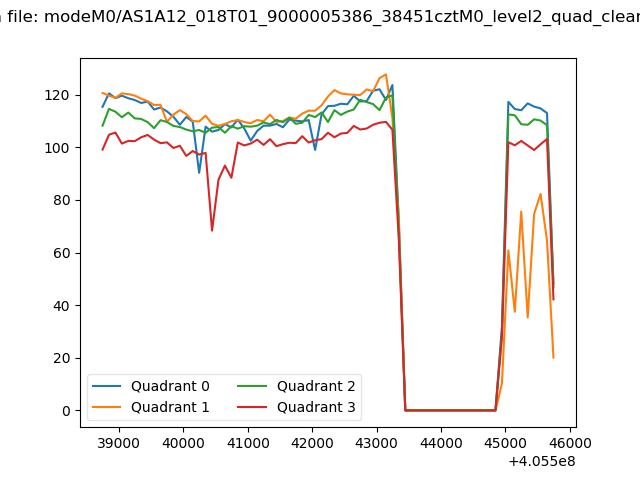 |
|
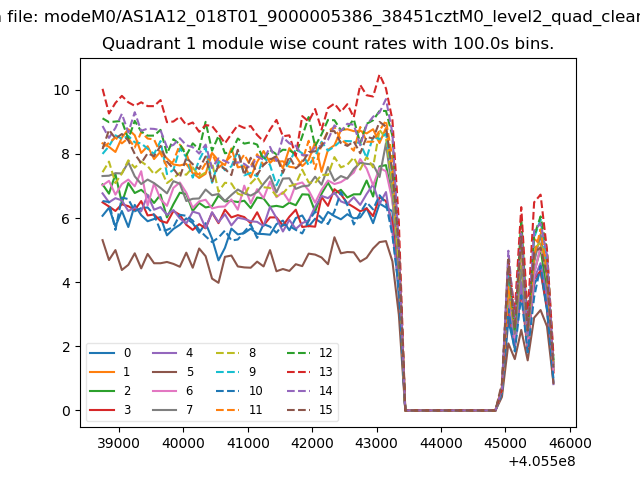
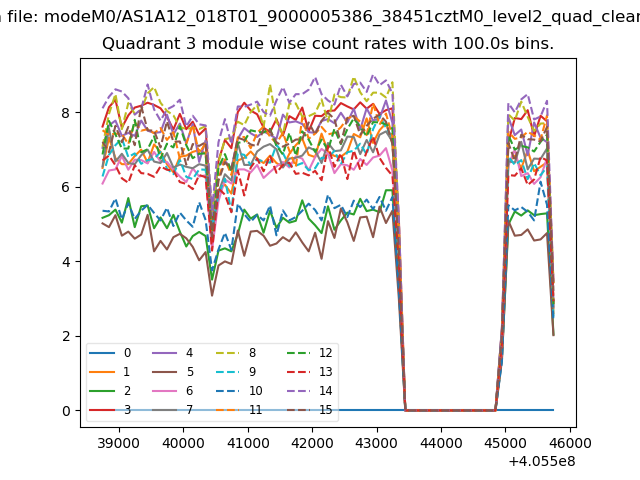
| Module-wise count rates for Quadrant A Data is divided into 100 sec bins |
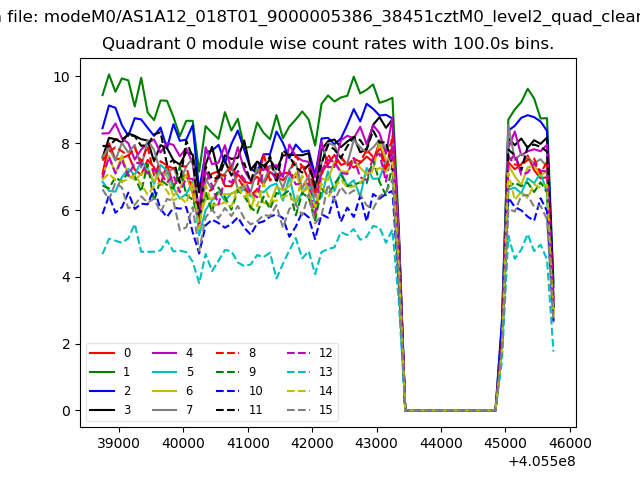 |
 |
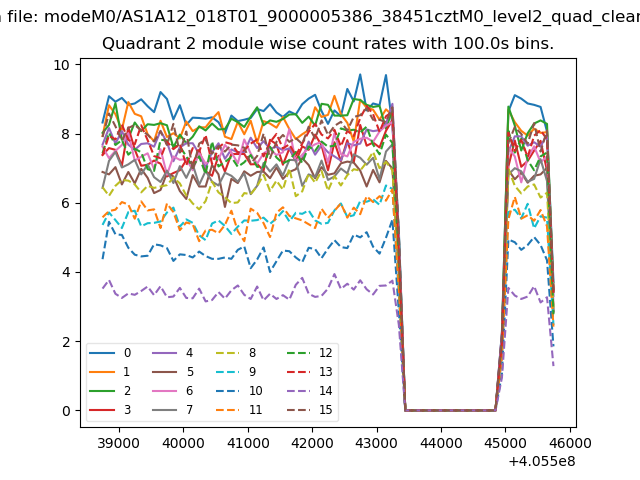
| Module-wise count rates for Quadrant B Data is divided into 100 sec bins |
 |
 |
| Module-wise count rates for Quadrant C Data is divided into 100 sec bins |
 |
 |
| Module-wise count rates for Quadrant D Data is divided into 100 sec bins |
 |
 |
| Parameter | Plot |
|---|---|
| CZT HV Monitor | 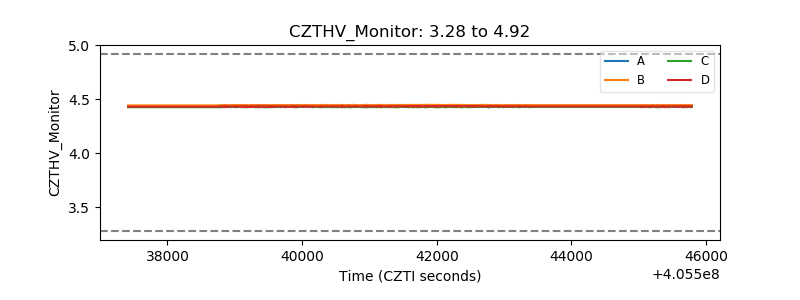 |
| D_VDD | 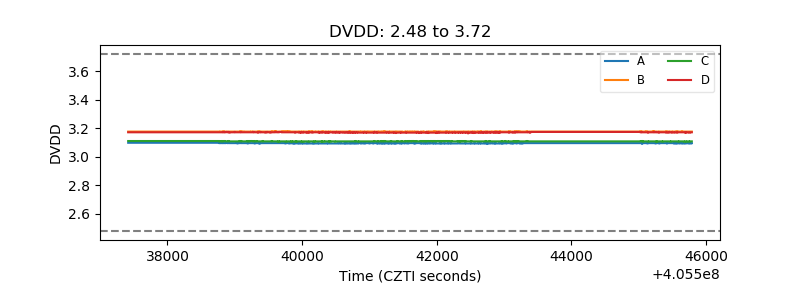 |
| Temperature 1 | 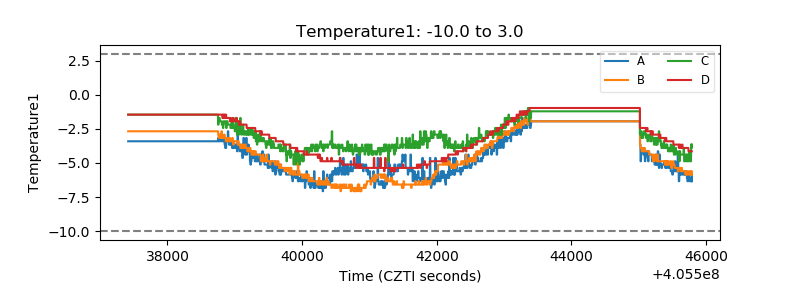 |
| Veto HV Monitor | 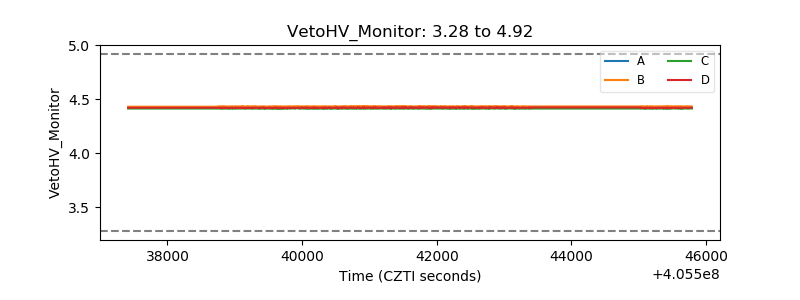 |
| Veto LLD | 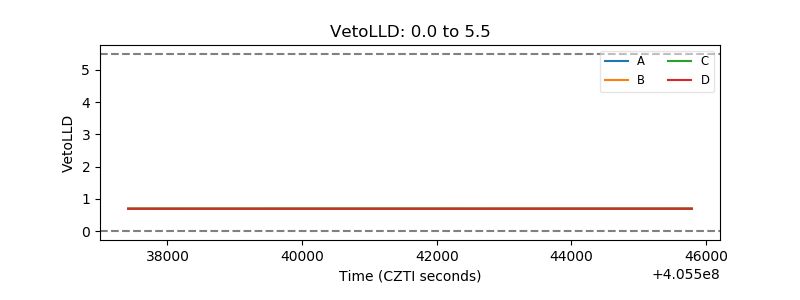 |
| Alpha Counter | 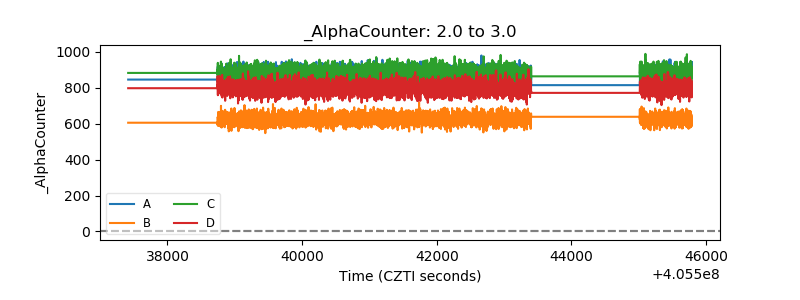 |
| _CPM_Rate | 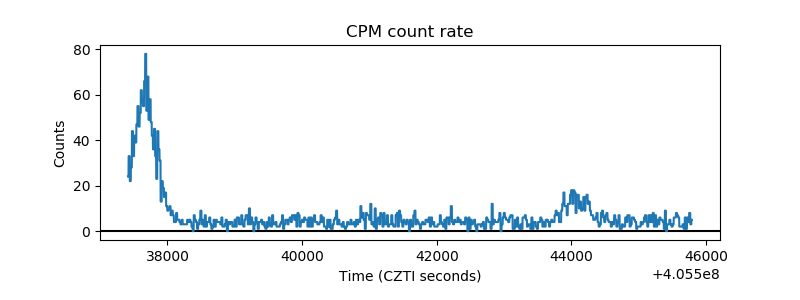 |
| CZT Counter | 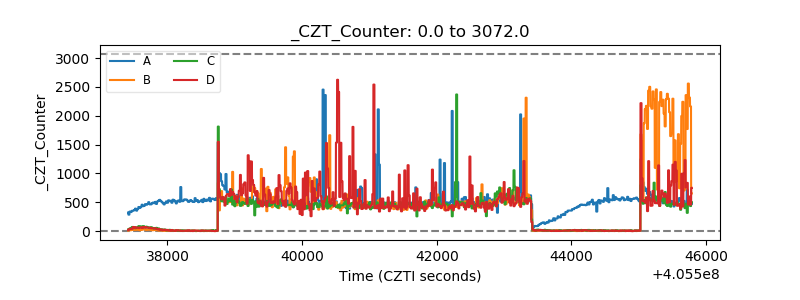 |
| +2.5 Volts monitor | 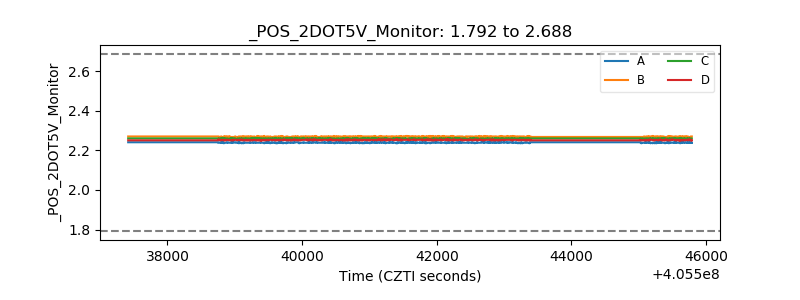 |
| +5 Volts monitor | 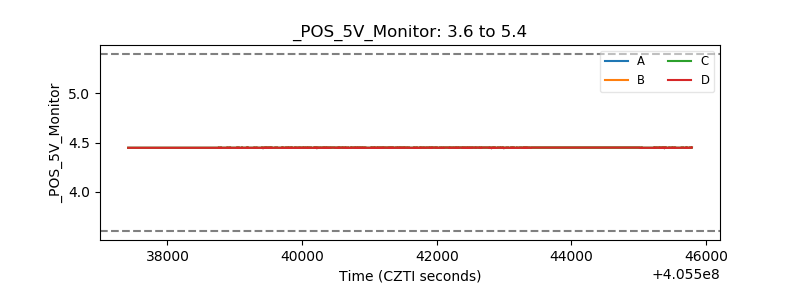 |
| _ROLL_ROT | 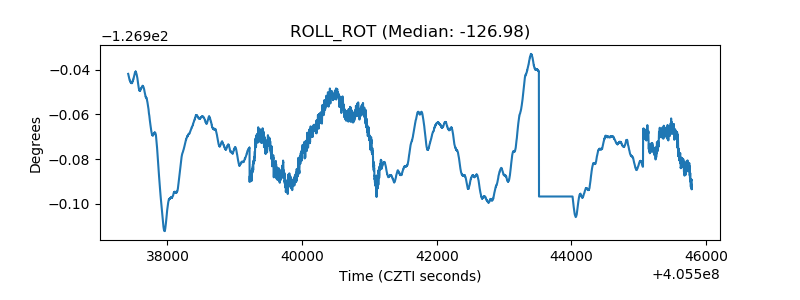 |
| _Roll_DEC | 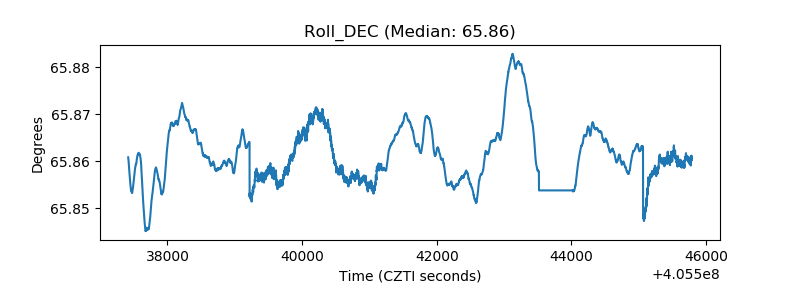 |
| _Roll_RA | 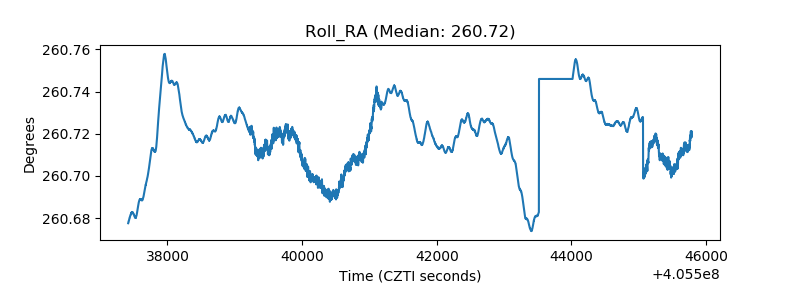 |
| Veto Counter | 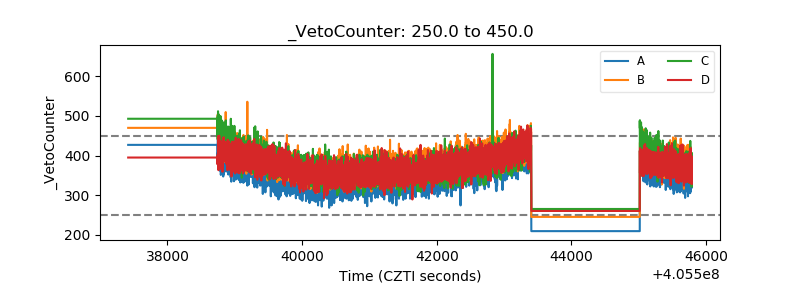 |