| Param | Original file | Final file |
|---|---|---|
| Filename | modeM0/AS1A12_018T01_9000005386_38452cztM0_level2.fits | modeM0/AS1A12_018T01_9000005386_38452cztM0_level2_quad_clean.evt |
| Size (bytes) | 393,471,360 | 95,209,920 |
| Size | 375.2 MB | 90.8 MB |
| Events in quadrant A | 3,150,872 | 649,220 |
| Events in quadrant B | 4,032,578 | 614,245 |
| Events in quadrant C | 2,782,987 | 634,382 |
| Events in quadrant D | 4,147,399 | 579,733 |
| Mode SS | |||
|---|---|---|---|
| Quadrant | BADHDUFLAG | Total packets | Discarded packets |
| A | 0 | 118 | 0 |
| B | 0 | 118 | 0 |
| C | 0 | 118 | 0 |
| D | 0 | 118 | 0 |
| Mode M9 | |||
|---|---|---|---|
| Quadrant | BADHDUFLAG | Total packets | Discarded packets |
| A | 0 | 23 | 0 |
| B | 0 | 23 | 0 |
| C | 0 | 23 | 0 |
| D | 0 | 24 | 0 |
| Mode M0 | |||
|---|---|---|---|
| Quadrant | BADHDUFLAG | Total packets | Discarded packets |
| A | 0 | 12962 | 3 |
| B | 0 | 15979 | 2 |
| C | 0 | 11840 | 2 |
| D | 0 | 16355 | 2 |
| Quadrant | Total seconds | Saturated seconds | Saturation percentage |
|---|---|---|---|
| A | 5798 | 43 | 0.741635% |
| B | 5798 | 485 | 8.364953% |
| C | 5798 | 16 | 0.275957% |
| D | 5798 | 170 | 2.932046% |
Noise dominated data is calculated using 1-second bins in cleaned event files. If a bin has >2000 counts, and if more than 50% of those come from <1% of pixels, then it is considered to be noise-dominated and hence unusable.
| Quadrant | # 1 sec bins | Bins with >0 counts | Bins with >2000 counts | High rate bins dominated by noise | Noise dominated (total time) | Noise dominated (detector-on time) | Marked lightcurve |
|---|---|---|---|---|---|---|---|
| A | 7140 | 5799 | 26 | 26 | 0.36% | 0.45% | 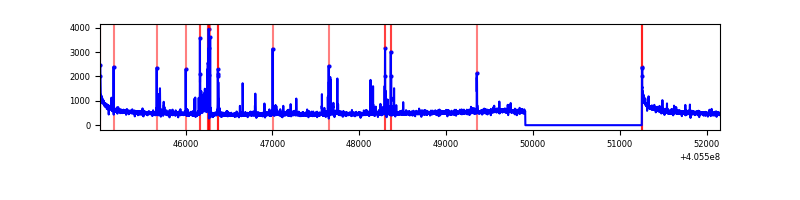 |
| B | 7140 | 5799 | 321 | 321 | 4.50% | 5.54% | 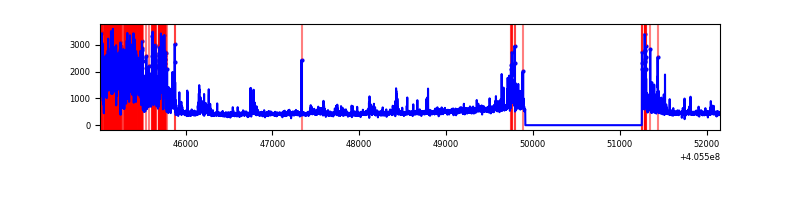 |
| C | 7140 | 5799 | 6 | 6 | 0.08% | 0.10% | 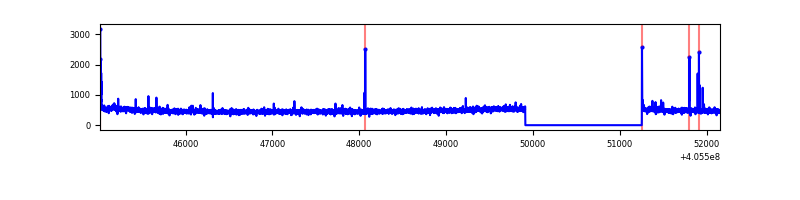 |
| D | 7140 | 5799 | 104 | 104 | 1.46% | 1.79% | 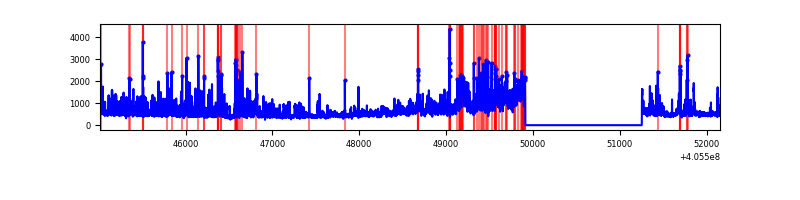 |
Top three noisy pixels from each quadrant. If the there are fewer than three noisy pixels in the level2.evt file, extra rows are filled as -1
| Pixel properties | Quadrant properties | ||||||
|---|---|---|---|---|---|---|---|
| Quadrant | DetID | PixID | Counts | Sigma | Mean | Median | Sigma |
| A | 10 | 83 | 419804 | 3191.61 | 643 | 628 | 131.3 |
| A | 9 | 143 | 195280 | 1482.08 | 643 | 628 | 131.3 |
| A | 12 | 189 | 16295 | 119.29 | 643 | 628 | 131.3 |
| B | 5 | 184 | 1213349 | 10069.32 | 624 | 605 | 120.4 |
| B | 0 | 183 | 216049 | 1788.81 | 624 | 605 | 120.4 |
| B | 0 | 230 | 24547 | 198.79 | 624 | 605 | 120.4 |
| C | 15 | 214 | 243058 | 1622.74 | 632 | 636 | 149.4 |
| C | 14 | 254 | 29972 | 196.37 | 632 | 636 | 149.4 |
| C | 0 | 10 | 23680 | 154.25 | 632 | 636 | 149.4 |
| D | 12 | 235 | 1028798 | 6729.69 | 626 | 607 | 152.8 |
| D | 2 | 249 | 258028 | 1684.87 | 626 | 607 | 152.8 |
| D | 2 | 153 | 189286 | 1234.94 | 626 | 607 | 152.8 |
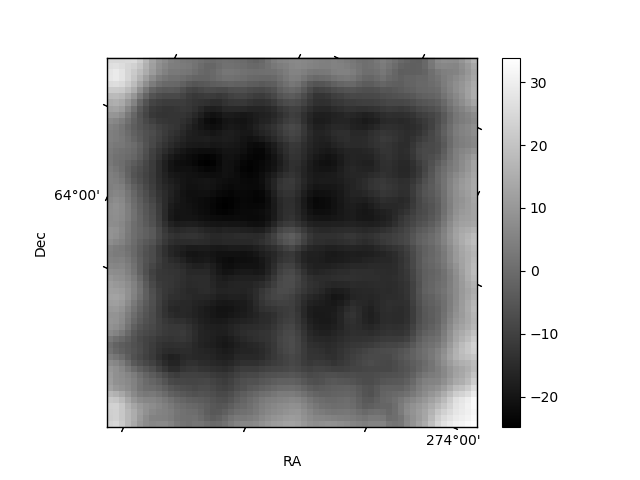
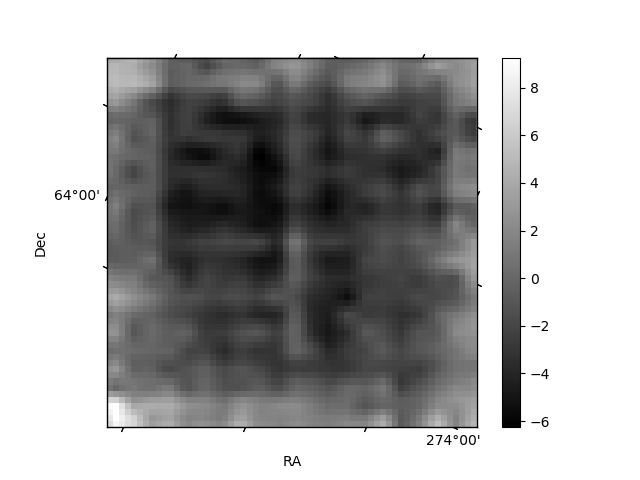
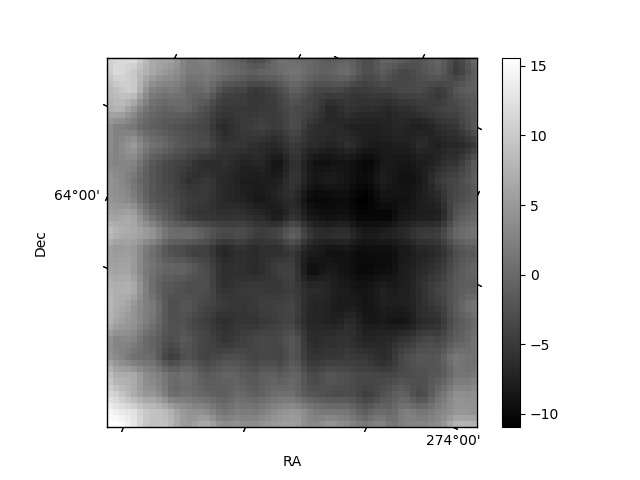
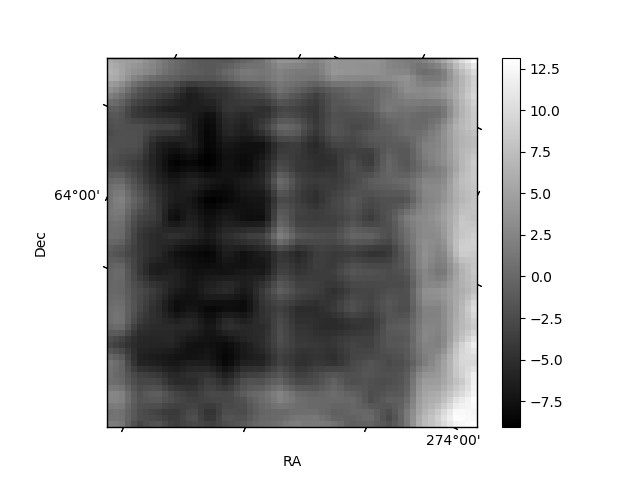
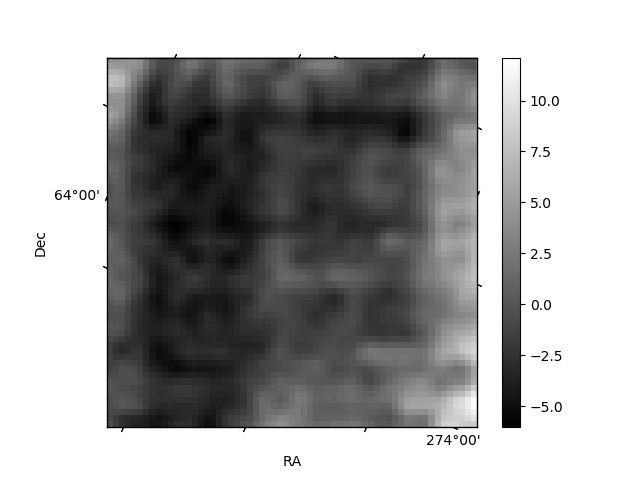
Histogram calculated using DETX and DETY for each event in the final _common_clean file
| Quadrant A | 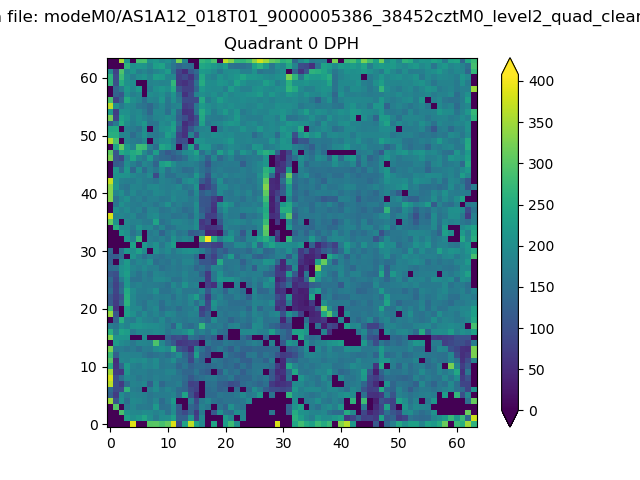 |
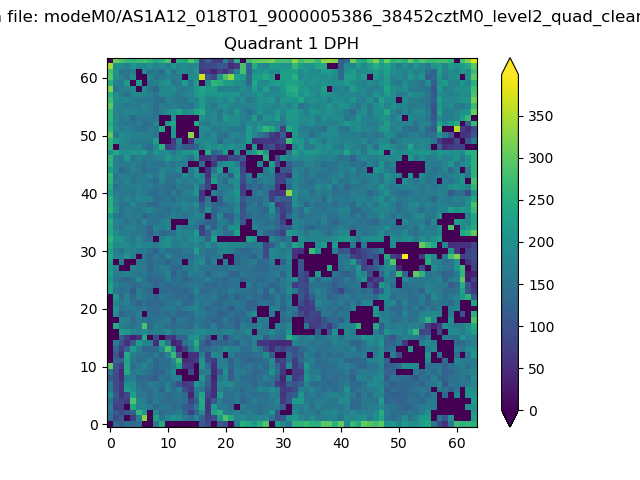 |
Quadrant B |
|---|---|---|---|
| Quadrant D | 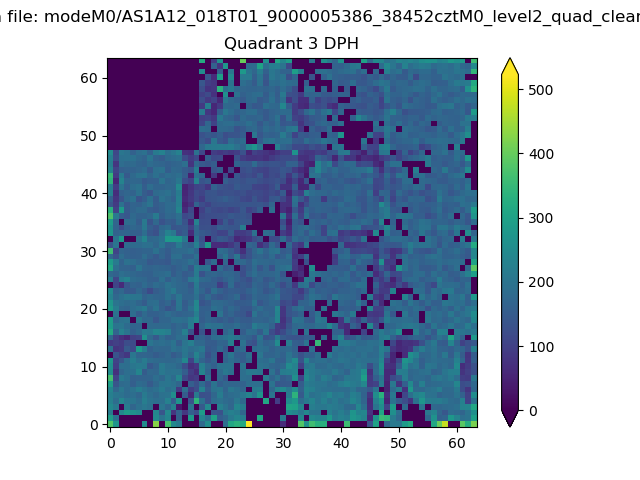 |
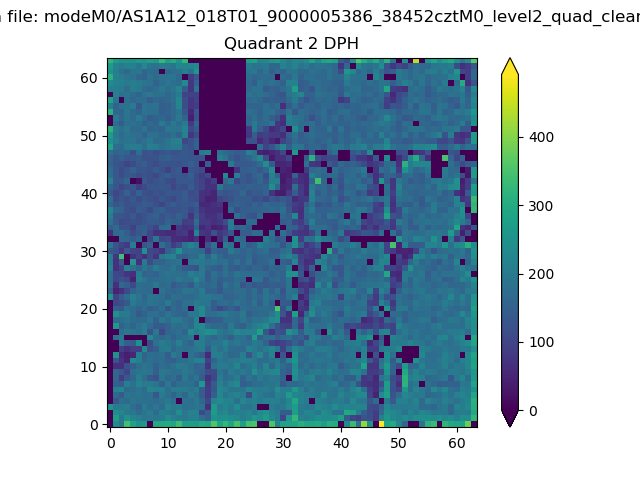 |
Quadrant C |
| Plot type | Count rate plots | Images |
|---|---|---|
| Comparison with Poisson distribution Blue bars denote a histogram of data divided into 1 sec bins. Red curve is a Poisson curve with rate = median count rate of data. |
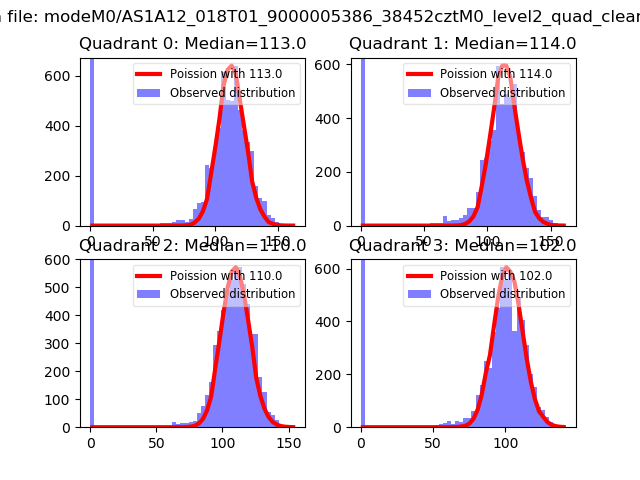 |
 |
| Quadrant-wise count rates Data is divided into 100 sec bins |
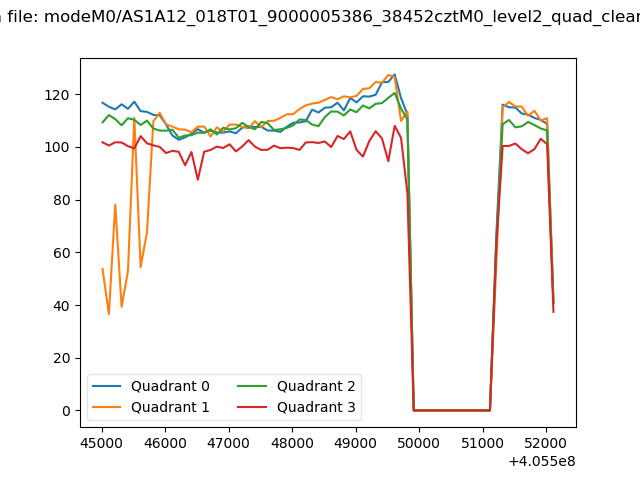 |
|
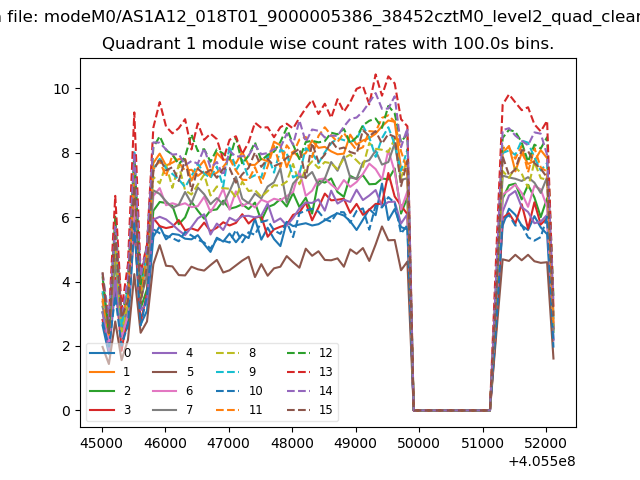
| Module-wise count rates for Quadrant A Data is divided into 100 sec bins |
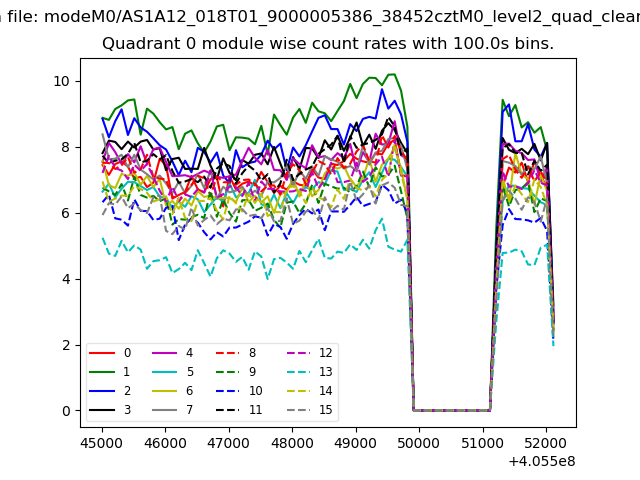 |
 |
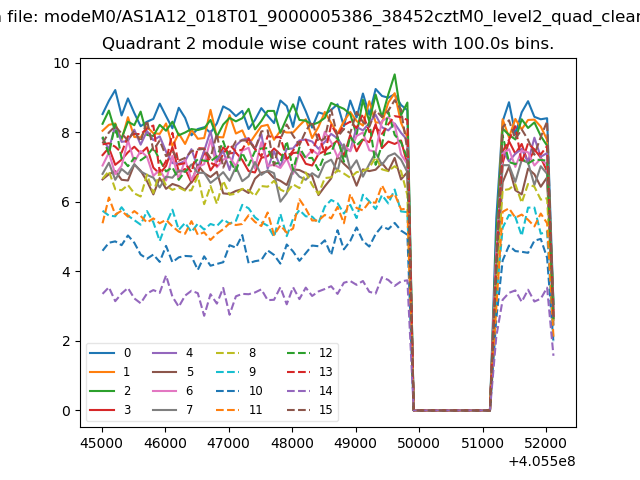
| Module-wise count rates for Quadrant B Data is divided into 100 sec bins |
 |
 |
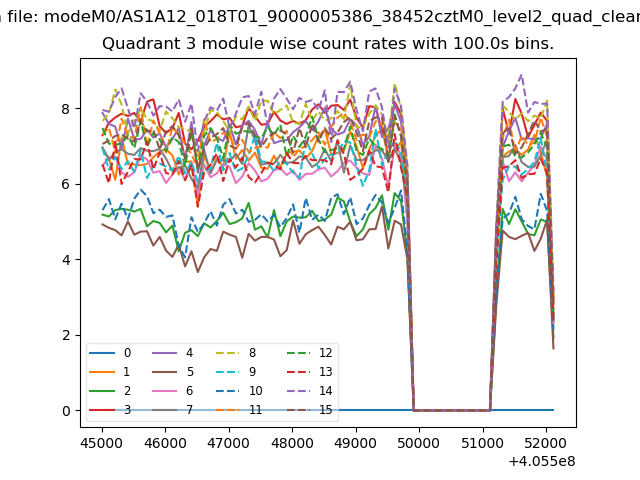
| Module-wise count rates for Quadrant C Data is divided into 100 sec bins |
 |
 |
| Module-wise count rates for Quadrant D Data is divided into 100 sec bins |
 |
 |
| Parameter | Plot |
|---|---|
| CZT HV Monitor | 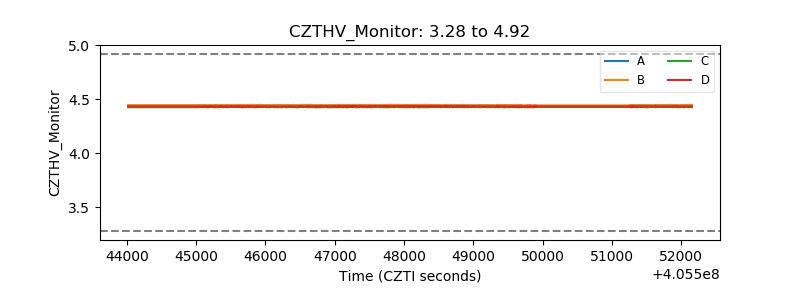 |
| D_VDD | 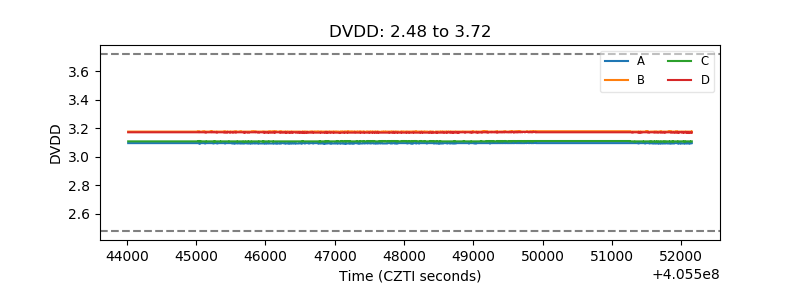 |
| Temperature 1 | 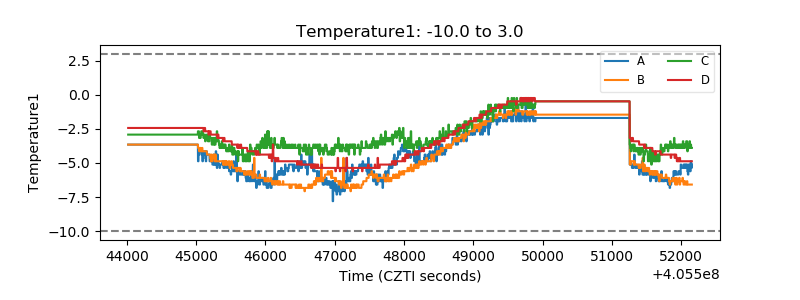 |
| Veto HV Monitor | 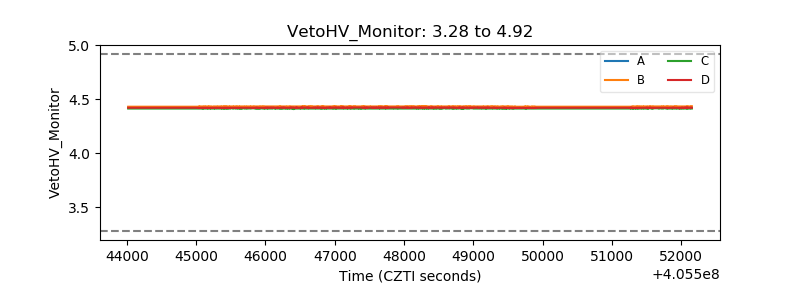 |
| Veto LLD | 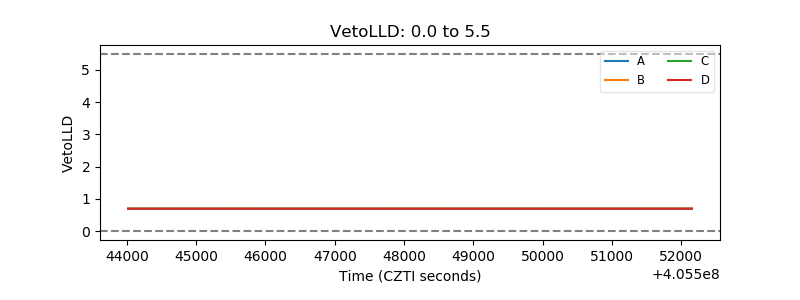 |
| Alpha Counter | 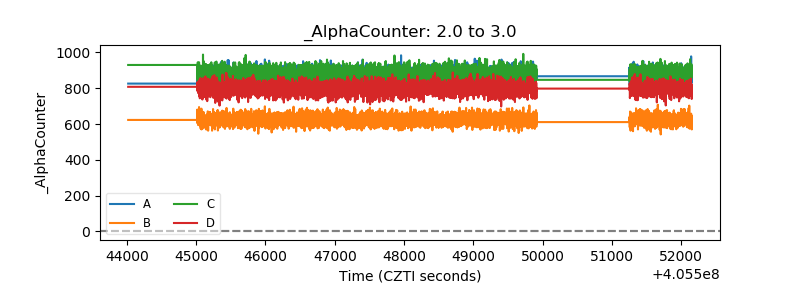 |
| _CPM_Rate | 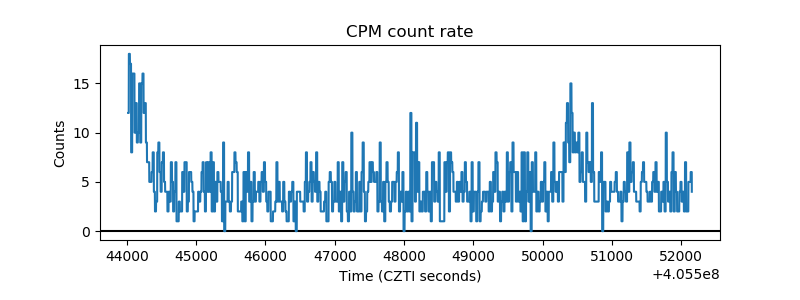 |
| CZT Counter | 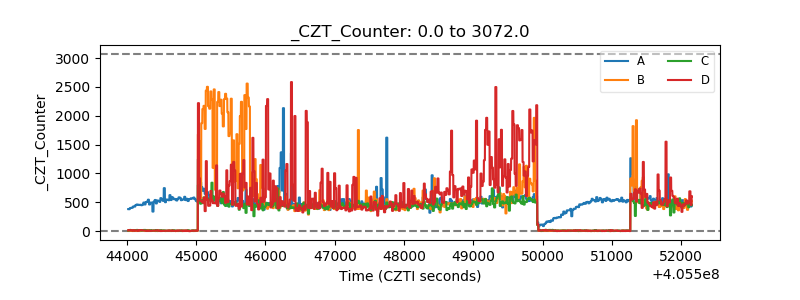 |
| +2.5 Volts monitor | 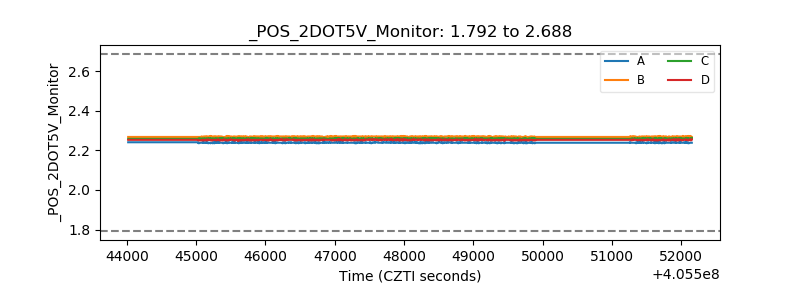 |
| +5 Volts monitor | 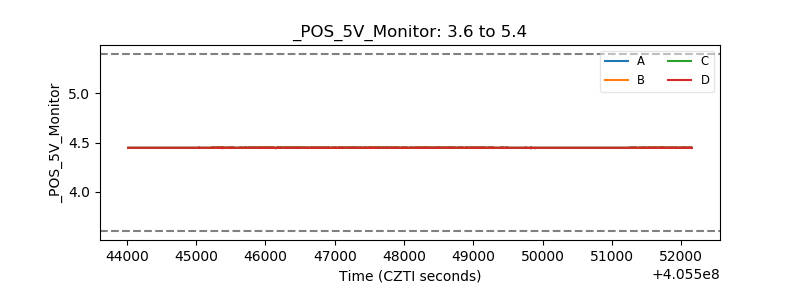 |
| _ROLL_ROT | 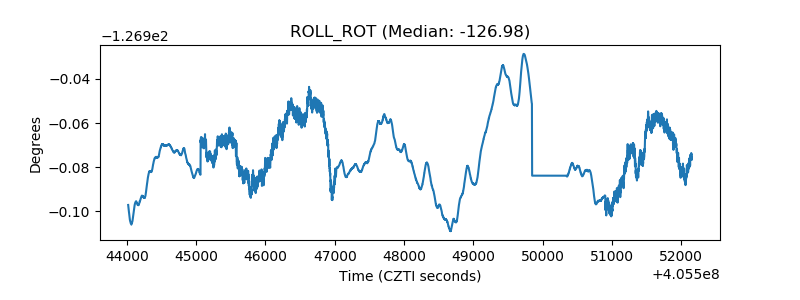 |
| _Roll_DEC | 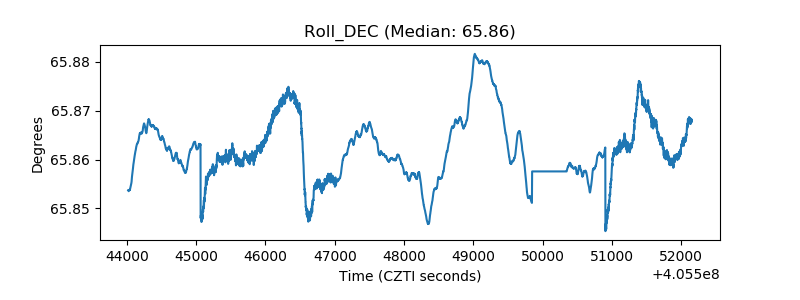 |
| _Roll_RA | 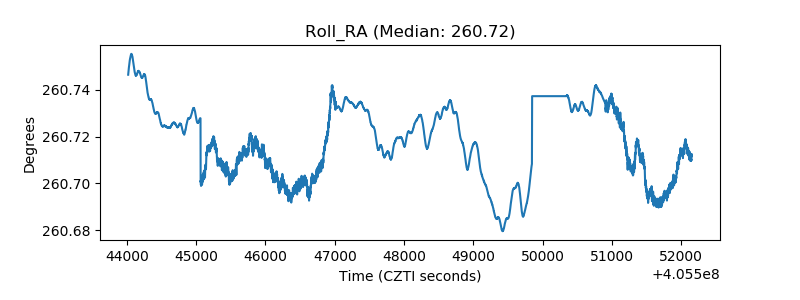 |
| Veto Counter | 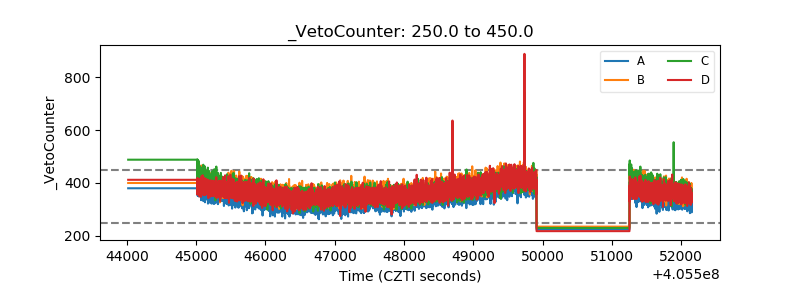 |