| Param | Original file | Final file |
|---|---|---|
| Filename | modeM0/AS1A12_018T01_9000005386_38453cztM0_level2.fits | modeM0/AS1A12_018T01_9000005386_38453cztM0_level2_quad_clean.evt |
| Size (bytes) | 372,323,520 | 99,267,840 |
| Size | 355.1 MB | 94.7 MB |
| Events in quadrant A | 3,185,406 | 666,418 |
| Events in quadrant B | 3,245,616 | 671,858 |
| Events in quadrant C | 2,923,619 | 655,160 |
| Events in quadrant D | 3,958,836 | 591,547 |
| Mode SS | |||
|---|---|---|---|
| Quadrant | BADHDUFLAG | Total packets | Discarded packets |
| A | 0 | 122 | 0 |
| B | 0 | 122 | 0 |
| C | 0 | 122 | 0 |
| D | 0 | 122 | 0 |
| Mode M9 | |||
|---|---|---|---|
| Quadrant | BADHDUFLAG | Total packets | Discarded packets |
| A | 0 | 21 | 0 |
| B | 0 | 21 | 0 |
| C | 0 | 21 | 0 |
| D | 0 | 22 | 0 |
| Mode M0 | |||
|---|---|---|---|
| Quadrant | BADHDUFLAG | Total packets | Discarded packets |
| A | 0 | 13180 | 3 |
| B | 0 | 13702 | 2 |
| C | 0 | 12445 | 2 |
| D | 0 | 15965 | 2 |
| Quadrant | Total seconds | Saturated seconds | Saturation percentage |
|---|---|---|---|
| A | 6022 | 24 | 0.398539% |
| B | 6022 | 89 | 1.477914% |
| C | 6022 | 17 | 0.282298% |
| D | 6022 | 248 | 4.118233% |
Noise dominated data is calculated using 1-second bins in cleaned event files. If a bin has >2000 counts, and if more than 50% of those come from <1% of pixels, then it is considered to be noise-dominated and hence unusable.
| Quadrant | # 1 sec bins | Bins with >0 counts | Bins with >2000 counts | High rate bins dominated by noise | Noise dominated (total time) | Noise dominated (detector-on time) | Marked lightcurve |
|---|---|---|---|---|---|---|---|
| A | 7305 | 6023 | 13 | 13 | 0.18% | 0.22% | 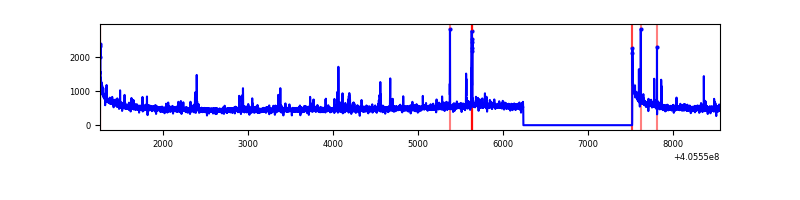 |
| B | 7305 | 6023 | 61 | 61 | 0.84% | 1.01% | 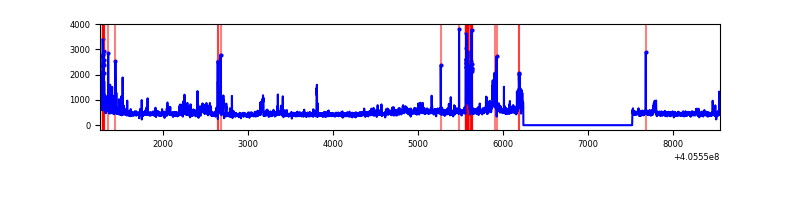 |
| C | 7305 | 6023 | 11 | 11 | 0.15% | 0.18% | 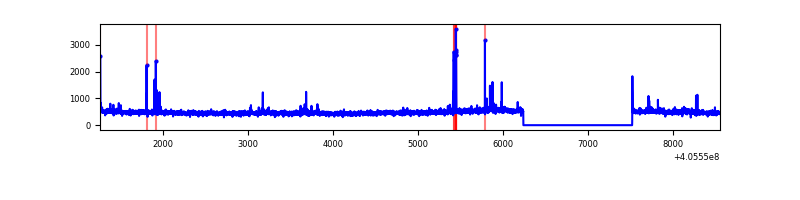 |
| D | 7305 | 6023 | 198 | 198 | 2.71% | 3.29% | 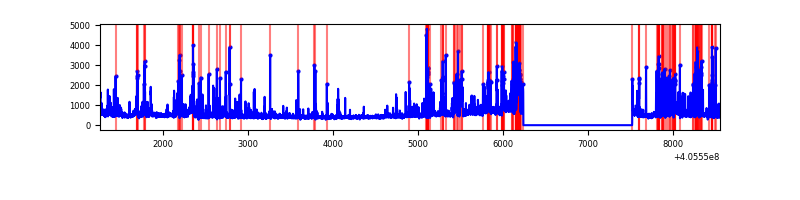 |
Top three noisy pixels from each quadrant. If the there are fewer than three noisy pixels in the level2.evt file, extra rows are filled as -1
| Pixel properties | Quadrant properties | ||||||
|---|---|---|---|---|---|---|---|
| Quadrant | DetID | PixID | Counts | Sigma | Mean | Median | Sigma |
| A | 10 | 83 | 425324 | 3114.53 | 670 | 658 | 136.4 |
| A | 9 | 143 | 68075 | 494.44 | 670 | 658 | 136.4 |
| A | 6 | 10 | 42793 | 309.02 | 670 | 658 | 136.4 |
| B | 0 | 183 | 200730 | 1565.32 | 662 | 642 | 127.8 |
| B | 5 | 184 | 131480 | 1023.57 | 662 | 642 | 127.8 |
| B | 4 | 232 | 120153 | 934.96 | 662 | 642 | 127.8 |
| C | 15 | 214 | 251245 | 1635.44 | 655 | 659 | 153.2 |
| C | 14 | 254 | 43074 | 276.82 | 655 | 659 | 153.2 |
| C | 15 | 159 | 28690 | 182.94 | 655 | 659 | 153.2 |
| D | 13 | 249 | 409983 | 2616.57 | 644 | 625 | 156.4 |
| D | 2 | 153 | 331267 | 2113.43 | 644 | 625 | 156.4 |
| D | 7 | 223 | 163670 | 1042.17 | 644 | 625 | 156.4 |
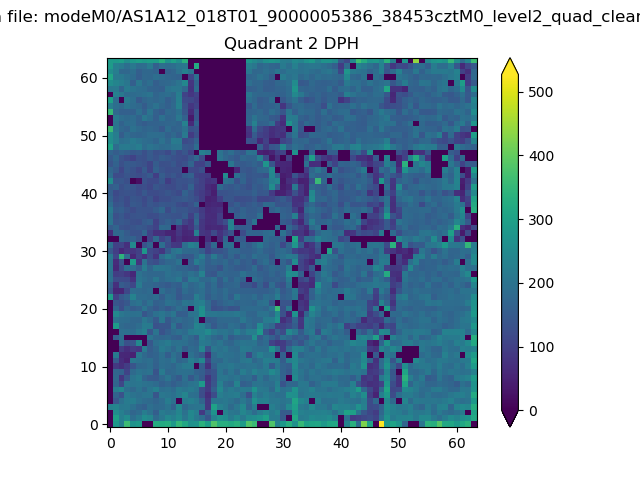
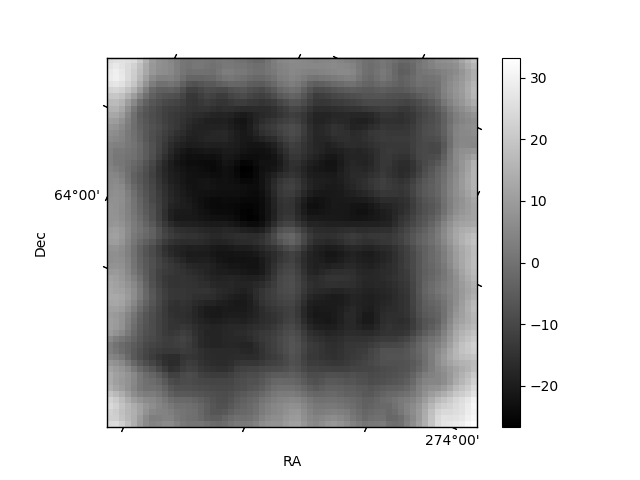
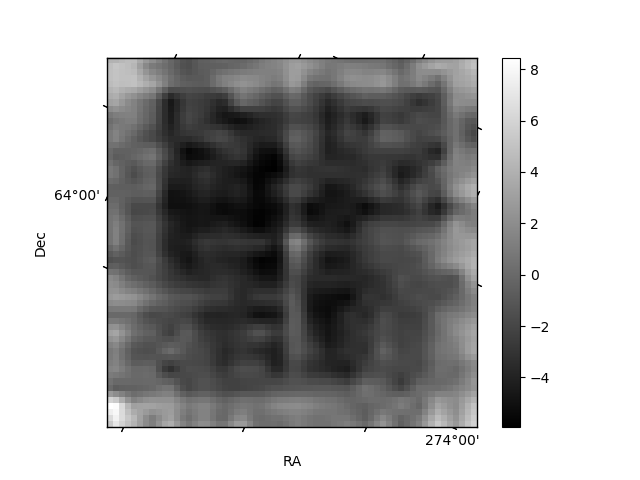
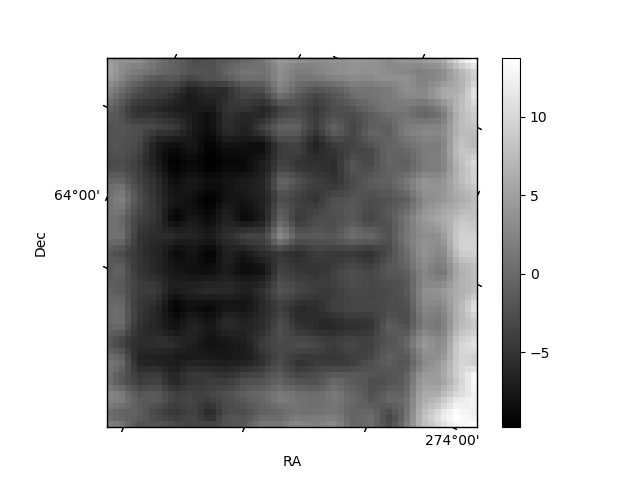
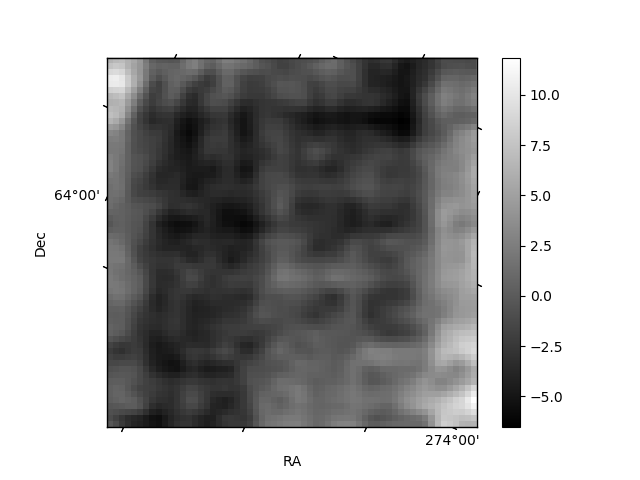
Histogram calculated using DETX and DETY for each event in the final _common_clean file
| Quadrant A | 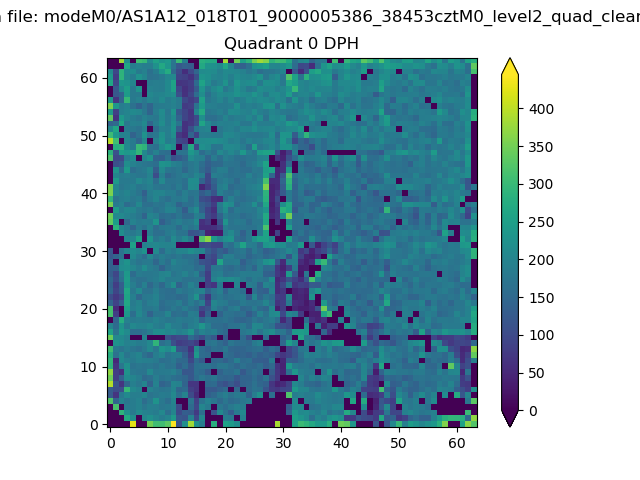 |
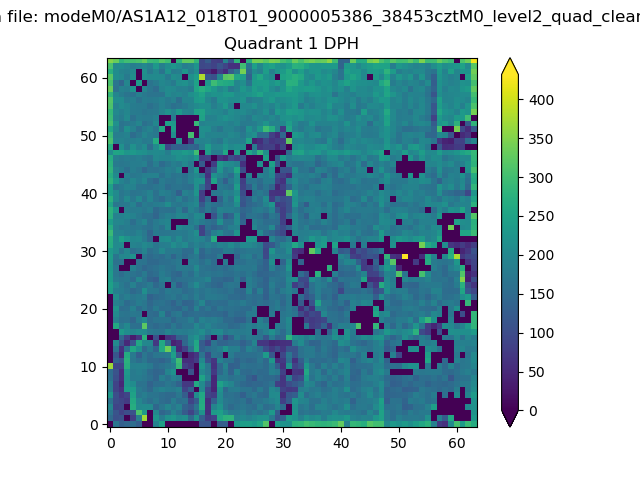 |
Quadrant B |
|---|---|---|---|
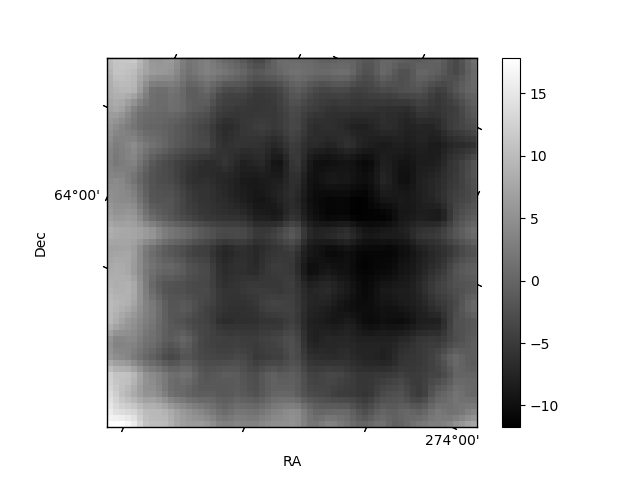
| Quadrant D | 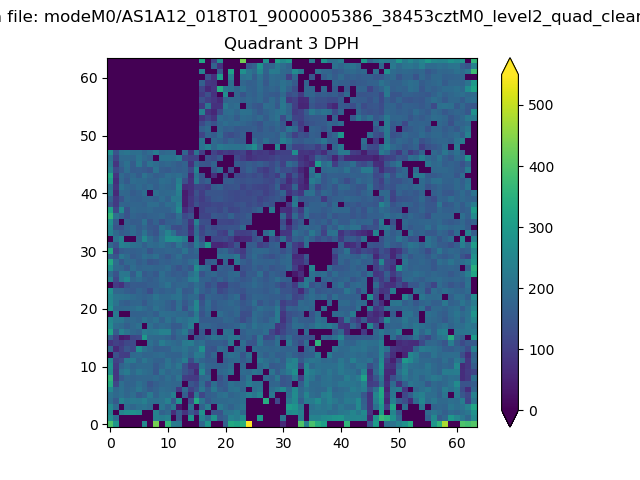 |
 |
Quadrant C |
| Plot type | Count rate plots | Images |
|---|---|---|
| Comparison with Poisson distribution Blue bars denote a histogram of data divided into 1 sec bins. Red curve is a Poisson curve with rate = median count rate of data. |
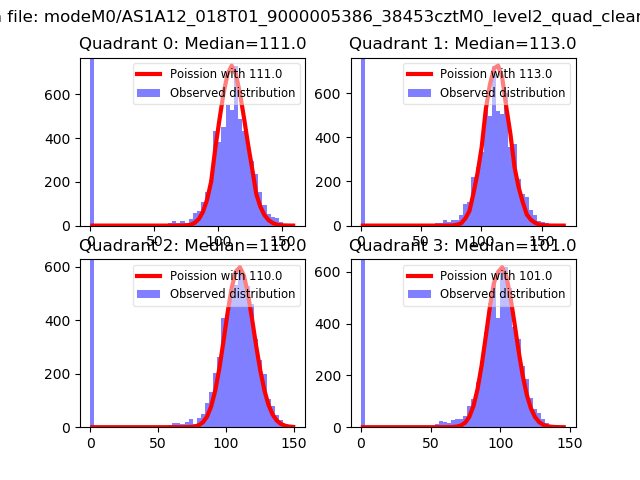 |
 |
| Quadrant-wise count rates Data is divided into 100 sec bins |
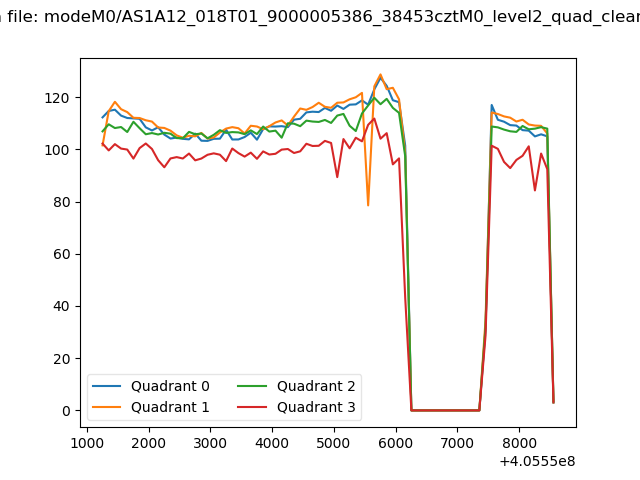 |
|
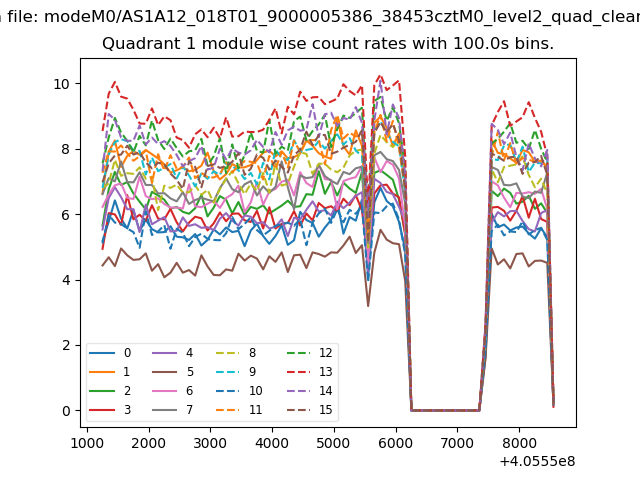
| Module-wise count rates for Quadrant A Data is divided into 100 sec bins |
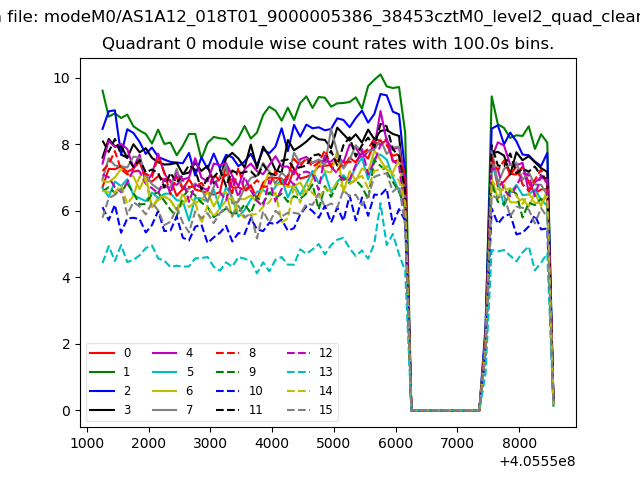 |
 |
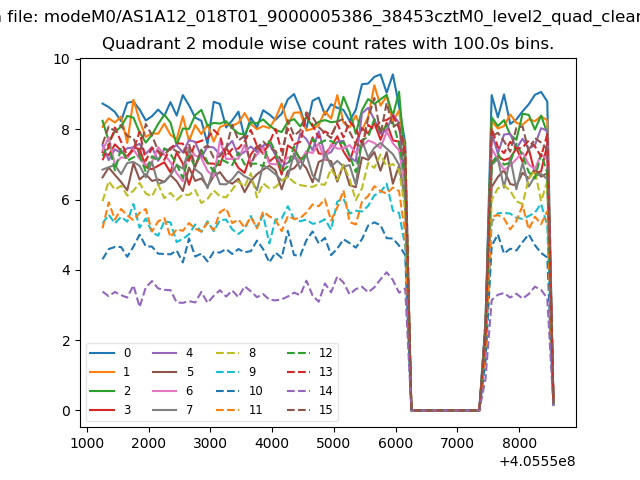
| Module-wise count rates for Quadrant B Data is divided into 100 sec bins |
 |
 |
| Module-wise count rates for Quadrant C Data is divided into 100 sec bins |
 |
 |
| Module-wise count rates for Quadrant D Data is divided into 100 sec bins |
 |
 |
| Parameter | Plot |
|---|---|
| CZT HV Monitor | 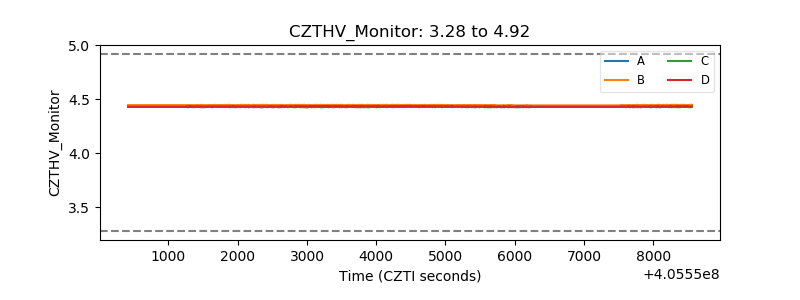 |
| D_VDD | 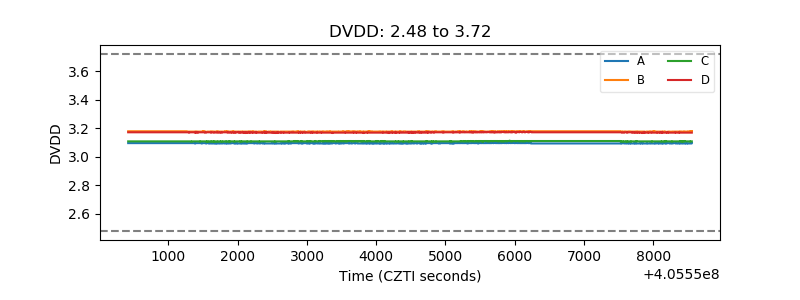 |
| Temperature 1 | 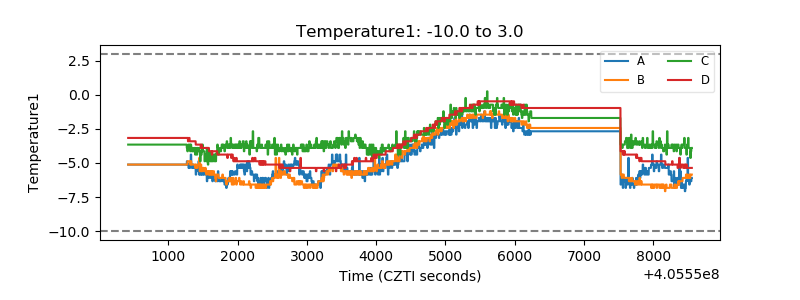 |
| Veto HV Monitor | 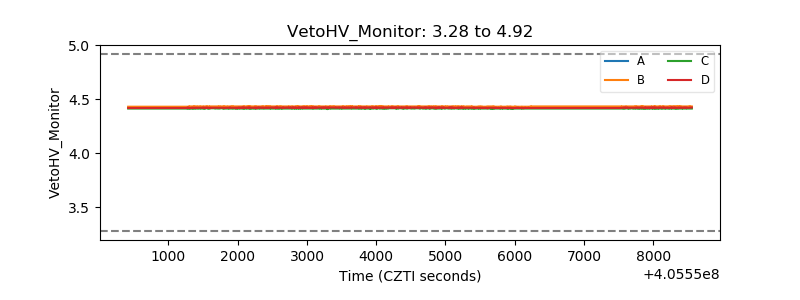 |
| Veto LLD | 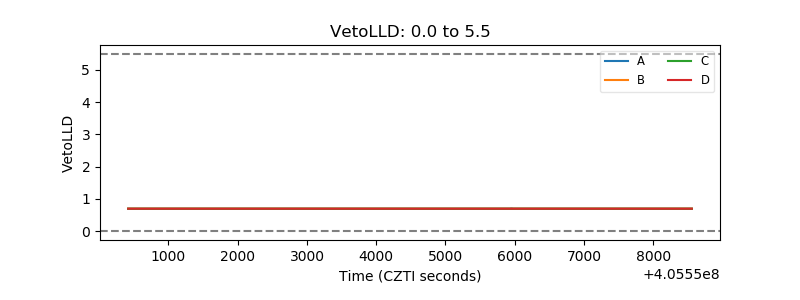 |
| Alpha Counter | 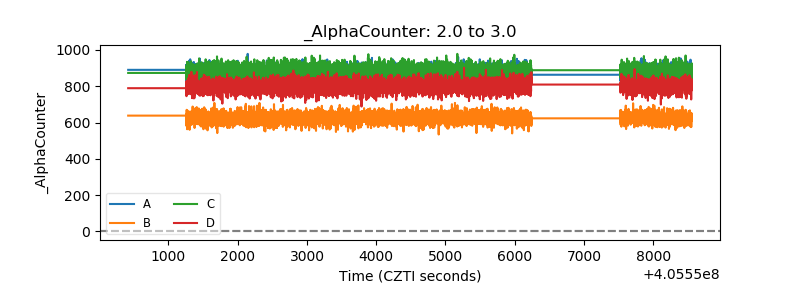 |
| _CPM_Rate | 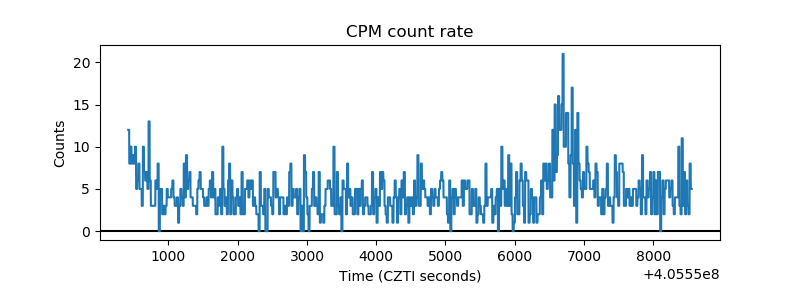 |
| CZT Counter | 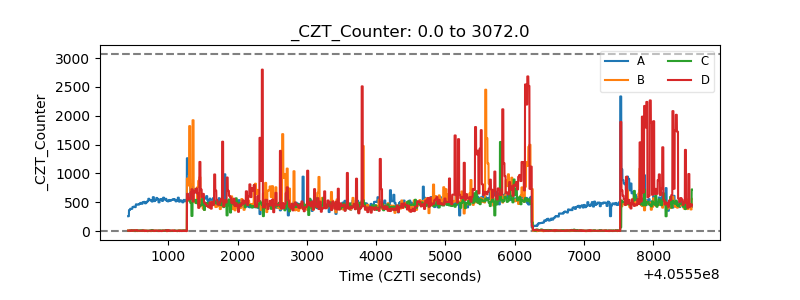 |
| +2.5 Volts monitor | 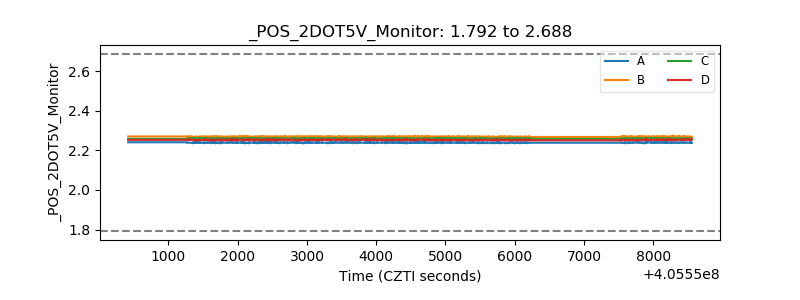 |
| +5 Volts monitor | 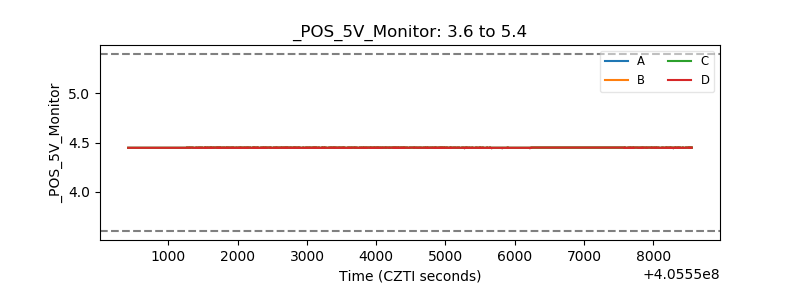 |
| _ROLL_ROT | 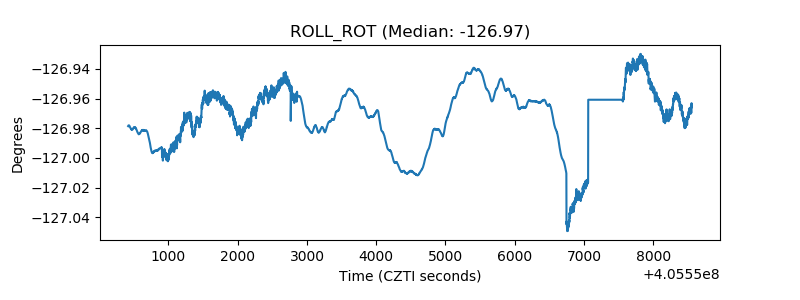 |
| _Roll_DEC | 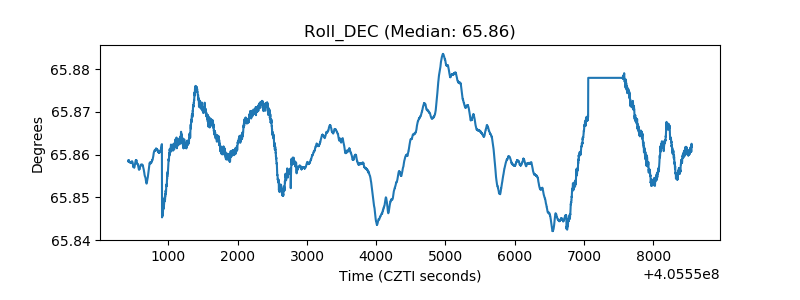 |
| _Roll_RA | 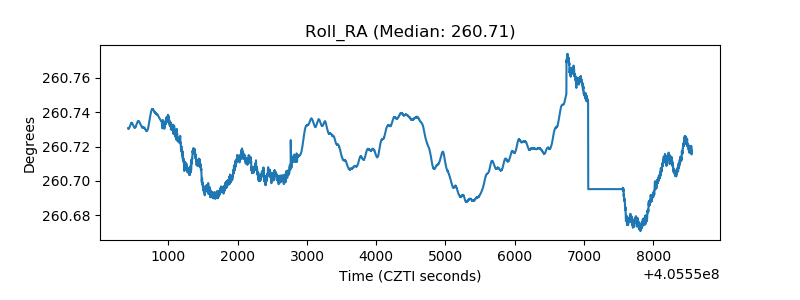 |
| Veto Counter | 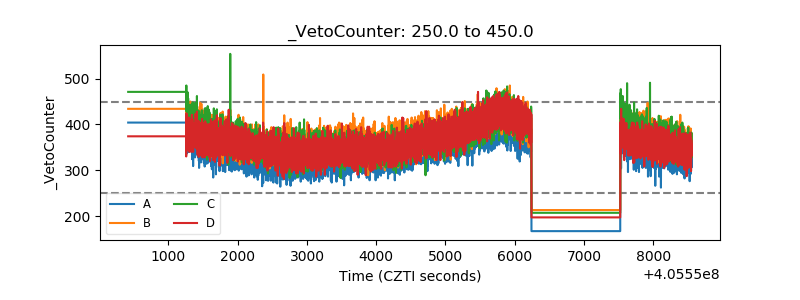 |