| Param | Original file | Final file |
|---|---|---|
| Filename | modeM0/AS1A12_018T01_9000005386_38455cztM0_level2.fits | modeM0/AS1A12_018T01_9000005386_38455cztM0_level2_quad_clean.evt |
| Size (bytes) | 392,258,880 | 104,345,280 |
| Size | 374.1 MB | 99.5 MB |
| Events in quadrant A | 3,349,415 | 697,777 |
| Events in quadrant B | 3,520,533 | 699,845 |
| Events in quadrant C | 3,027,760 | 691,014 |
| Events in quadrant D | 4,125,454 | 624,963 |
| Mode SS | |||
|---|---|---|---|
| Quadrant | BADHDUFLAG | Total packets | Discarded packets |
| A | 0 | 130 | 0 |
| B | 0 | 130 | 0 |
| C | 0 | 130 | 0 |
| D | 0 | 130 | 0 |
| Mode M9 | |||
|---|---|---|---|
| Quadrant | BADHDUFLAG | Total packets | Discarded packets |
| A | 0 | 13 | 0 |
| B | 0 | 13 | 0 |
| C | 0 | 13 | 0 |
| D | 0 | 13 | 0 |
| Mode M0 | |||
|---|---|---|---|
| Quadrant | BADHDUFLAG | Total packets | Discarded packets |
| A | 0 | 13924 | 3 |
| B | 0 | 14843 | 2 |
| C | 0 | 13062 | 2 |
| D | 0 | 16755 | 2 |
| Quadrant | Total seconds | Saturated seconds | Saturation percentage |
|---|---|---|---|
| A | 6387 | 15 | 0.234852% |
| B | 6387 | 156 | 2.442461% |
| C | 6387 | 8 | 0.125254% |
| D | 6387 | 206 | 3.225301% |
Noise dominated data is calculated using 1-second bins in cleaned event files. If a bin has >2000 counts, and if more than 50% of those come from <1% of pixels, then it is considered to be noise-dominated and hence unusable.
| Quadrant | # 1 sec bins | Bins with >0 counts | Bins with >2000 counts | High rate bins dominated by noise | Noise dominated (total time) | Noise dominated (detector-on time) | Marked lightcurve |
|---|---|---|---|---|---|---|---|
| A | 7700 | 6388 | 9 | 9 | 0.12% | 0.14% | 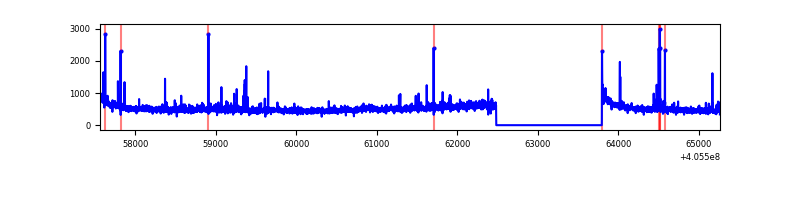 |
| B | 7700 | 6388 | 79 | 79 | 1.03% | 1.24% | 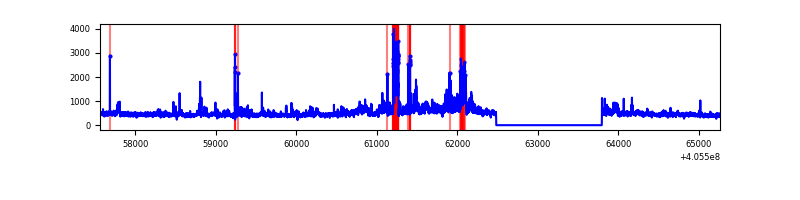 |
| C | 7700 | 6388 | 2 | 2 | 0.03% | 0.03% | 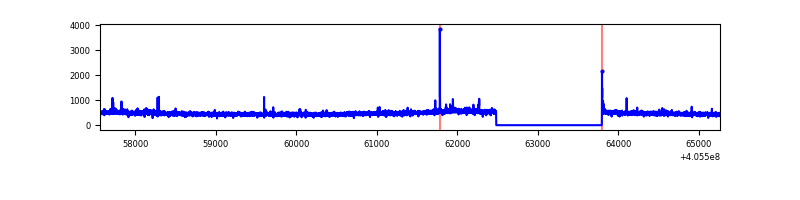 |
| D | 7700 | 6388 | 187 | 187 | 2.43% | 2.93% | 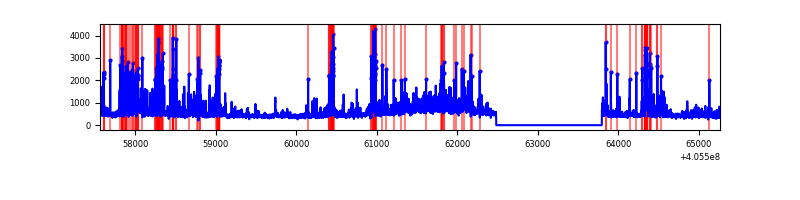 |
Top three noisy pixels from each quadrant. If the there are fewer than three noisy pixels in the level2.evt file, extra rows are filled as -1
| Pixel properties | Quadrant properties | ||||||
|---|---|---|---|---|---|---|---|
| Quadrant | DetID | PixID | Counts | Sigma | Mean | Median | Sigma |
| A | 10 | 83 | 418805 | 2915.07 | 704 | 690 | 143.4 |
| A | 9 | 143 | 87643 | 606.23 | 704 | 690 | 143.4 |
| A | 12 | 189 | 42324 | 290.27 | 704 | 690 | 143.4 |
| B | 0 | 183 | 237351 | 1759.15 | 695 | 676 | 134.5 |
| B | 15 | 201 | 236224 | 1750.77 | 695 | 676 | 134.5 |
| B | 4 | 232 | 169507 | 1254.88 | 695 | 676 | 134.5 |
| C | 15 | 214 | 267856 | 1654.12 | 691 | 694 | 161.5 |
| C | 14 | 254 | 33960 | 205.96 | 691 | 694 | 161.5 |
| C | 3 | 233 | 15715 | 93.0 | 691 | 694 | 161.5 |
| D | 13 | 249 | 489278 | 2956.45 | 679 | 658 | 165.3 |
| D | 12 | 235 | 259792 | 1567.92 | 679 | 658 | 165.3 |
| D | 13 | 200 | 185670 | 1119.44 | 679 | 658 | 165.3 |
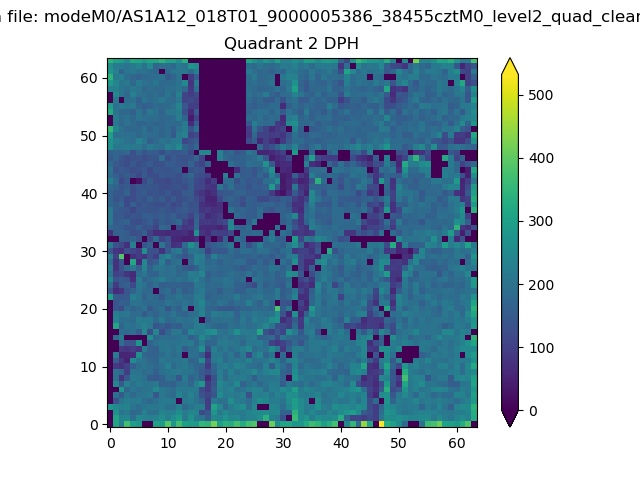
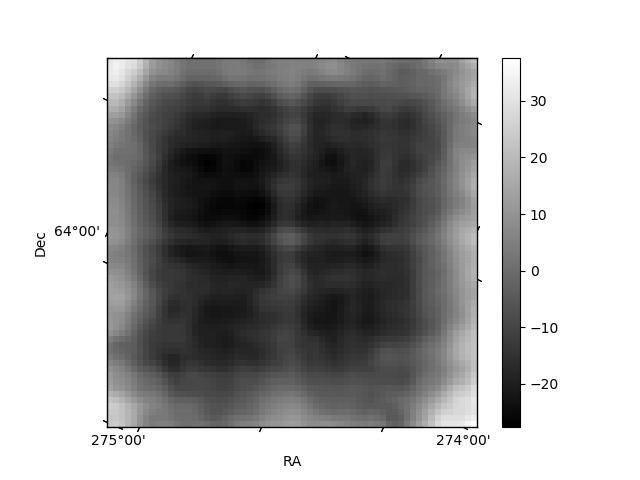
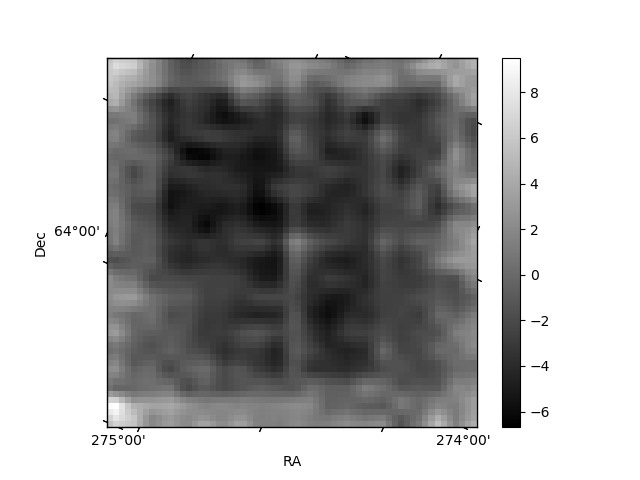
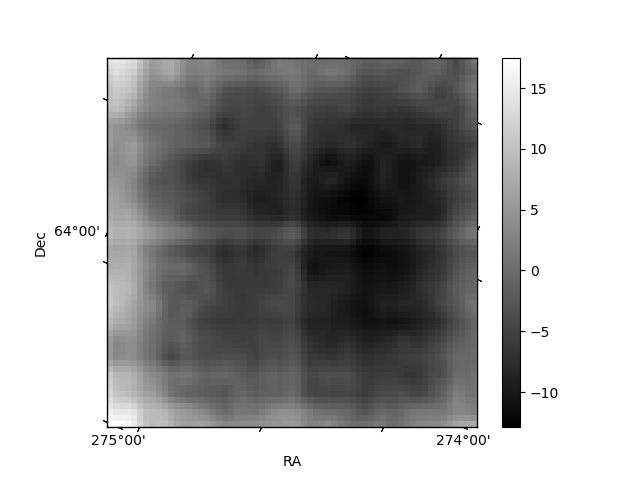
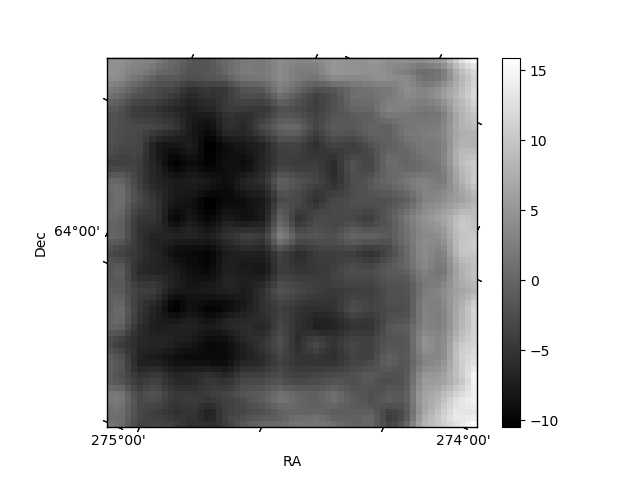
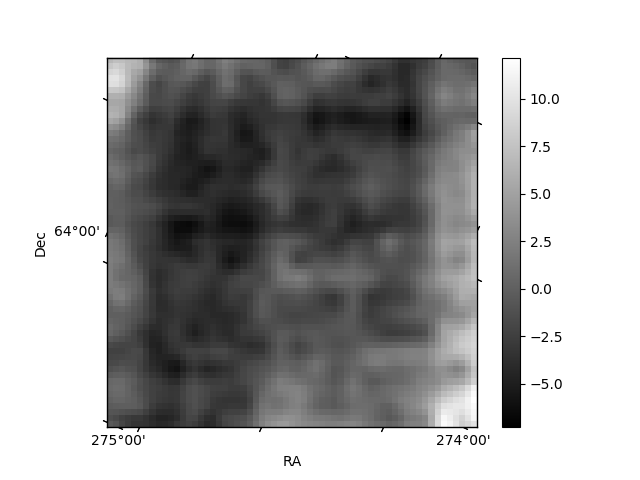
Histogram calculated using DETX and DETY for each event in the final _common_clean file
| Quadrant A | 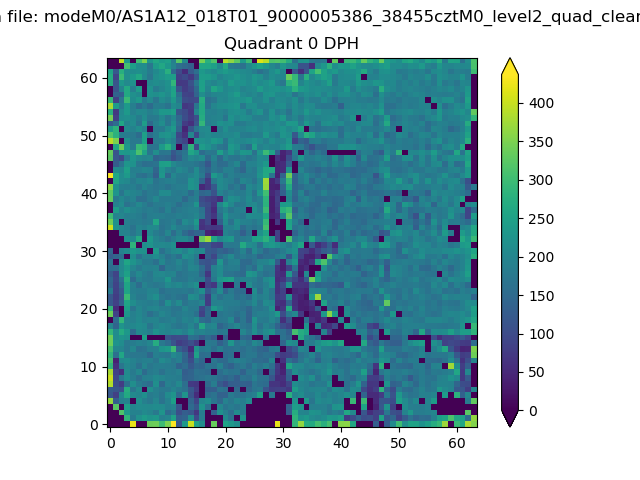 |
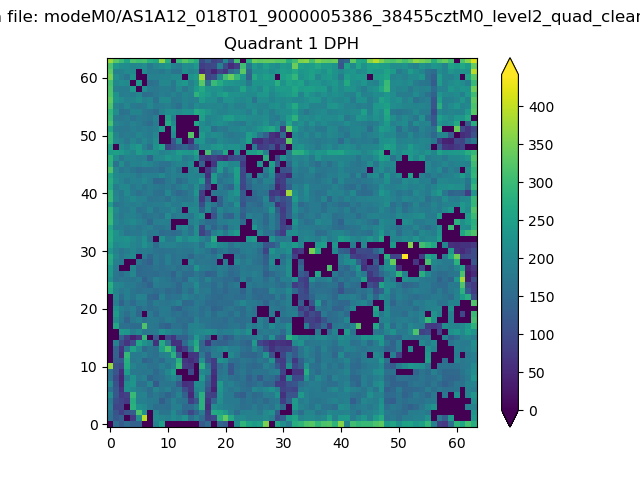 |
Quadrant B |
|---|---|---|---|
| Quadrant D | 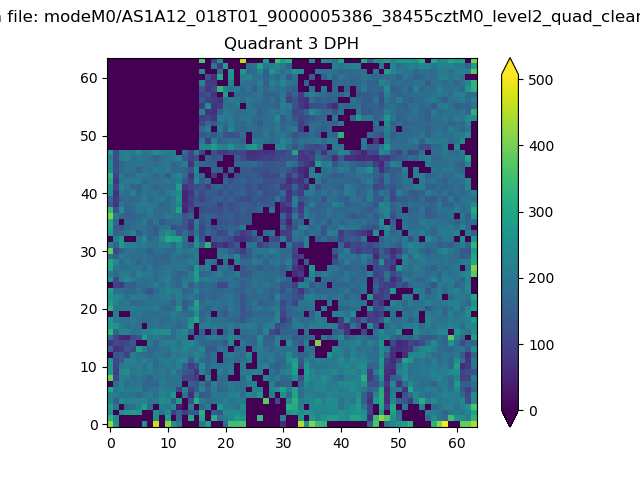 |
 |
Quadrant C |
| Plot type | Count rate plots | Images |
|---|---|---|
| Comparison with Poisson distribution Blue bars denote a histogram of data divided into 1 sec bins. Red curve is a Poisson curve with rate = median count rate of data. |
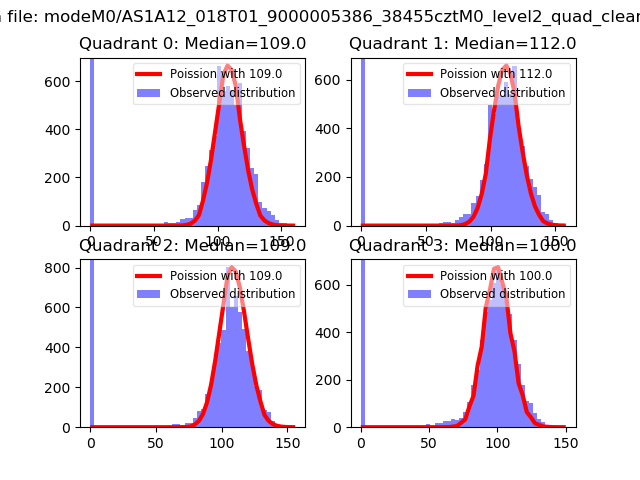 |
 |
| Quadrant-wise count rates Data is divided into 100 sec bins |
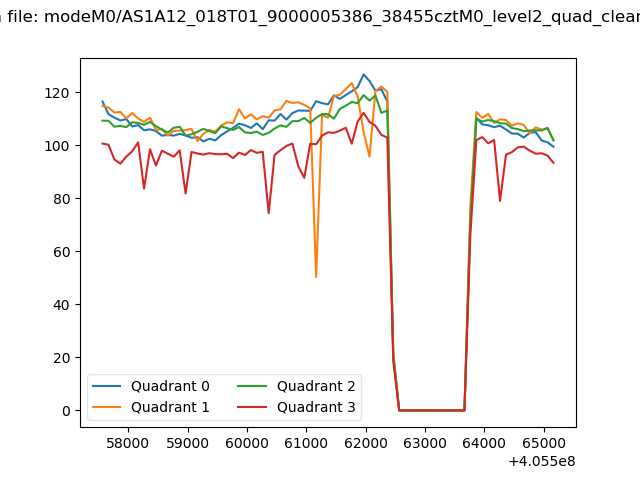 |
|
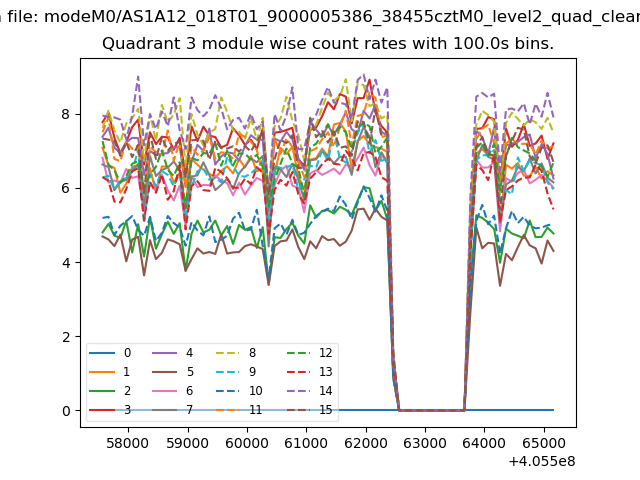
| Module-wise count rates for Quadrant A Data is divided into 100 sec bins |
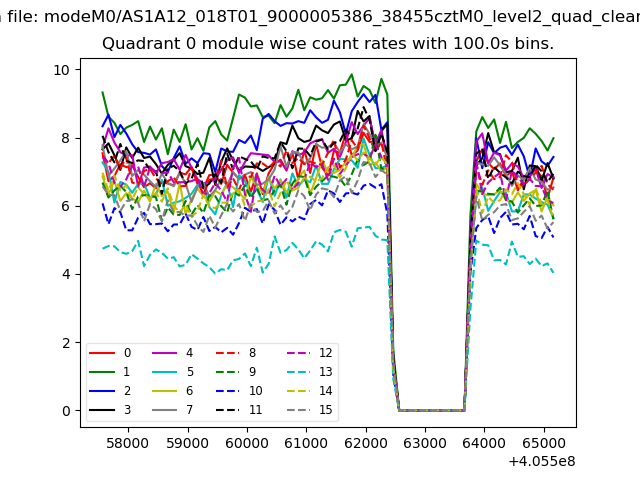 |
 |
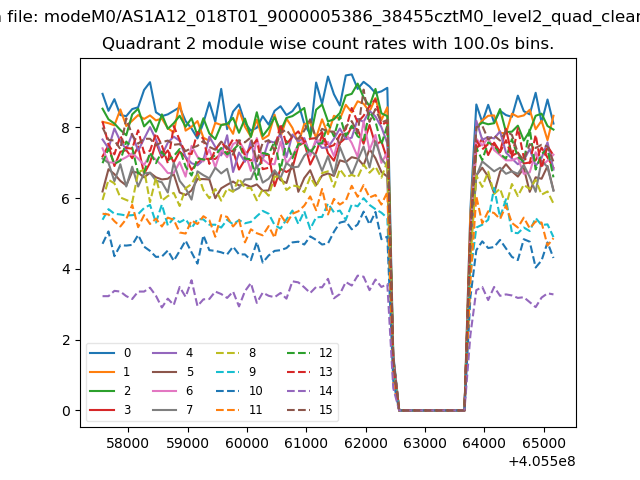
| Module-wise count rates for Quadrant B Data is divided into 100 sec bins |
 |
 |
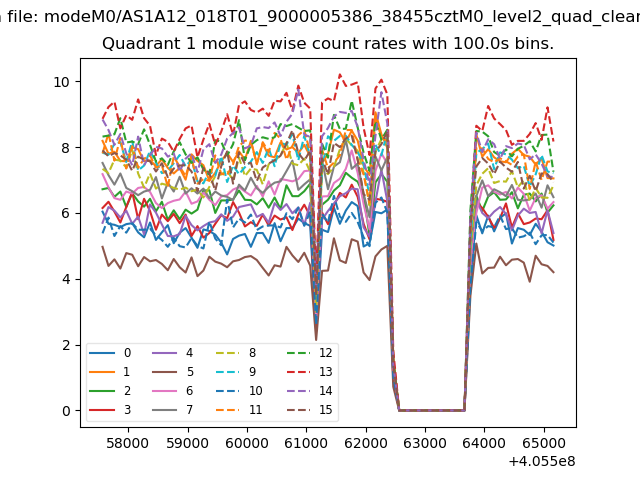
| Module-wise count rates for Quadrant C Data is divided into 100 sec bins |
 |
 |
| Module-wise count rates for Quadrant D Data is divided into 100 sec bins |
 |
 |
| Parameter | Plot |
|---|---|
| CZT HV Monitor | 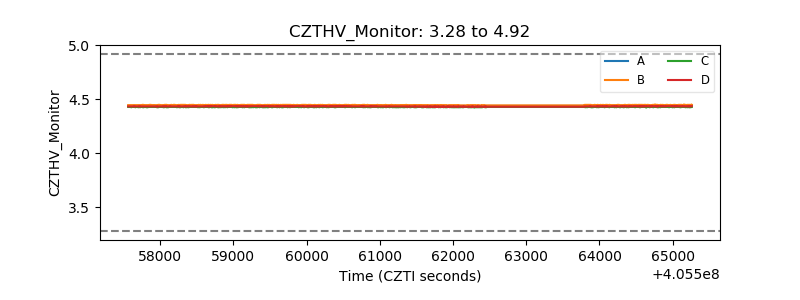 |
| D_VDD | 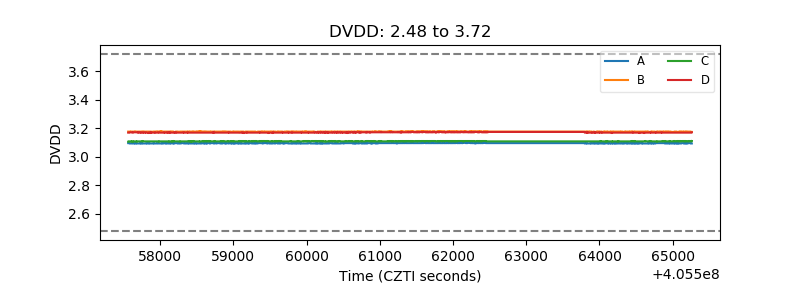 |
| Temperature 1 | 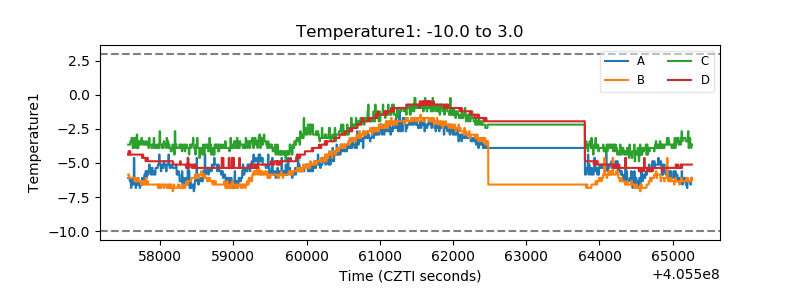 |
| Veto HV Monitor | 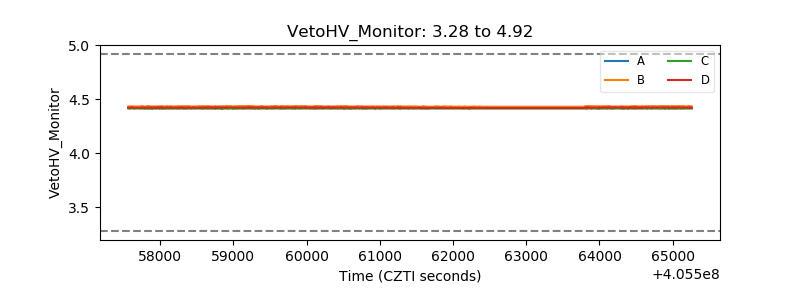 |
| Veto LLD | 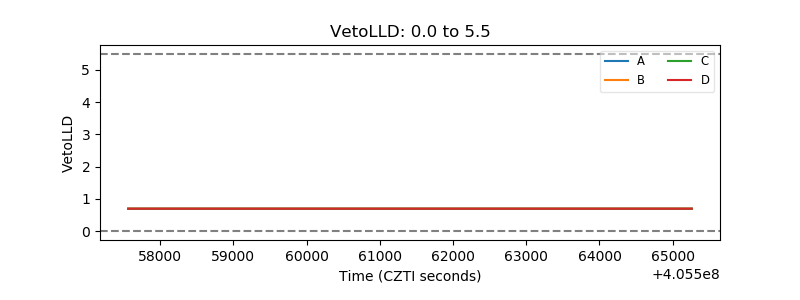 |
| Alpha Counter | 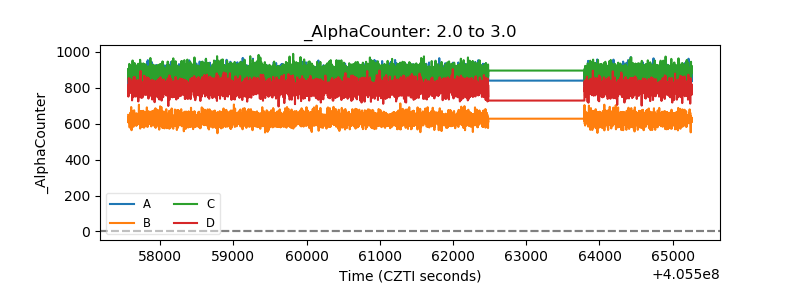 |
| _CPM_Rate | 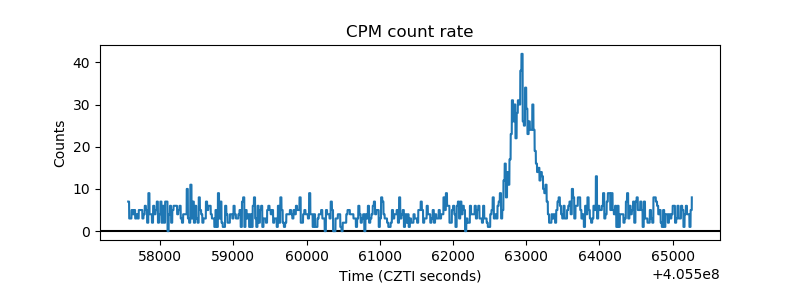 |
| CZT Counter | 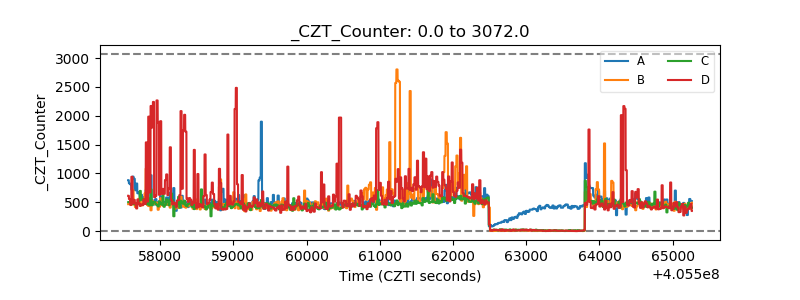 |
| +2.5 Volts monitor | 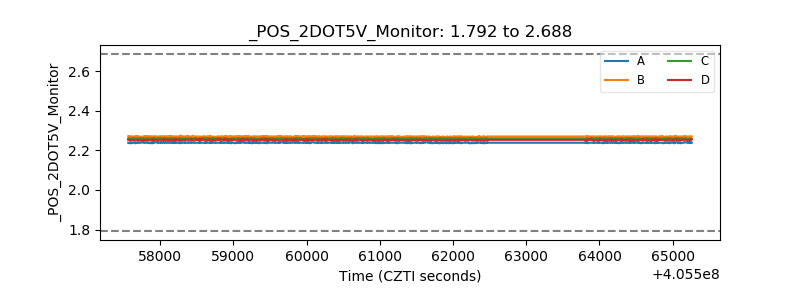 |
| +5 Volts monitor | 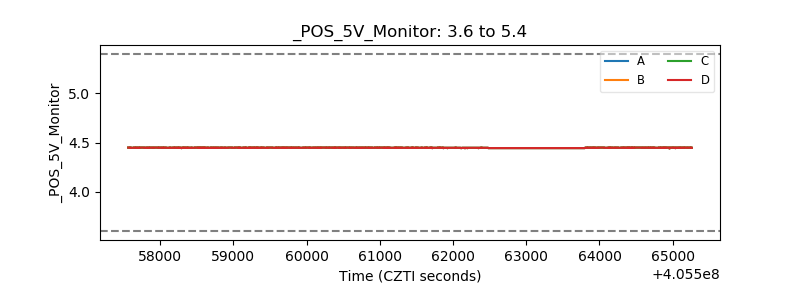 |
| _ROLL_ROT | 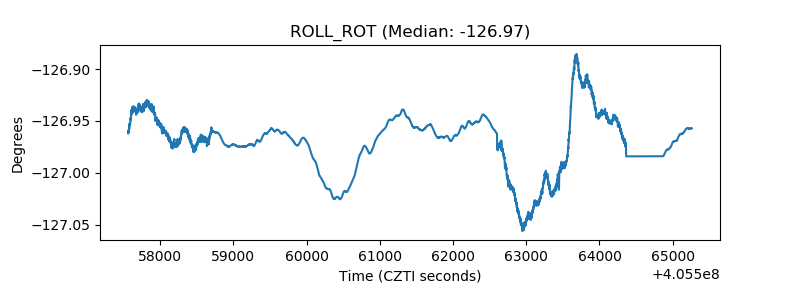 |
| _Roll_DEC | 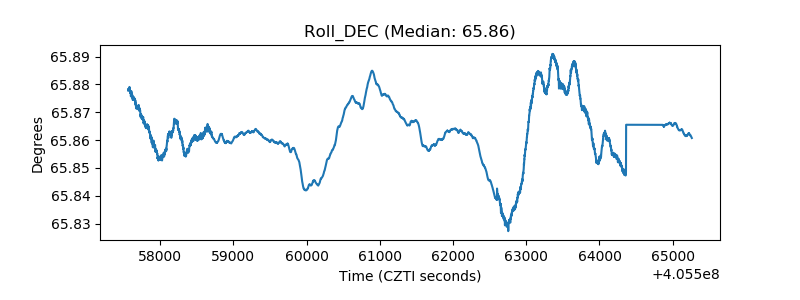 |
| _Roll_RA | 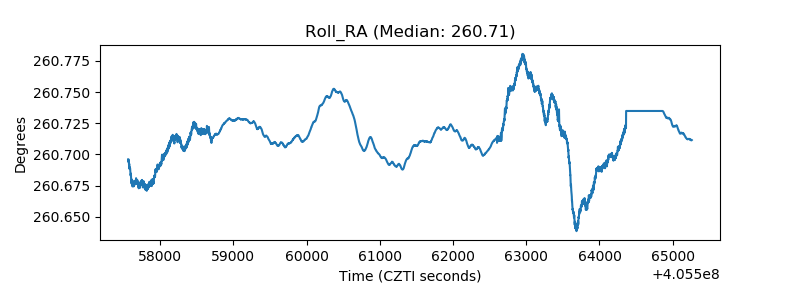 |
| Veto Counter | 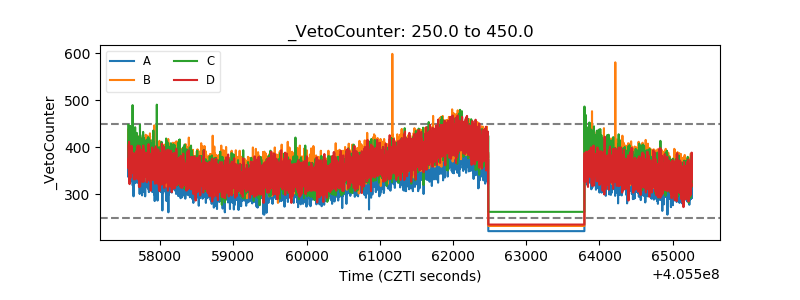 |