| Param | Original file | Final file |
|---|---|---|
| Filename | modeM0/AS1A12_018T01_9000005386_38456cztM0_level2.fits | modeM0/AS1A12_018T01_9000005386_38456cztM0_level2_quad_clean.evt |
| Size (bytes) | 624,571,200 | 155,134,080 |
| Size | 595.6 MB | 147.9 MB |
| Events in quadrant A | 4,972,576 | 1,051,223 |
| Events in quadrant B | 5,690,459 | 1,055,424 |
| Events in quadrant C | 4,510,902 | 1,030,981 |
| Events in quadrant D | 7,203,840 | 896,777 |
| Mode SS | |||
|---|---|---|---|
| Quadrant | BADHDUFLAG | Total packets | Discarded packets |
| A | 0 | 194 | 0 |
| B | 0 | 194 | 0 |
| C | 0 | 194 | 0 |
| D | 0 | 194 | 0 |
| Mode M9 | |||
|---|---|---|---|
| Quadrant | BADHDUFLAG | Total packets | Discarded packets |
| A | 0 | 30 | 0 |
| B | 0 | 30 | 0 |
| C | 0 | 30 | 0 |
| D | 0 | 30 | 0 |
| Mode M0 | |||
|---|---|---|---|
| Quadrant | BADHDUFLAG | Total packets | Discarded packets |
| A | 0 | 20695 | 3 |
| B | 0 | 23670 | 2 |
| C | 0 | 19551 | 2 |
| D | 0 | 28109 | 2 |
| Quadrant | Total seconds | Saturated seconds | Saturation percentage |
|---|---|---|---|
| A | 9561 | 34 | 0.355611% |
| B | 9561 | 286 | 2.991319% |
| C | 9561 | 17 | 0.177806% |
| D | 9561 | 699 | 7.310951% |
Noise dominated data is calculated using 1-second bins in cleaned event files. If a bin has >2000 counts, and if more than 50% of those come from <1% of pixels, then it is considered to be noise-dominated and hence unusable.
| Quadrant | # 1 sec bins | Bins with >0 counts | Bins with >2000 counts | High rate bins dominated by noise | Noise dominated (total time) | Noise dominated (detector-on time) | Marked lightcurve |
|---|---|---|---|---|---|---|---|
| A | 12487 | 9563 | 29 | 29 | 0.23% | 0.30% | 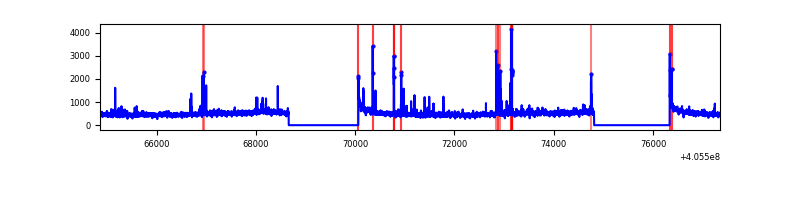 |
| B | 12487 | 9563 | 155 | 155 | 1.24% | 1.62% | 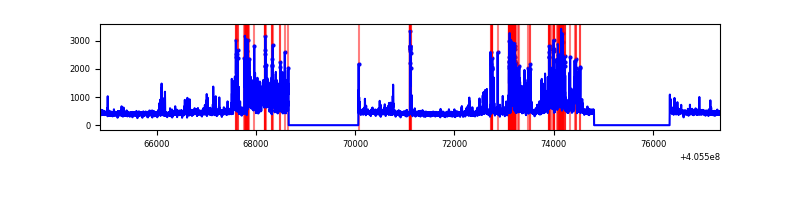 |
| C | 12487 | 9563 | 9 | 9 | 0.07% | 0.09% | 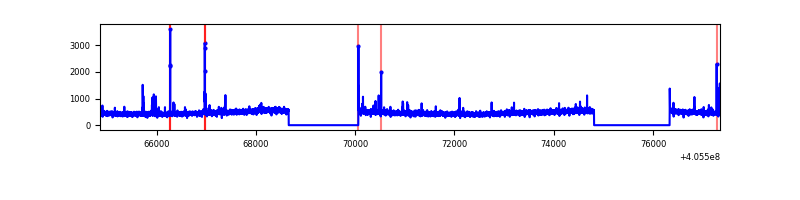 |
| D | 12487 | 9563 | 590 | 590 | 4.72% | 6.17% | 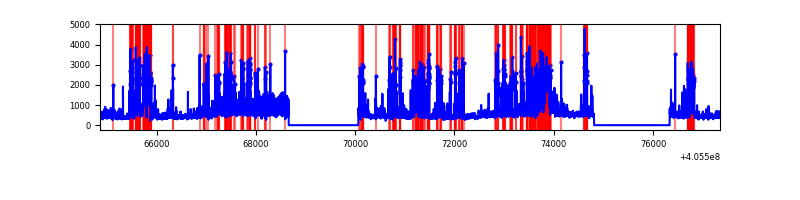 |
Top three noisy pixels from each quadrant. If the there are fewer than three noisy pixels in the level2.evt file, extra rows are filled as -1
| Pixel properties | Quadrant properties | ||||||
|---|---|---|---|---|---|---|---|
| Quadrant | DetID | PixID | Counts | Sigma | Mean | Median | Sigma |
| A | 10 | 83 | 585185 | 2728.34 | 1061 | 1039 | 214.1 |
| A | 9 | 143 | 179643 | 834.2 | 1061 | 1039 | 214.1 |
| A | 12 | 189 | 59313 | 272.18 | 1061 | 1039 | 214.1 |
| B | 5 | 184 | 722653 | 3638.95 | 1044 | 1015 | 198.3 |
| B | 0 | 183 | 491451 | 2473.09 | 1044 | 1015 | 198.3 |
| B | 4 | 171 | 170143 | 852.85 | 1044 | 1015 | 198.3 |
| C | 15 | 214 | 393376 | 1649.63 | 1026 | 1032 | 237.8 |
| C | 14 | 254 | 42253 | 173.32 | 1026 | 1032 | 237.8 |
| C | 1 | 23 | 36378 | 148.61 | 1026 | 1032 | 237.8 |
| D | 10 | 118 | 1254465 | 5163.65 | 1003 | 973 | 242.8 |
| D | 13 | 249 | 1050790 | 4324.63 | 1003 | 973 | 242.8 |
| D | 12 | 235 | 518641 | 2132.49 | 1003 | 973 | 242.8 |
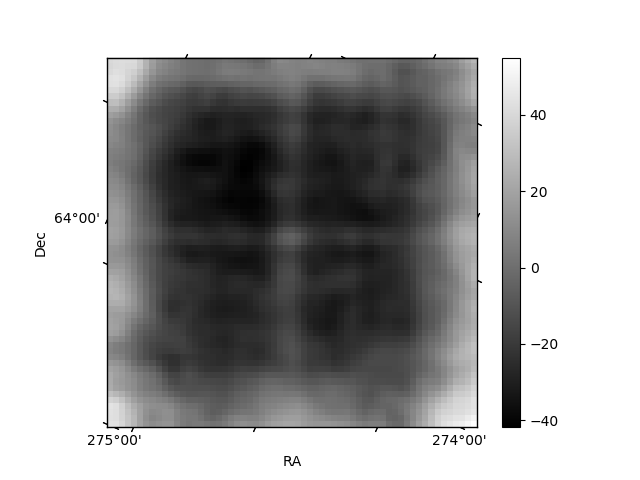
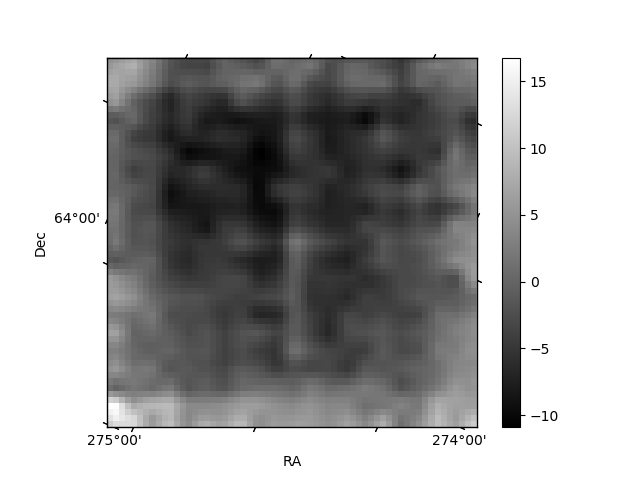
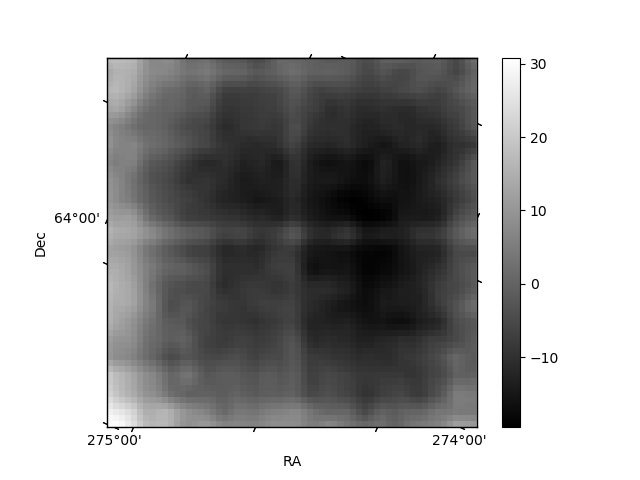
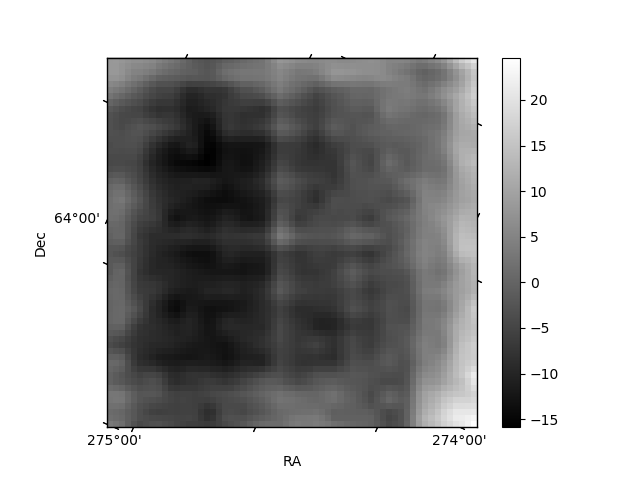
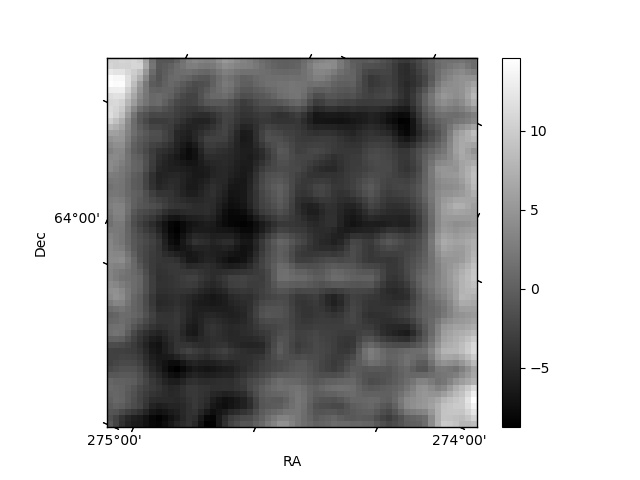
Histogram calculated using DETX and DETY for each event in the final _common_clean file
| Quadrant A | 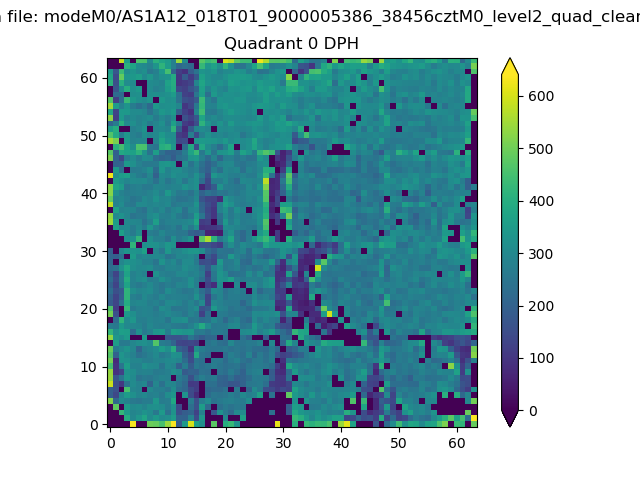 |
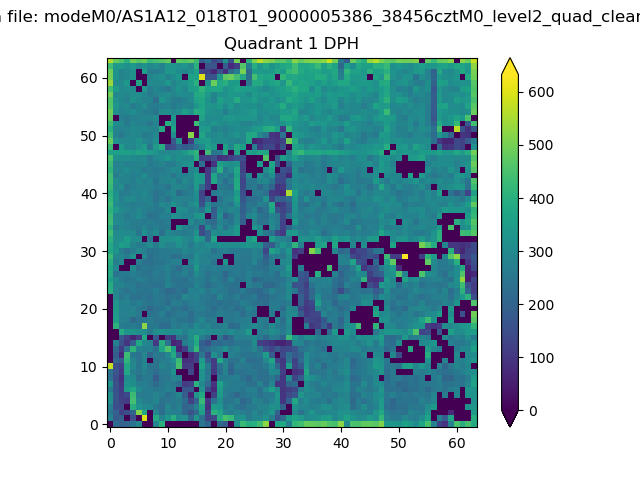 |
Quadrant B |
|---|---|---|---|
| Quadrant D | 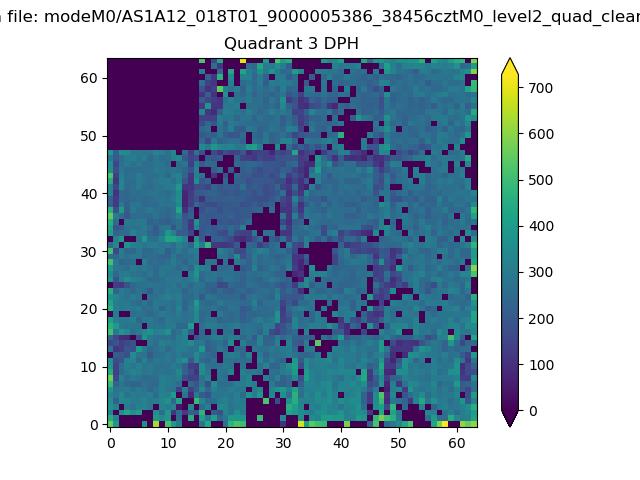 |
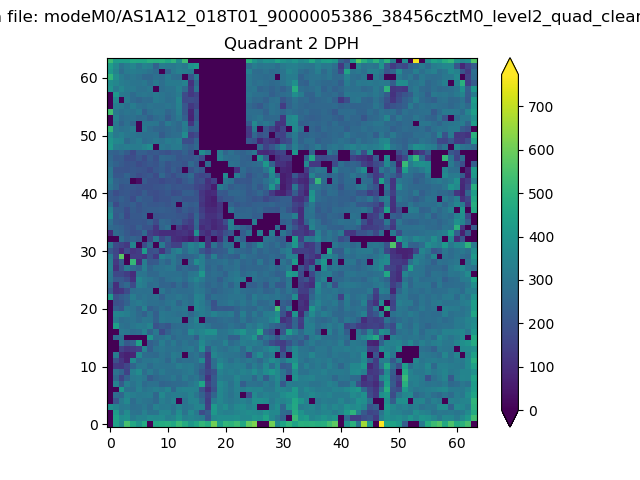 |
Quadrant C |
| Plot type | Count rate plots | Images |
|---|---|---|
| Comparison with Poisson distribution Blue bars denote a histogram of data divided into 1 sec bins. Red curve is a Poisson curve with rate = median count rate of data. |
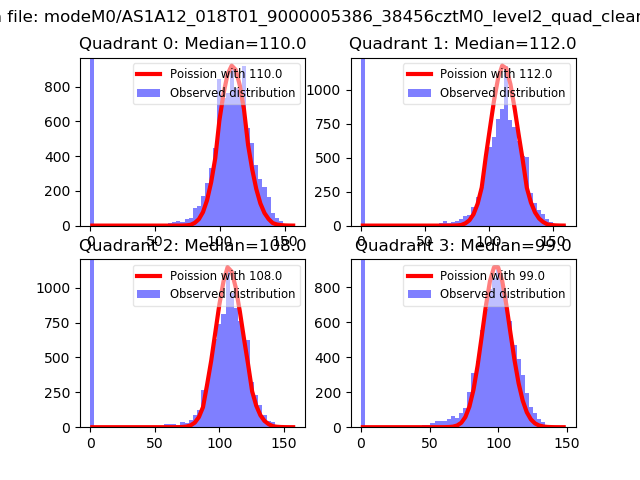 |
 |
| Quadrant-wise count rates Data is divided into 100 sec bins |
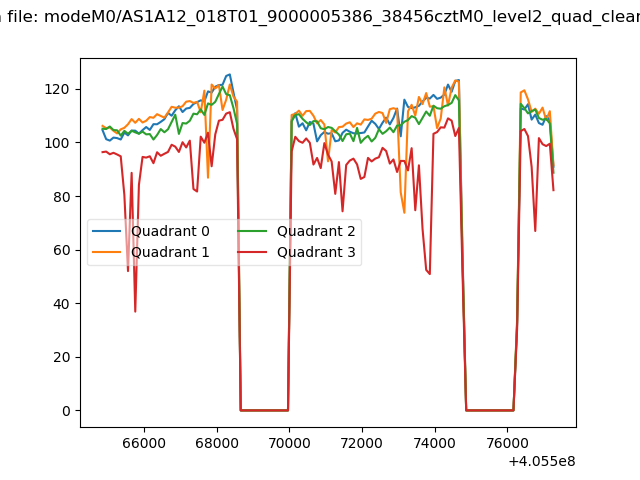 |
|
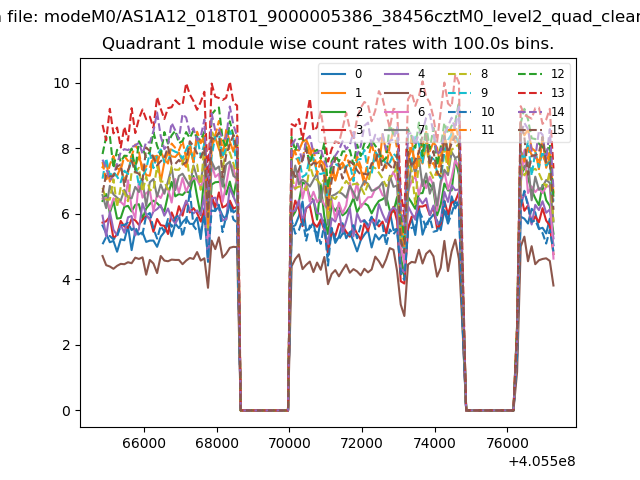
| Module-wise count rates for Quadrant A Data is divided into 100 sec bins |
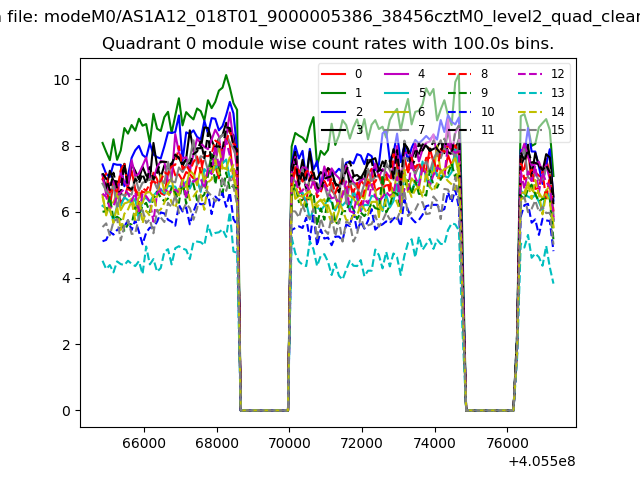 |
 |
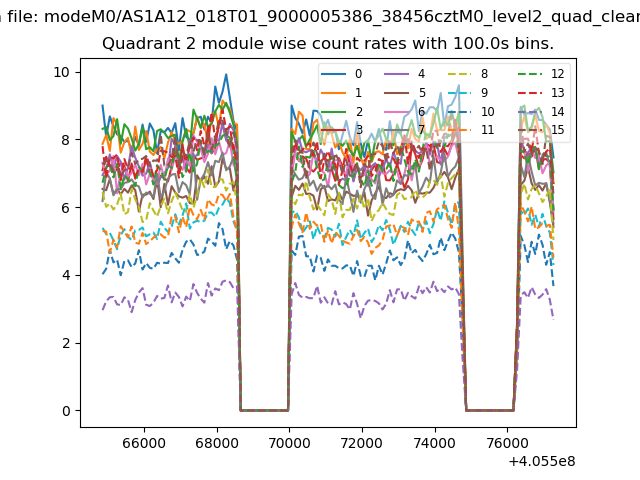
| Module-wise count rates for Quadrant B Data is divided into 100 sec bins |
 |
 |
| Module-wise count rates for Quadrant C Data is divided into 100 sec bins |
 |
 |
| Module-wise count rates for Quadrant D Data is divided into 100 sec bins |
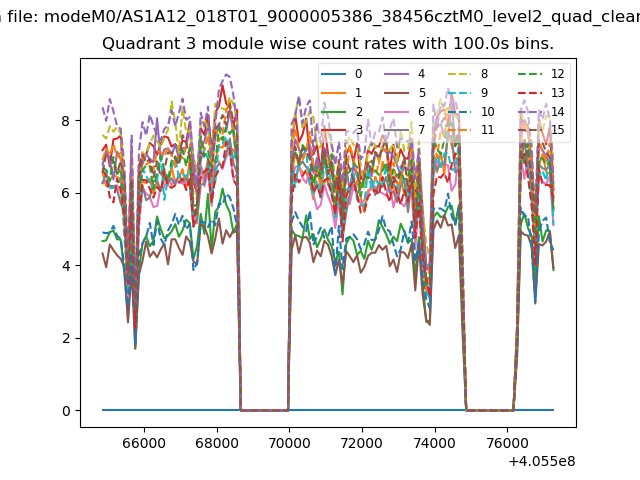 |
 |
| Parameter | Plot |
|---|---|
| CZT HV Monitor | 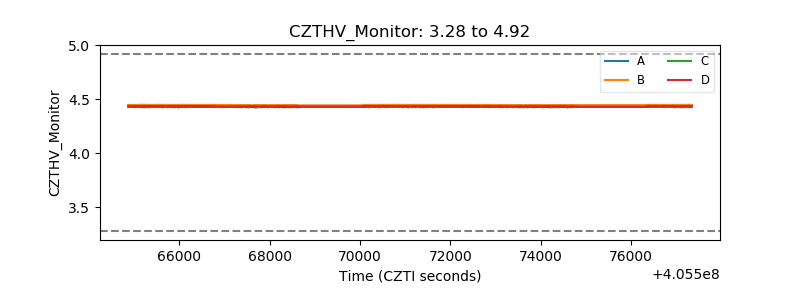 |
| D_VDD | 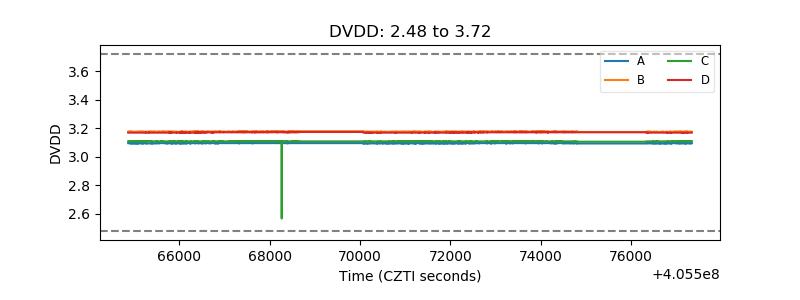 |
| Temperature 1 | 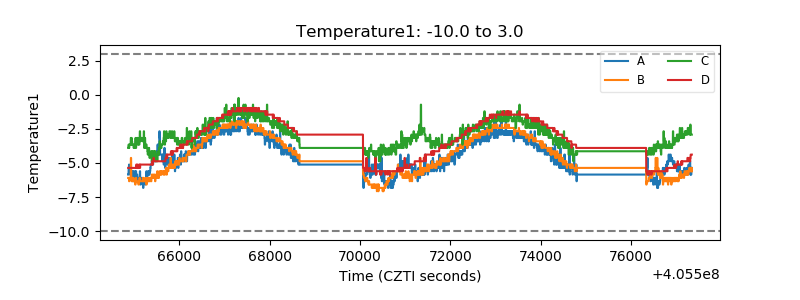 |
| Veto HV Monitor | 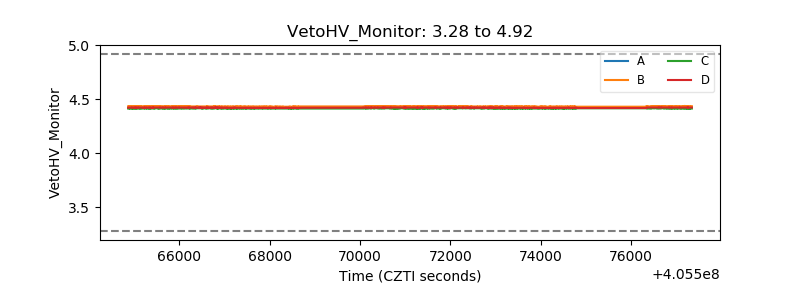 |
| Veto LLD | 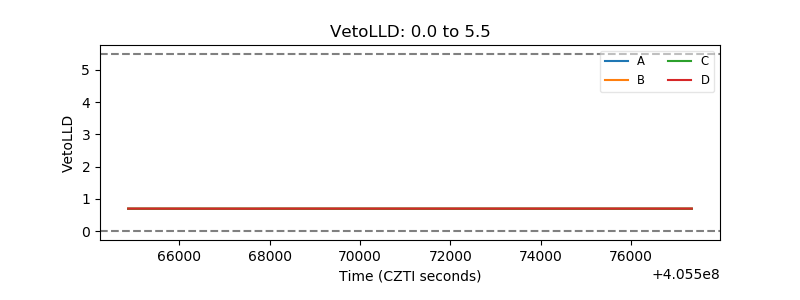 |
| Alpha Counter | 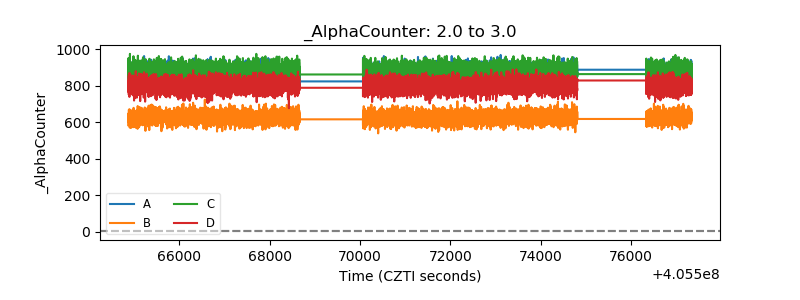 |
| _CPM_Rate | 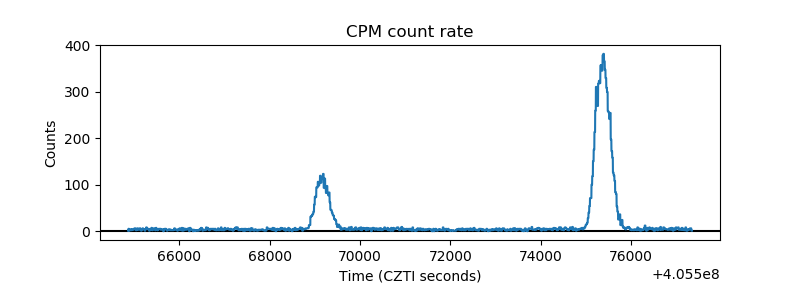 |
| CZT Counter | 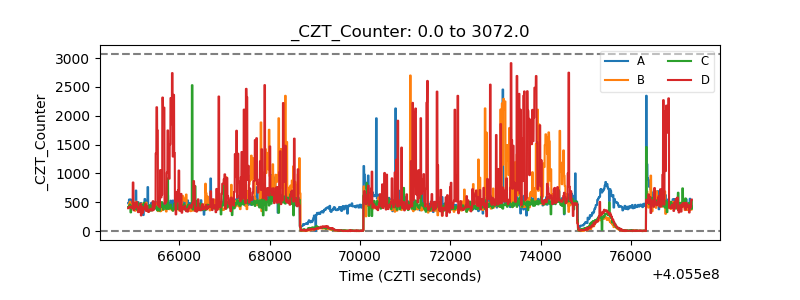 |
| +2.5 Volts monitor | 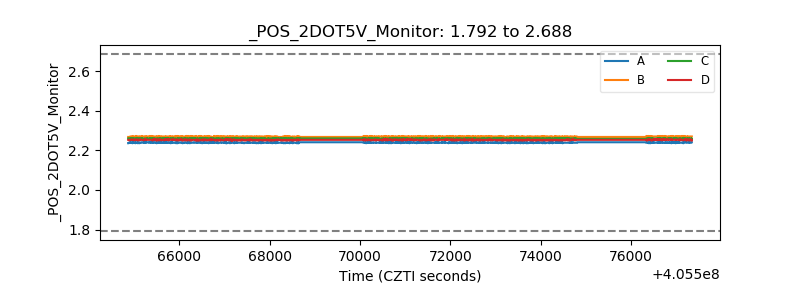 |
| +5 Volts monitor | 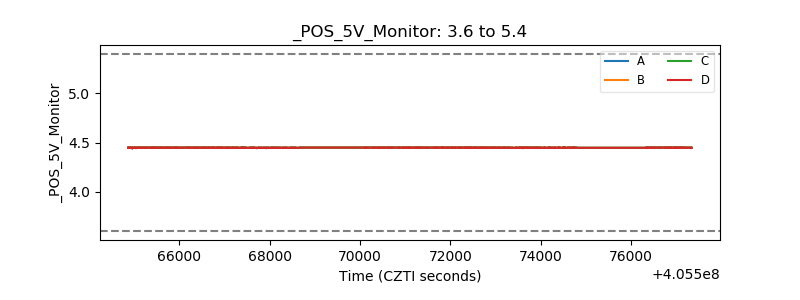 |
| _ROLL_ROT | 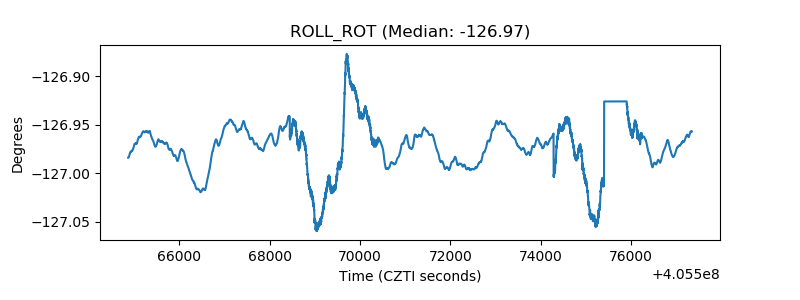 |
| _Roll_DEC | 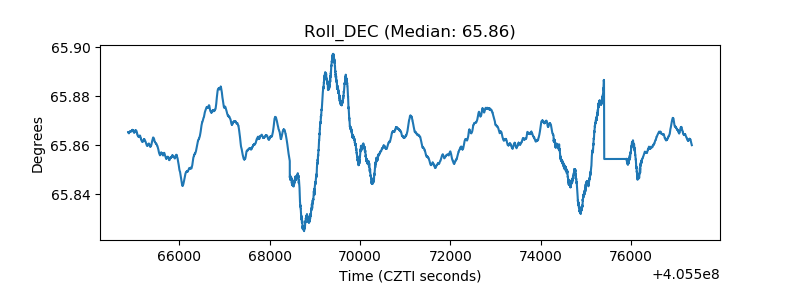 |
| _Roll_RA | 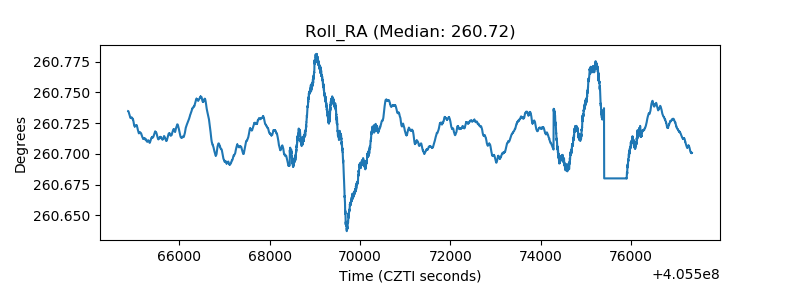 |
| Veto Counter | 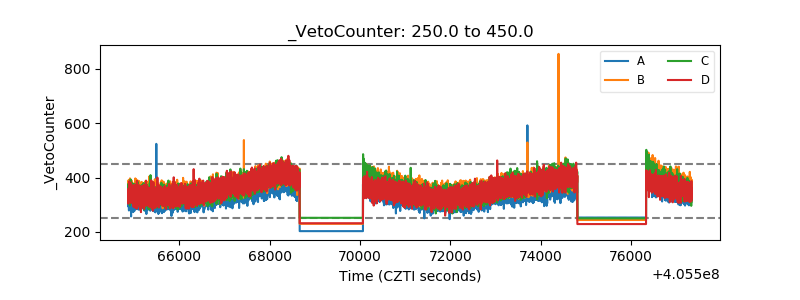 |