| Param | Original file | Final file |
|---|---|---|
| Filename | modeM0/AS1A12_018T01_9000005386_38457cztM0_level2.fits | modeM0/AS1A12_018T01_9000005386_38457cztM0_level2_quad_clean.evt |
| Size (bytes) | 354,041,280 | 91,134,720 |
| Size | 337.6 MB | 86.9 MB |
| Events in quadrant A | 2,849,795 | 620,371 |
| Events in quadrant B | 2,590,416 | 631,855 |
| Events in quadrant C | 2,728,243 | 600,904 |
| Events in quadrant D | 4,508,002 | 520,840 |
| Mode SS | |||
|---|---|---|---|
| Quadrant | BADHDUFLAG | Total packets | Discarded packets |
| A | 0 | 112 | 0 |
| B | 0 | 112 | 0 |
| C | 0 | 112 | 0 |
| D | 0 | 112 | 0 |
| Mode M9 | |||
|---|---|---|---|
| Quadrant | BADHDUFLAG | Total packets | Discarded packets |
| A | 0 | 20 | 0 |
| B | 0 | 20 | 0 |
| C | 0 | 20 | 0 |
| D | 0 | 21 | 0 |
| Mode M0 | |||
|---|---|---|---|
| Quadrant | BADHDUFLAG | Total packets | Discarded packets |
| A | 0 | 11855 | 3 |
| B | 0 | 11417 | 2 |
| C | 0 | 11630 | 2 |
| D | 0 | 17238 | 2 |
| Quadrant | Total seconds | Saturated seconds | Saturation percentage |
|---|---|---|---|
| A | 5509 | 9 | 0.163369% |
| B | 5509 | 27 | 0.490107% |
| C | 5509 | 20 | 0.363042% |
| D | 5509 | 415 | 7.533128% |
Noise dominated data is calculated using 1-second bins in cleaned event files. If a bin has >2000 counts, and if more than 50% of those come from <1% of pixels, then it is considered to be noise-dominated and hence unusable.
| Quadrant | # 1 sec bins | Bins with >0 counts | Bins with >2000 counts | High rate bins dominated by noise | Noise dominated (total time) | Noise dominated (detector-on time) | Marked lightcurve |
|---|---|---|---|---|---|---|---|
| A | 7152 | 5510 | 5 | 5 | 0.07% | 0.09% | 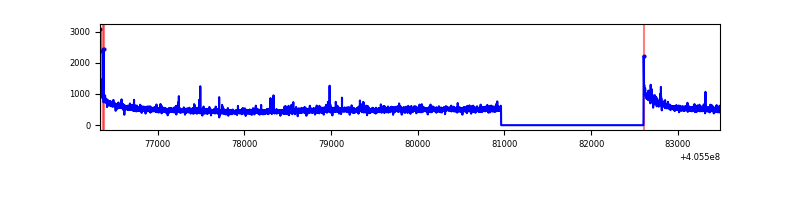 |
| B | 7152 | 5510 | 18 | 18 | 0.25% | 0.33% | 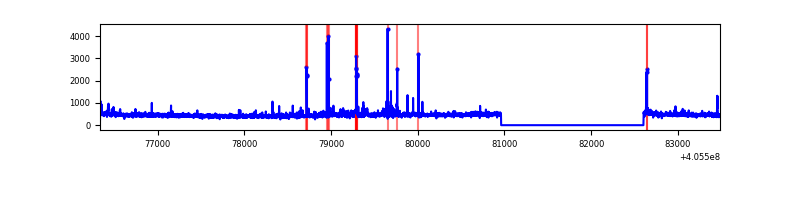 |
| C | 7152 | 5510 | 16 | 16 | 0.22% | 0.29% | 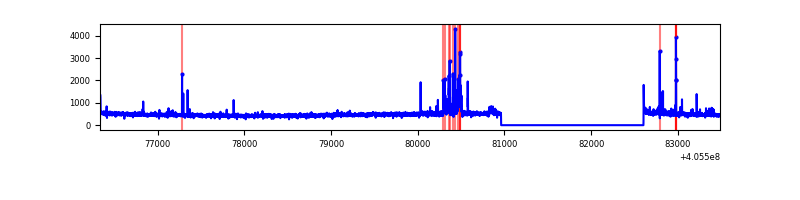 |
| D | 7152 | 5510 | 362 | 362 | 5.06% | 6.57% | 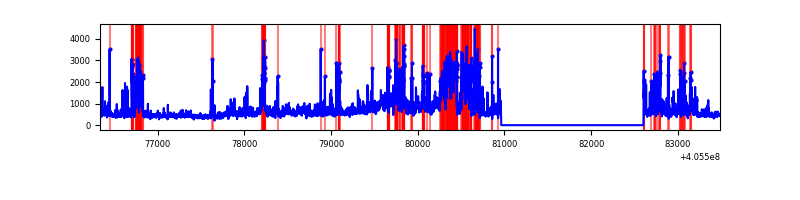 |
Top three noisy pixels from each quadrant. If the there are fewer than three noisy pixels in the level2.evt file, extra rows are filled as -1
| Pixel properties | Quadrant properties | ||||||
|---|---|---|---|---|---|---|---|
| Quadrant | DetID | PixID | Counts | Sigma | Mean | Median | Sigma |
| A | 10 | 83 | 399953 | 3218.51 | 614 | 602 | 124.1 |
| A | 12 | 189 | 38148 | 302.6 | 614 | 602 | 124.1 |
| A | 13 | 248 | 16112 | 125.0 | 614 | 602 | 124.1 |
| B | 0 | 183 | 84254 | 711.96 | 608 | 591 | 117.5 |
| B | 5 | 184 | 31365 | 261.88 | 608 | 591 | 117.5 |
| B | 15 | 201 | 22977 | 190.5 | 608 | 591 | 117.5 |
| C | 15 | 214 | 233153 | 1694.92 | 591 | 596 | 137.2 |
| C | 14 | 254 | 121104 | 878.28 | 591 | 596 | 137.2 |
| C | 2 | 16 | 35227 | 252.4 | 591 | 596 | 137.2 |
| D | 13 | 249 | 810655 | 5821.64 | 572 | 556 | 139.2 |
| D | 12 | 235 | 537766 | 3860.57 | 572 | 556 | 139.2 |
| D | 10 | 118 | 406505 | 2917.29 | 572 | 556 | 139.2 |
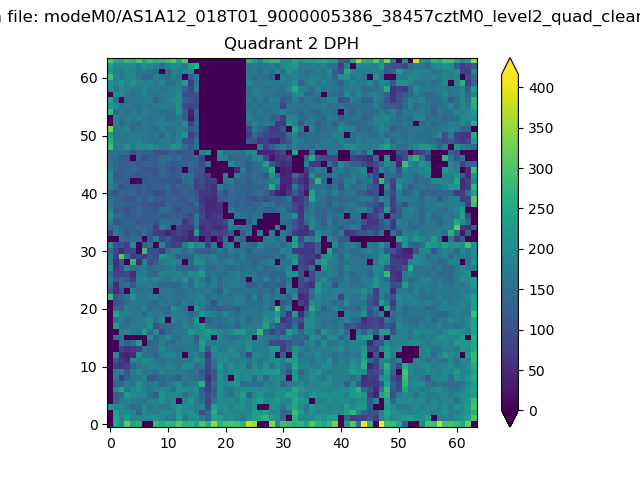
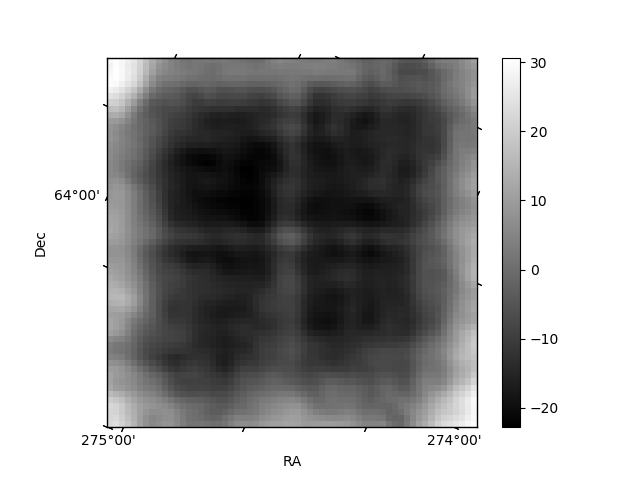
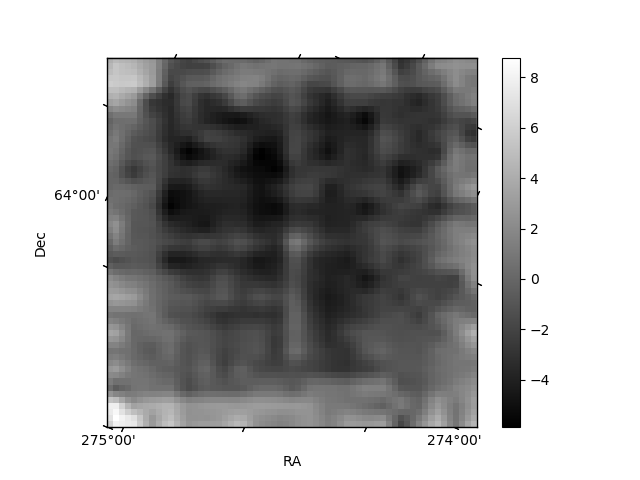
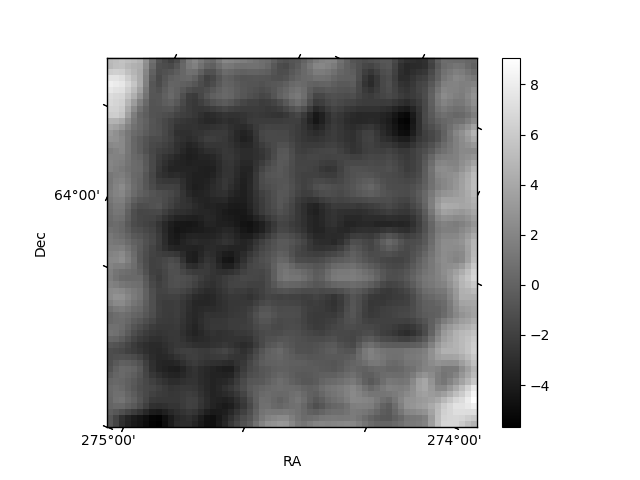
Histogram calculated using DETX and DETY for each event in the final _common_clean file
| Quadrant A | 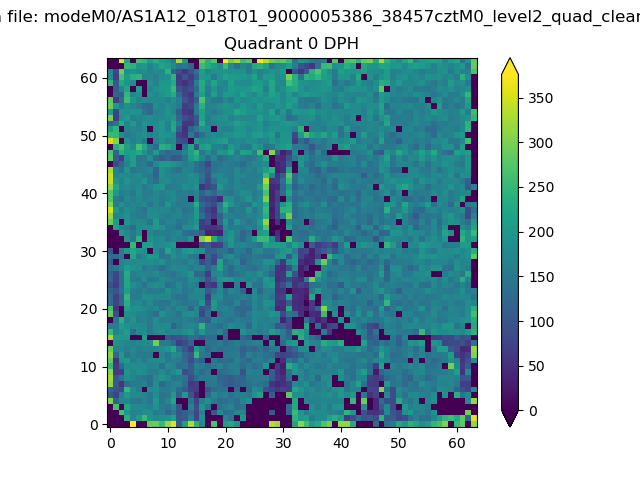 |
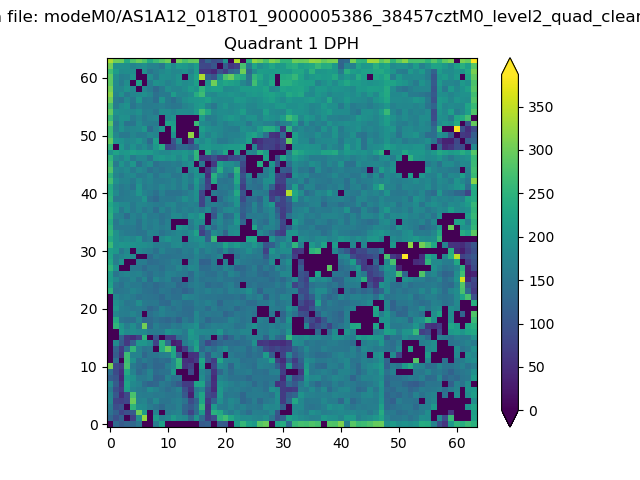 |
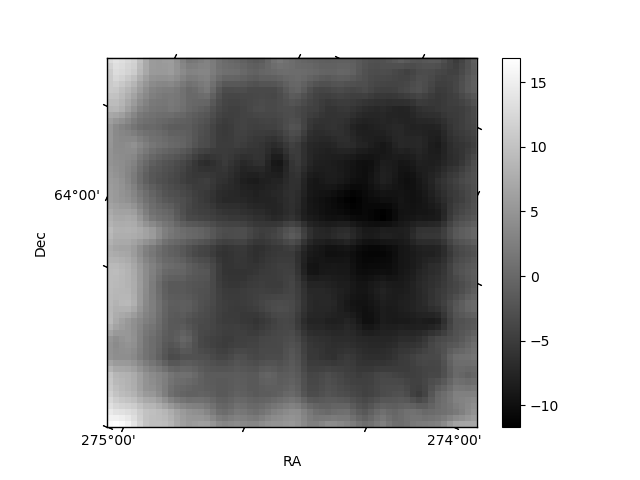
Quadrant B |
|---|---|---|---|
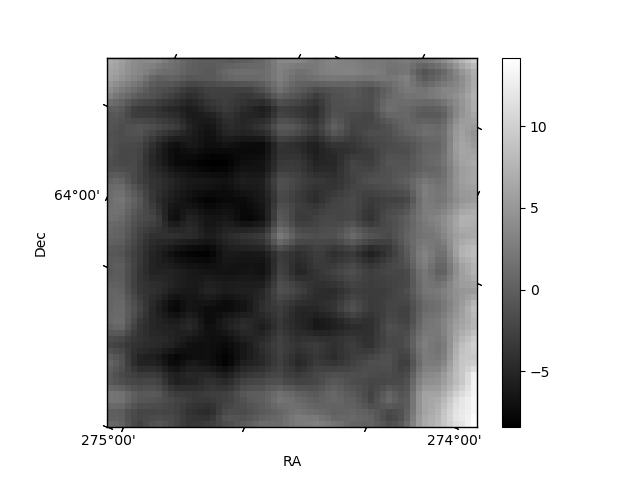
| Quadrant D | 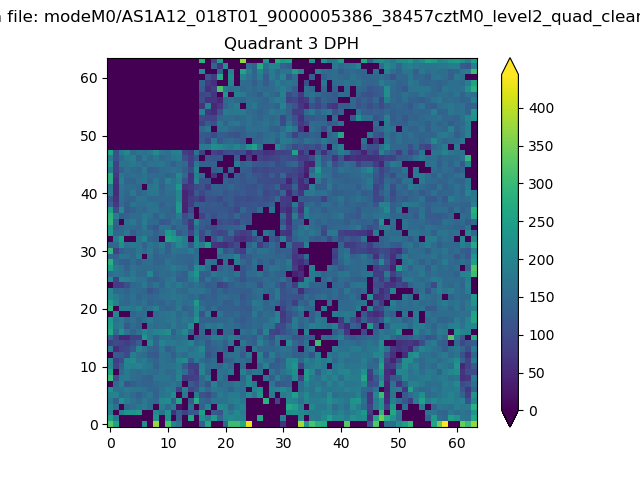 |
 |
Quadrant C |
| Plot type | Count rate plots | Images |
|---|---|---|
| Comparison with Poisson distribution Blue bars denote a histogram of data divided into 1 sec bins. Red curve is a Poisson curve with rate = median count rate of data. |
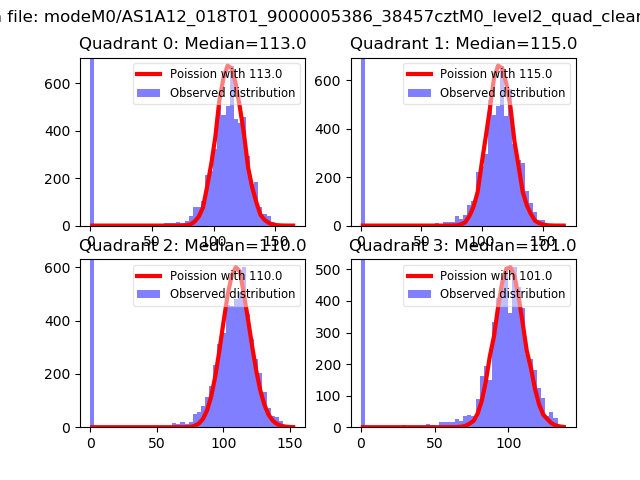 |
 |
| Quadrant-wise count rates Data is divided into 100 sec bins |
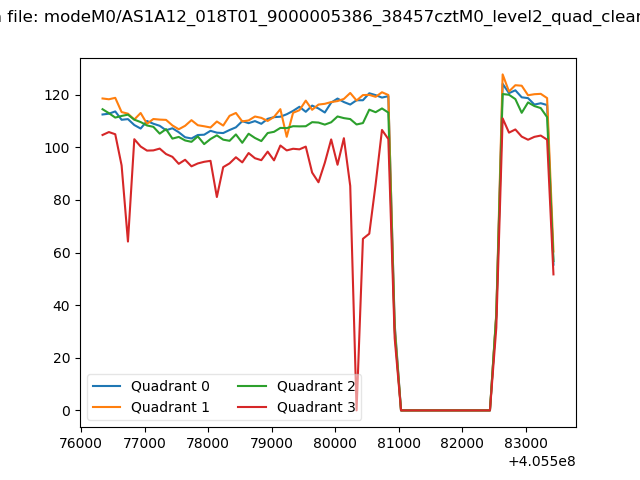 |
|
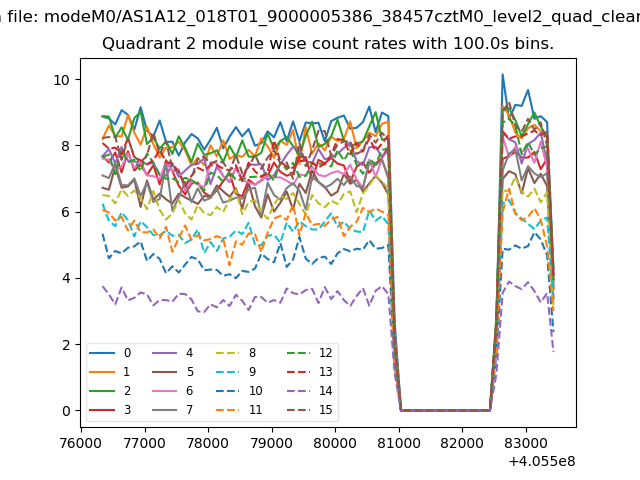
| Module-wise count rates for Quadrant A Data is divided into 100 sec bins |
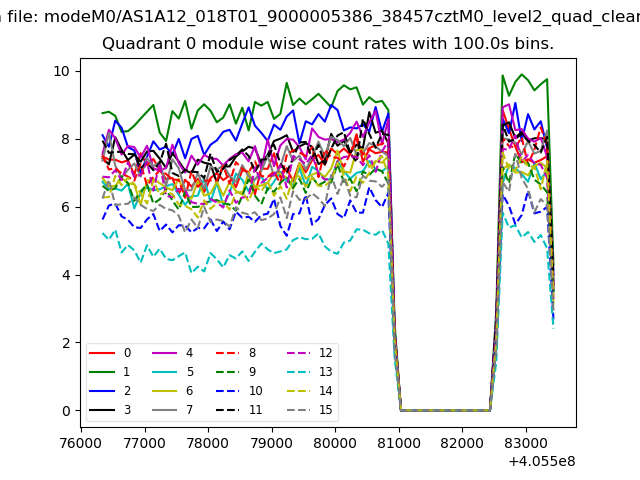 |
 |
| Module-wise count rates for Quadrant B Data is divided into 100 sec bins |
 |
 |
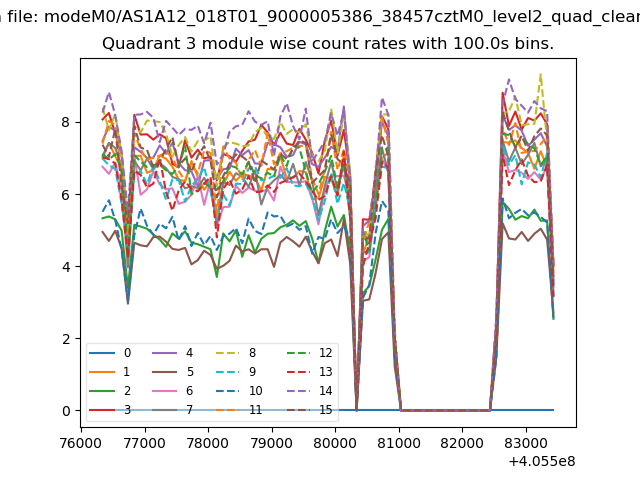
| Module-wise count rates for Quadrant C Data is divided into 100 sec bins |
 |
 |
| Module-wise count rates for Quadrant D Data is divided into 100 sec bins |
 |
 |
| Parameter | Plot |
|---|---|
| CZT HV Monitor | 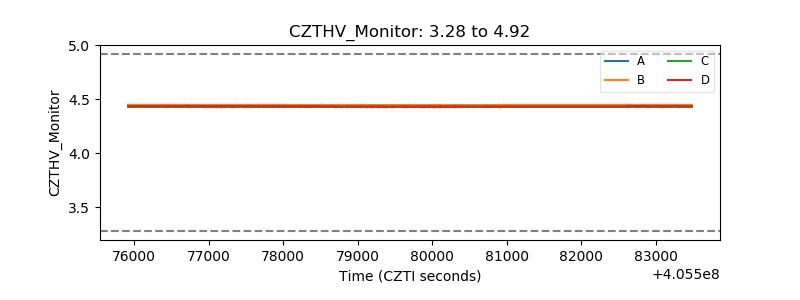 |
| D_VDD | 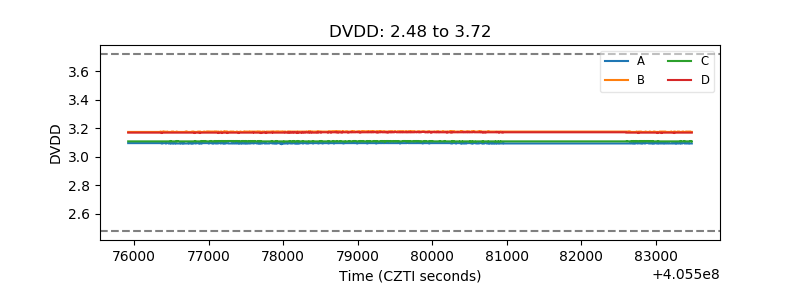 |
| Temperature 1 | 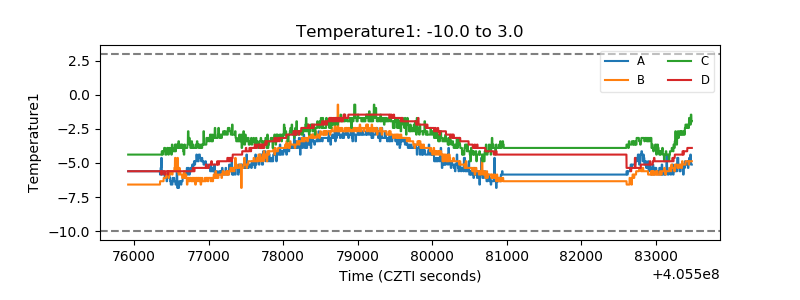 |
| Veto HV Monitor | 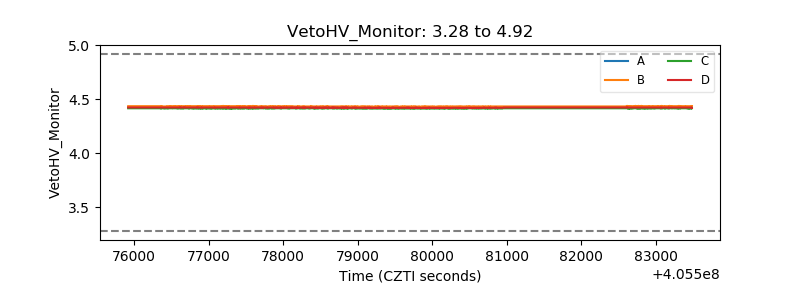 |
| Veto LLD | 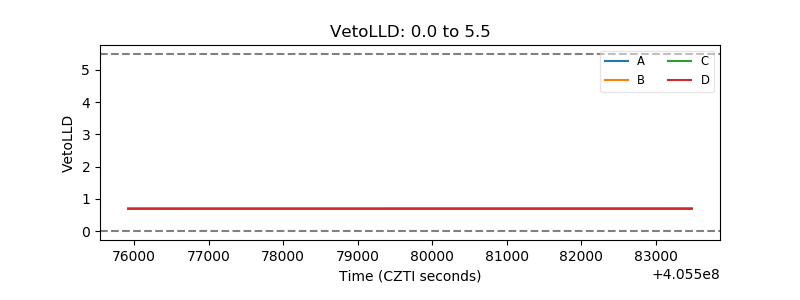 |
| Alpha Counter | 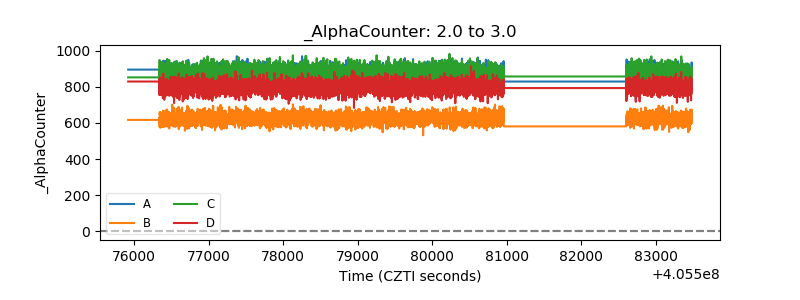 |
| _CPM_Rate | 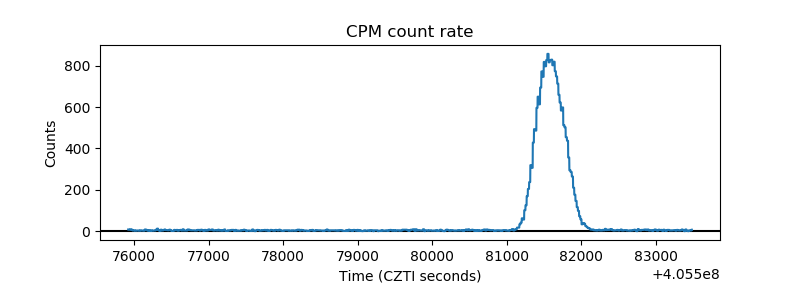 |
| CZT Counter | 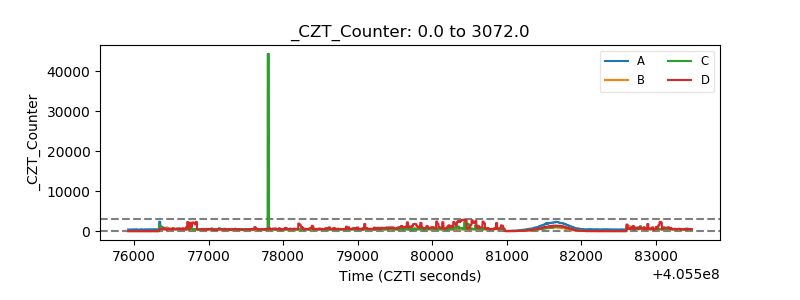 |
| +2.5 Volts monitor | 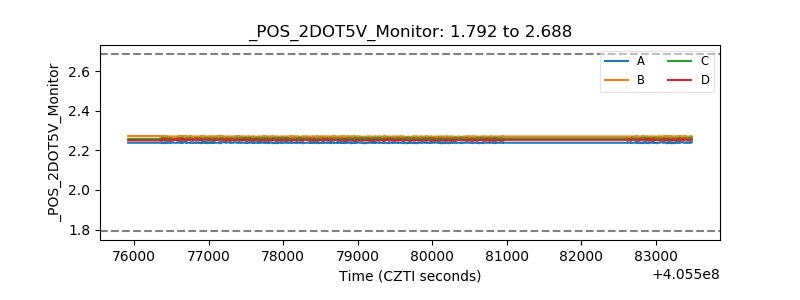 |
| +5 Volts monitor | 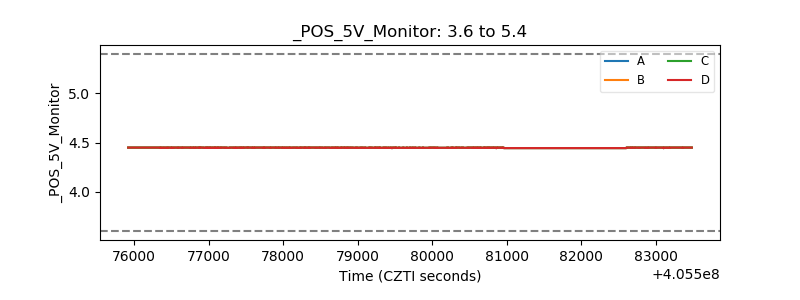 |
| _ROLL_ROT | 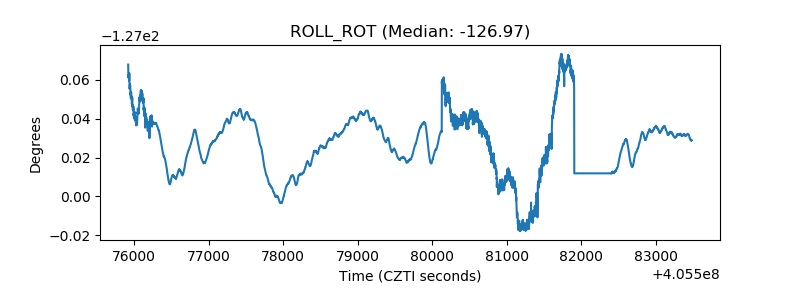 |
| _Roll_DEC | 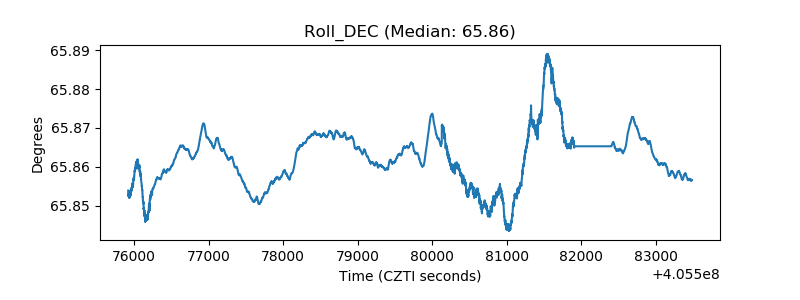 |
| _Roll_RA | 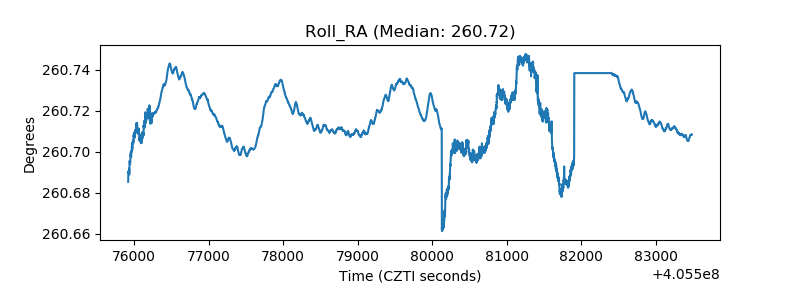 |
| Veto Counter | 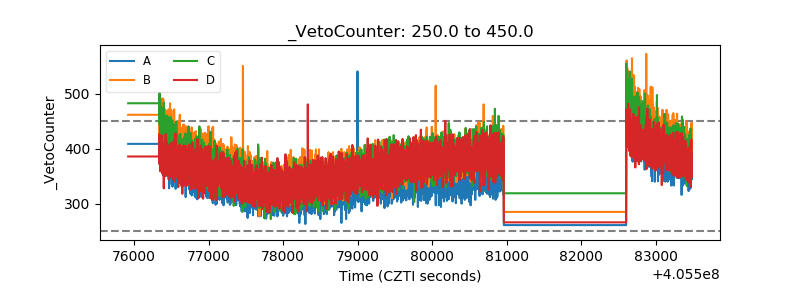 |