| Param | Original file | Final file |
|---|---|---|
| Filename | modeM0/AS1A12_018T01_9000005386_38459cztM0_level2.fits | modeM0/AS1A12_018T01_9000005386_38459cztM0_level2_quad_clean.evt |
| Size (bytes) | 362,289,600 | 91,221,120 |
| Size | 345.5 MB | 87.0 MB |
| Events in quadrant A | 2,825,207 | 629,220 |
| Events in quadrant B | 2,866,903 | 636,626 |
| Events in quadrant C | 2,602,886 | 600,090 |
| Events in quadrant D | 4,701,849 | 523,344 |
| Mode SS | |||
|---|---|---|---|
| Quadrant | BADHDUFLAG | Total packets | Discarded packets |
| A | 0 | 110 | 0 |
| B | 0 | 110 | 0 |
| C | 0 | 110 | 0 |
| D | 0 | 110 | 0 |
| Mode M9 | |||
|---|---|---|---|
| Quadrant | BADHDUFLAG | Total packets | Discarded packets |
| A | 0 | 19 | 0 |
| B | 0 | 19 | 0 |
| C | 0 | 19 | 0 |
| D | 0 | 20 | 0 |
| Mode M0 | |||
|---|---|---|---|
| Quadrant | BADHDUFLAG | Total packets | Discarded packets |
| A | 0 | 11665 | 3 |
| B | 0 | 12004 | 2 |
| C | 0 | 11025 | 2 |
| D | 0 | 17574 | 2 |
| Quadrant | Total seconds | Saturated seconds | Saturation percentage |
|---|---|---|---|
| A | 5319 | 17 | 0.319609% |
| B | 5319 | 63 | 1.184433% |
| C | 5319 | 10 | 0.188005% |
| D | 5319 | 407 | 7.651814% |
Noise dominated data is calculated using 1-second bins in cleaned event files. If a bin has >2000 counts, and if more than 50% of those come from <1% of pixels, then it is considered to be noise-dominated and hence unusable.
| Quadrant | # 1 sec bins | Bins with >0 counts | Bins with >2000 counts | High rate bins dominated by noise | Noise dominated (total time) | Noise dominated (detector-on time) | Marked lightcurve |
|---|---|---|---|---|---|---|---|
| A | 7112 | 5320 | 9 | 9 | 0.13% | 0.17% | 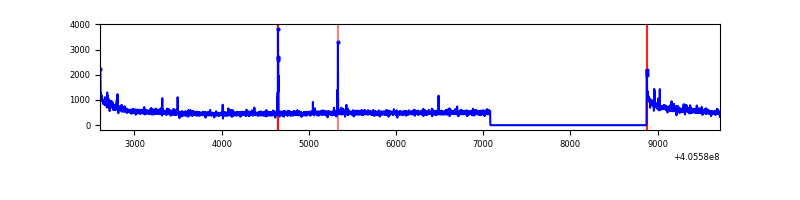 |
| B | 7112 | 5320 | 46 | 46 | 0.65% | 0.86% | 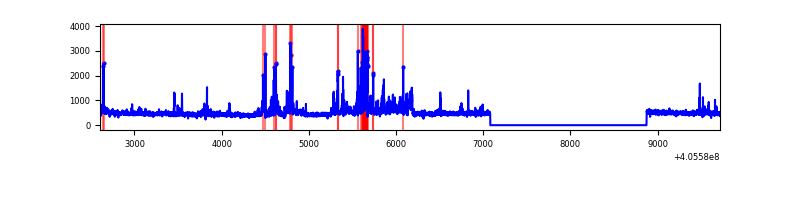 |
| C | 7112 | 5320 | 9 | 9 | 0.13% | 0.17% |  |
| D | 7112 | 5320 | 370 | 370 | 5.20% | 6.95% | 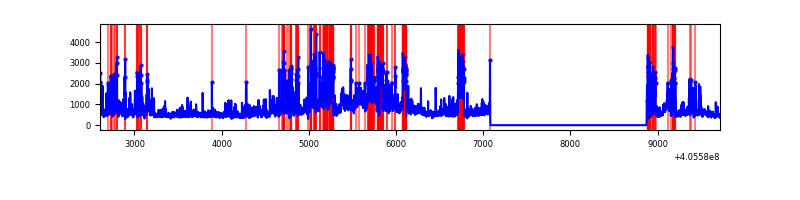 |
Top three noisy pixels from each quadrant. If the there are fewer than three noisy pixels in the level2.evt file, extra rows are filled as -1
| Pixel properties | Quadrant properties | ||||||
|---|---|---|---|---|---|---|---|
| Quadrant | DetID | PixID | Counts | Sigma | Mean | Median | Sigma |
| A | 10 | 83 | 390914 | 3214.4 | 603 | 591 | 121.4 |
| A | 12 | 189 | 35517 | 287.62 | 603 | 591 | 121.4 |
| A | 10 | 248 | 24140 | 193.93 | 603 | 591 | 121.4 |
| B | 5 | 184 | 253260 | 2230.53 | 595 | 579 | 113.3 |
| B | 4 | 232 | 120365 | 1057.4 | 595 | 579 | 113.3 |
| B | 15 | 32 | 40969 | 356.54 | 595 | 579 | 113.3 |
| C | 15 | 214 | 225696 | 1675.96 | 577 | 580 | 134.3 |
| C | 14 | 254 | 47864 | 352.02 | 577 | 580 | 134.3 |
| C | 4 | 254 | 20519 | 148.44 | 577 | 580 | 134.3 |
| D | 12 | 235 | 1236673 | 9117.13 | 561 | 544 | 135.6 |
| D | 13 | 249 | 531725 | 3917.75 | 561 | 544 | 135.6 |
| D | 10 | 118 | 424699 | 3128.37 | 561 | 544 | 135.6 |
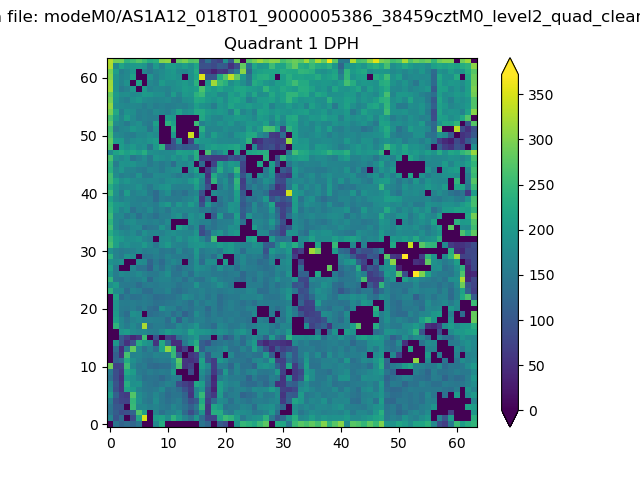
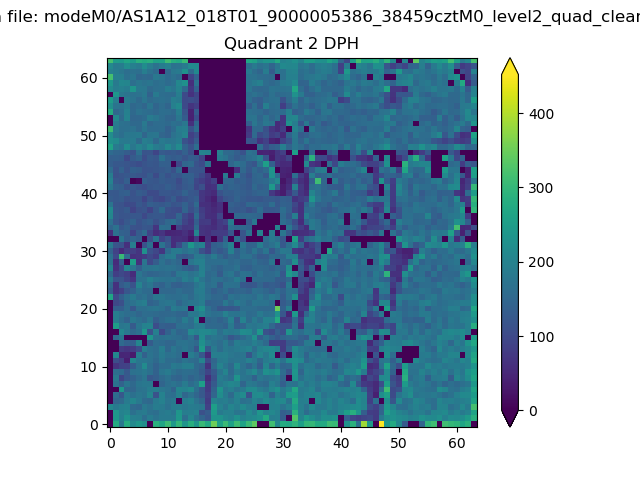
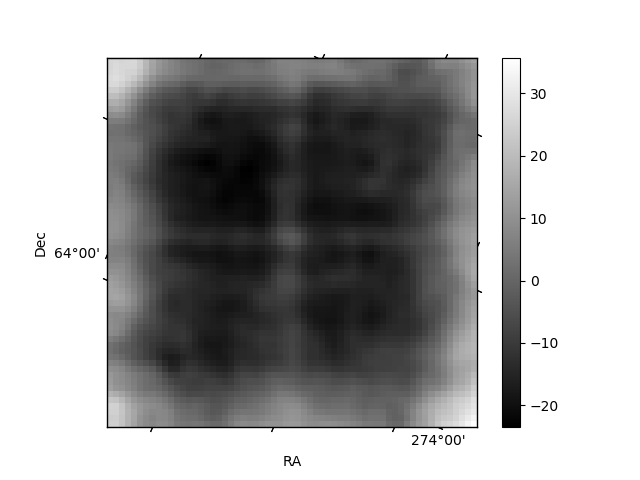
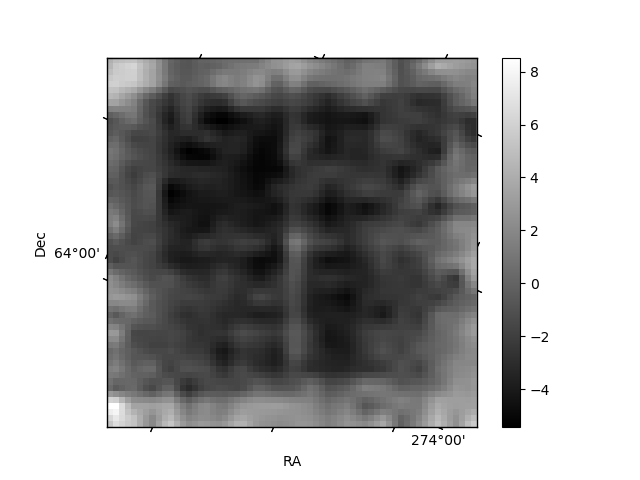
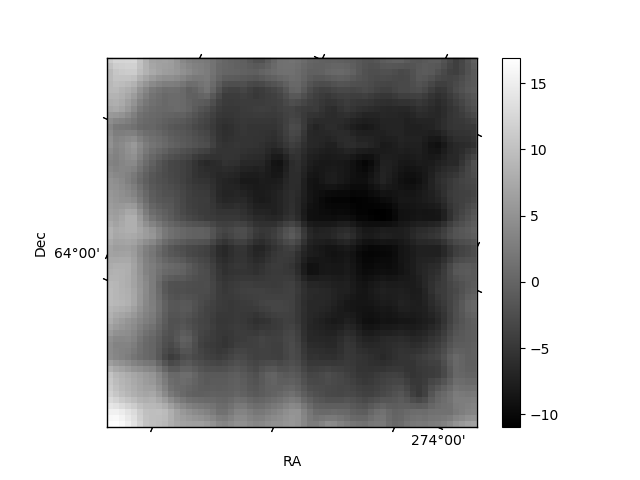
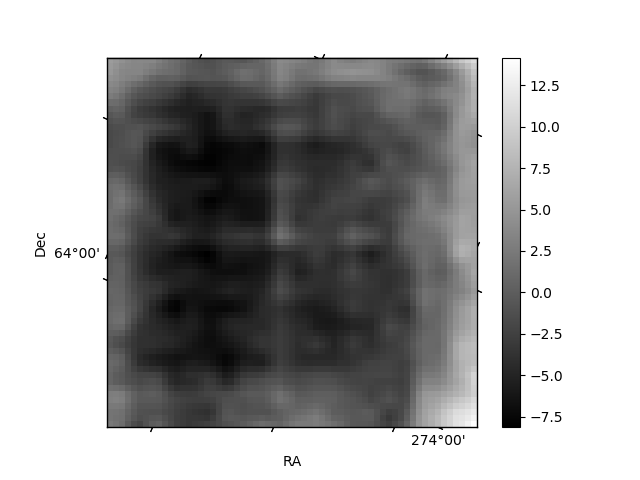
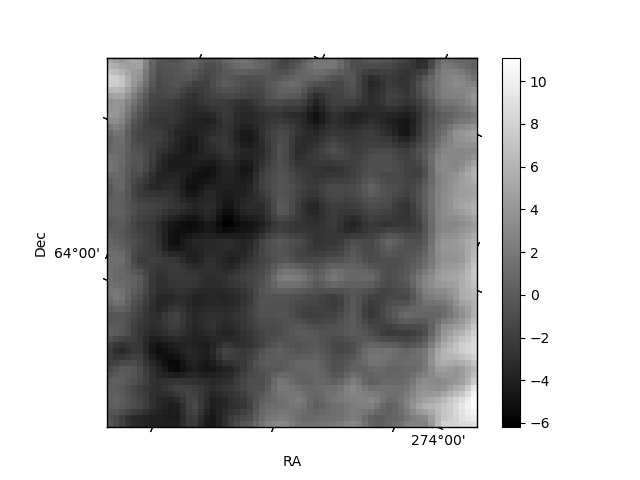
Histogram calculated using DETX and DETY for each event in the final _common_clean file
| Quadrant A | 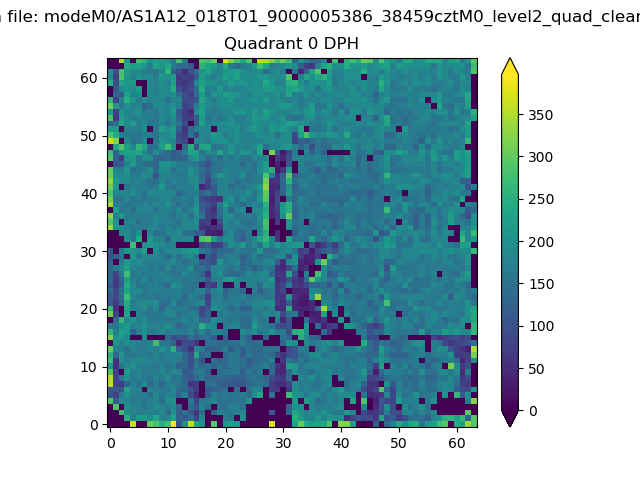 |
 |
Quadrant B |
|---|---|---|---|
| Quadrant D | 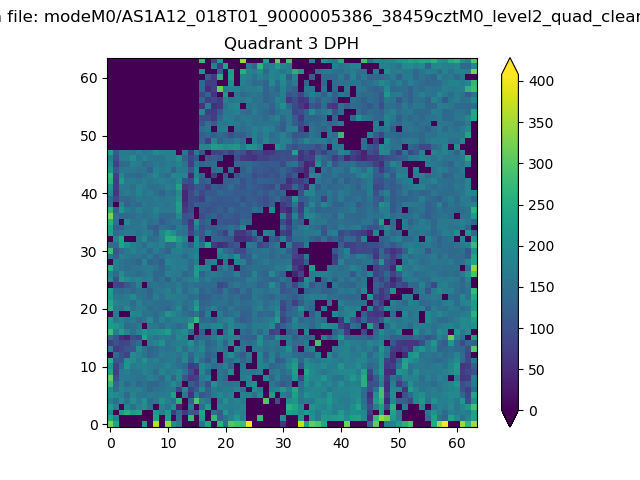 |
 |
Quadrant C |
| Plot type | Count rate plots | Images |
|---|---|---|
| Comparison with Poisson distribution Blue bars denote a histogram of data divided into 1 sec bins. Red curve is a Poisson curve with rate = median count rate of data. |
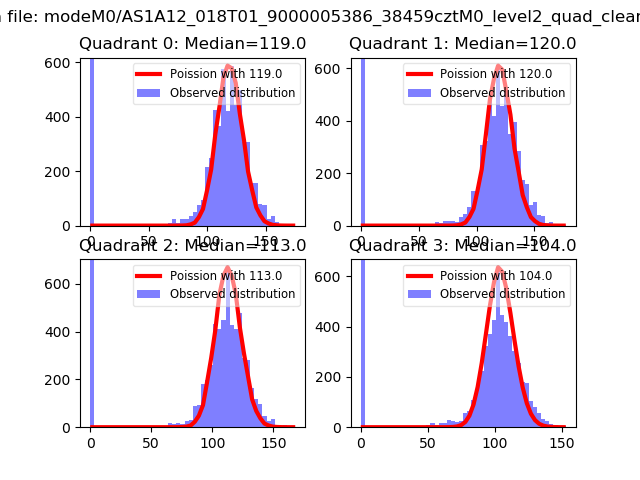 |
 |
| Quadrant-wise count rates Data is divided into 100 sec bins |
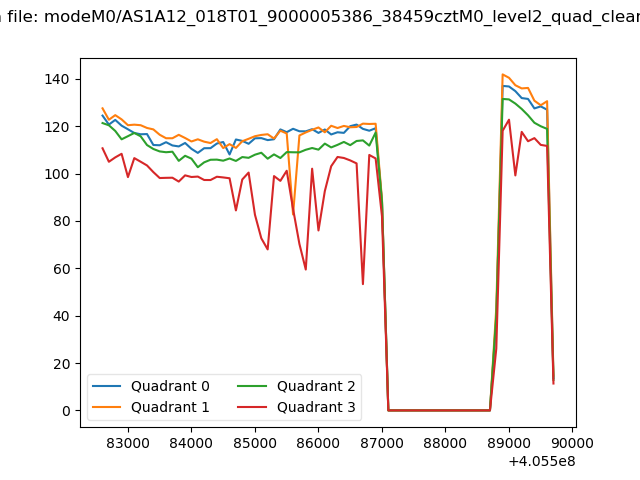 |
|
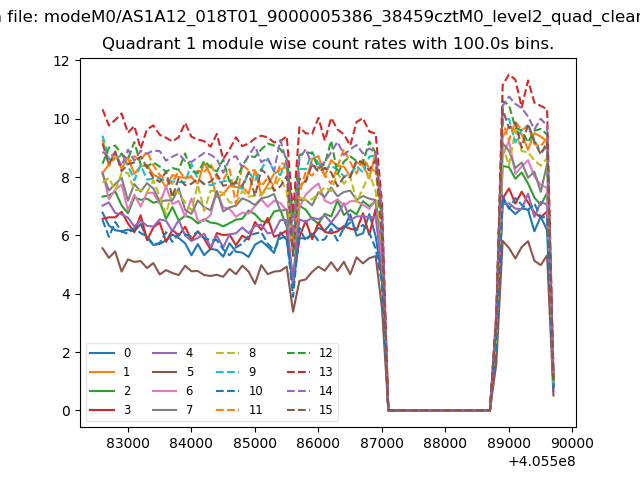
| Module-wise count rates for Quadrant A Data is divided into 100 sec bins |
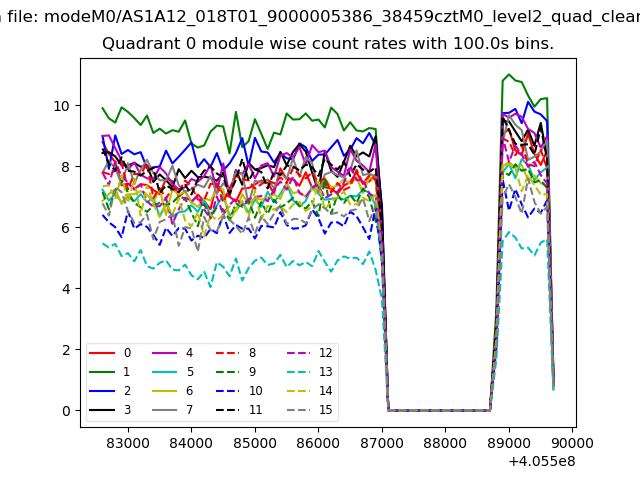 |
 |
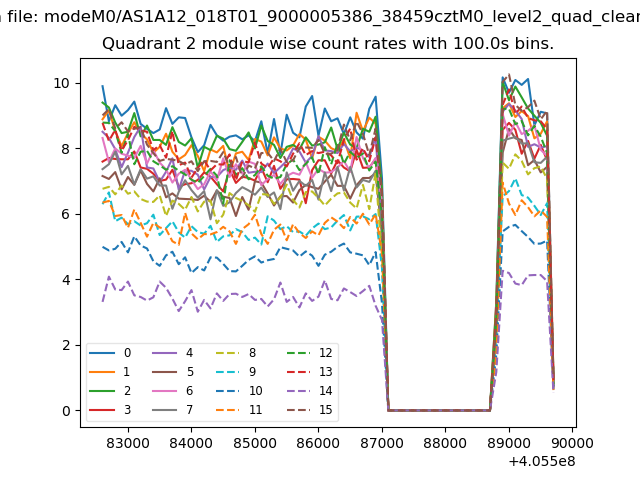
| Module-wise count rates for Quadrant B Data is divided into 100 sec bins |
 |
 |
| Module-wise count rates for Quadrant C Data is divided into 100 sec bins |
 |
 |
| Module-wise count rates for Quadrant D Data is divided into 100 sec bins |
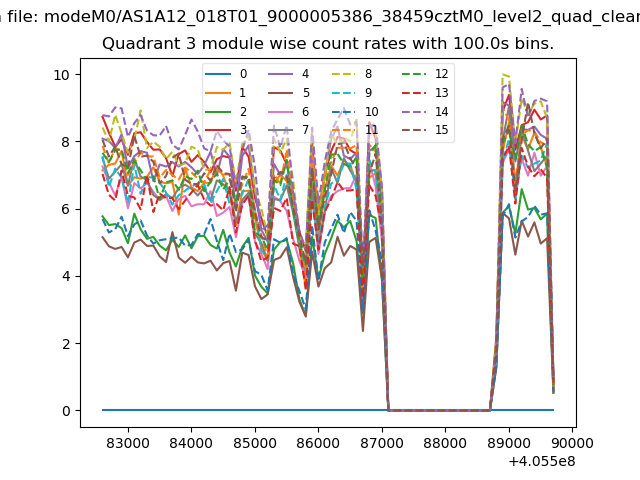 |
 |
| Parameter | Plot |
|---|---|
| CZT HV Monitor | 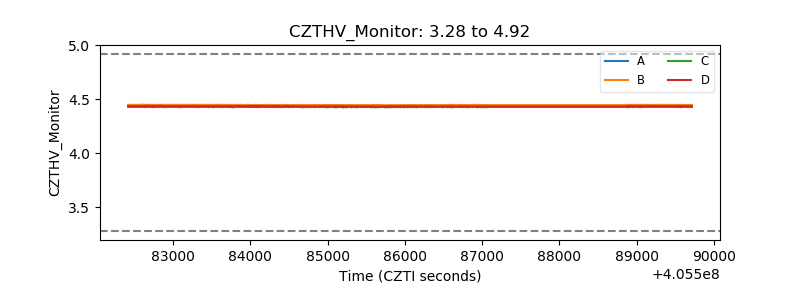 |
| D_VDD | 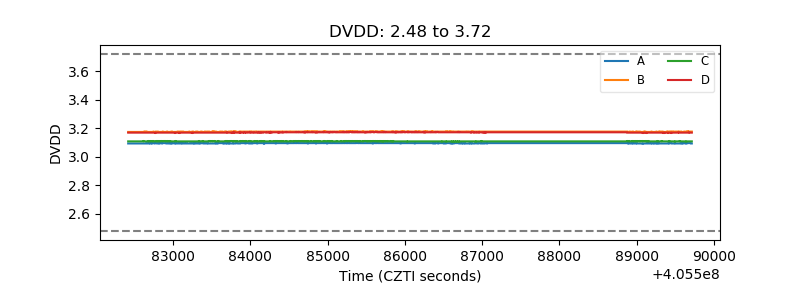 |
| Temperature 1 | 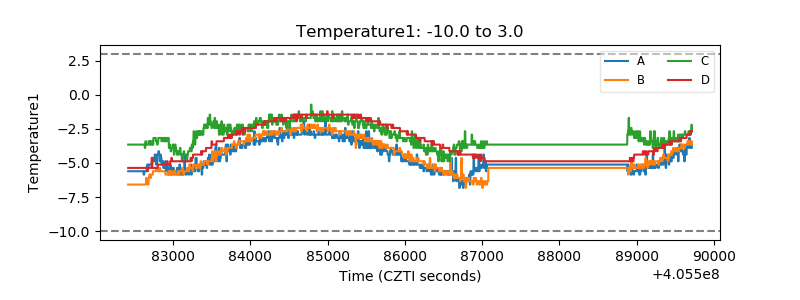 |
| Veto HV Monitor |  |
| Veto LLD | 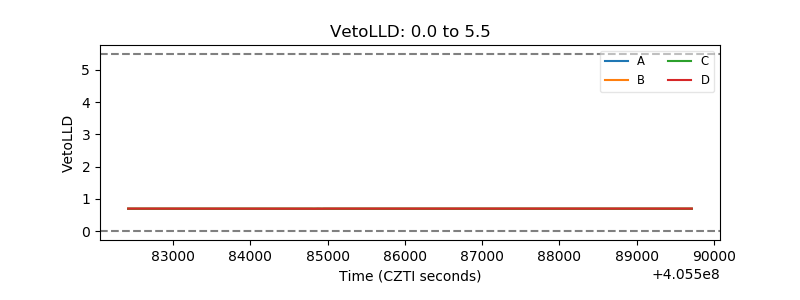 |
| Alpha Counter | 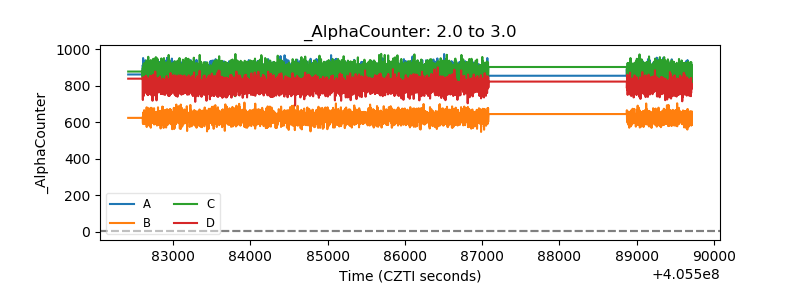 |
| _CPM_Rate | 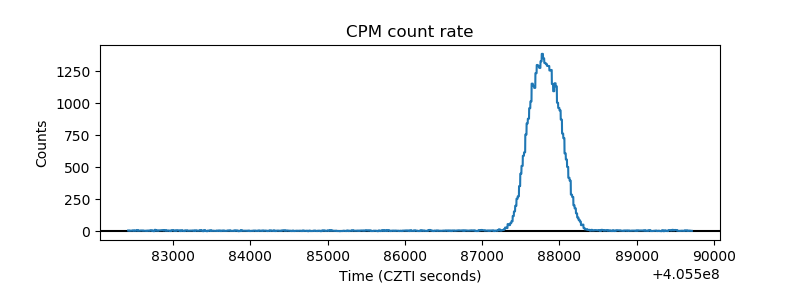 |
| CZT Counter | 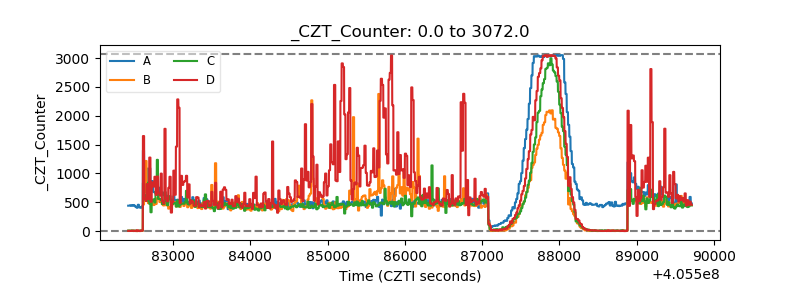 |
| +2.5 Volts monitor | 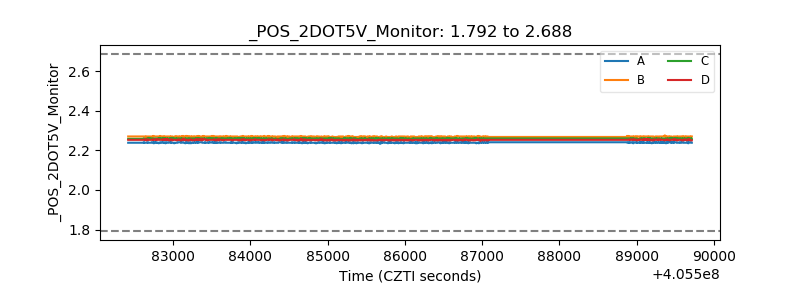 |
| +5 Volts monitor | 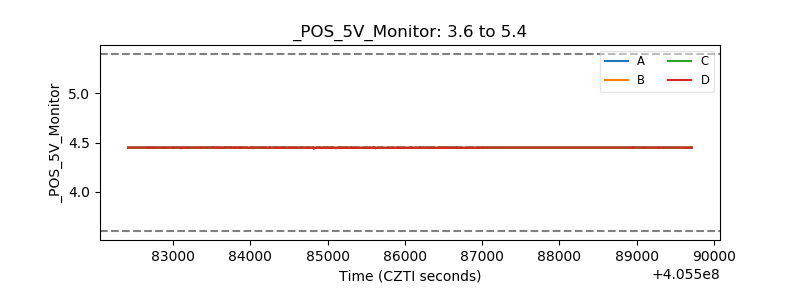 |
| _ROLL_ROT | 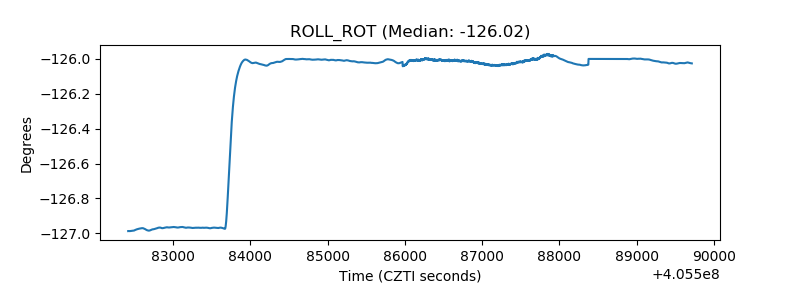 |
| _Roll_DEC |  |
| _Roll_RA | 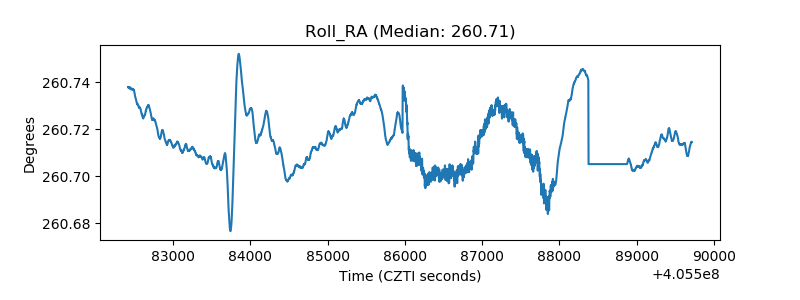 |
| Veto Counter | 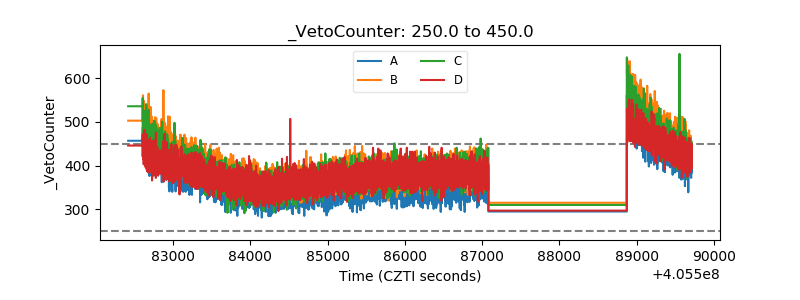 |